Jan Esper, prominent in early Climate Audit posts as an adamant serial non-archiver, has joined with 17 other tree ring specialists, to publish “Ranking of tree-ring based temperature reconstructions of the past millennium” (pdf). This assesses 39 long tree ring temperature reconstructions. The assessment is accompanied by an archive containing 39 reconstruction versions, together with the underlying measurement data for 33 of 39 reconstructions. (It seems odd that measurement data would continue to be withheld for six sites, but, hey, it’s climate science.)
Because I’ve been recently looking at data used in Gergis et al, I looked first at Esper’s consideration of Oroko, one of two long proxies retained in Gergis screening. I’ve long sought Oroko measurement data, first requesting it from Ed Cook in 2003. Cook refused. Though Oroko reconstructions have been used over the years in multiproxy studies and by IPCC, the underlying measurement data has never made archived The archive for Esper et al 2016 is thus the very first archive of Oroko measurement data (though unfortunately it seems that even the present archive is incomplete and not up-to-date).
Despite claims to use the most recent reconstruction, Esper’s Oroko temperature reconstruction is decidedly out of date. Worse, it uses a n Oroko “reconstruction” in which Cook replaced proxy data (which went down after 1960) with instrumental data (which went up) – in a contemporary variation of what is popularly known as “Mike’s Nature trick”, though Mike’s Nature trick, as discussed at CA here, was a little different.
In today’s post, I’ll look at the “new” Oroko data, which, needless to say, has some surprises.
My 2003 Attempt to Obtain Oroko Data
To give an idea of just how long Oroko measurement data has been withheld, I originally suggested to Cook in October 2003 that it be archived. Although ATTP and others occasionally claim that I was insufficiently polite in such requests (as a supposed justification for data obstruction), this was not the case, either in this instance or others.
Dear Dr. Cook,
While you have contributed consistently to WDCP, I notice that the Oroko Swamp data has not yet been contributed to WDCP. I presume that this is an oversight and hope that you plan to continue your previous support of a commendable program.
I notice that the data from the Taimir, Yamal and some of the older Tornetrask sites have likewise not been contributed to WDCP, although these sites have been referred to in well-publicized articles. Perhaps you could encourage your collegues to contribute this data to WDCP.
Yours truly,
Stephen McIntyre
On October 19, 2003 at 11:49 a.m., Cook refused the request, expressing some astonishment that I would “apparently expect [him] to continually update the WDCP as the data are generated” and suspicion at my apparent interest in the long data.
Hi Stephen,
As you say, I have contributed consistently to WDCP and will continue to do so, but not always at the pace that you would apparently like. It took me ten years to finish the 4,000 year long Mt Read, Tasmania chronology, which is now fully available on the WDCP. This work is not trivial to do, nor can it be rushed. I have been going down to New Zealand once a year to get more wood related to the Oroko Swamp project and continue to do so in an effort to solidify the chronology and push it back in time. From what I gather from your email, you apparently expect me to continually update the WDCP as the data are generated. I don’t regard that as a very practical way to go since it would lead to a very confusing collection of overlapping, but different, data sets. So, it was not an oversight on my part. Rather, the project is still in progress. I don’t think that I need to apologize for that.
I have no control over other people’s data. I suggest that you contact them directly. Do I dare ask why you appear to be so interested in these long tree-ring data sets?
Regards,
Ed
When I first collated these old emails for this post, I presumed that I would then have been unknown to Cook. At the time, McIntyre and McKitrick 2003 had not been published. Out of interest, I checked contemporary CG2 emails and noticed that a half-hour before Cook’s refusal, Mann had sent out an email (CG2 thread 1566 – rhis email wasn’t in CG1) to the climate community, ever vigilant for dissidents, warning them that the previously unknown “McIntyre” was “yet another shill for industry”, also accusing me of “trying to break into” the FTP site that he would claim a couple of weeks later to have been “public” all along.
At 11:14 19/10/2003 -0400, Michael E. Mann wrote:
FYI–thought you guys should have this (below). This guy “McIntyre” appears to be yet another shill for industry–he appears to be the one who forwarded the the scurrilous “climateskeptic” criticisms of the recent Bradley et al Science paper.Here is an email I sent him a few weeks ago in response to an inquiry. It appears, by the way, that he has been trying to break into our machine (“multiproxy”). Obviously, this character is looking for any little thing he can get ahold of.
…
p.s. I’m setting up my email server so that it automatically rejects emails from the “usual suspects”. You might want to do the same. As they increasingly get automatic reject messages from the scientists, they’ll start to get the picture…
It’s possible that the timing and form of Cook’s refusal was a coincidence, but it’s also possible that it wasn’t. In any event, far from Cook being inconvenienced by “continually” updating the archive as new data became available, Oroko data remained unavailable.
The Oroko Reconstruction in Esper et al 2016
In the first figure (below), I’ve compared the Esper-2016 temperature reconstruction to a chronology that I calculated from the measurement data, both series being scaled to facilitate comparison. Prior to 1958, the temperature reconstruction and my chronology estimate track very closely, with the chronology dated one year earlier than the reconstruction. In a SH context, this means nothing more than the tree ring measurement data has been dated to the calendar year opening the austral summer (consistent with a convention reported at NOAA Paleo), while the reconstruction has been dated to the calendar year closing the austral summer (consistent with Jan-Mar calibration reported in early Cook articles on Oroko).
However, after 1958, the chronology from measurement data and the Esper-2016 reconstruction diverge dramatically. The Esper reconstruction ends on a high note (more than 2 sd units), while the chronology from measurement data ends on a low note. The divergence between temperature “reconstruction” and chronology arose because Cook spliced instrumental data after 1958 into his reconstruction.
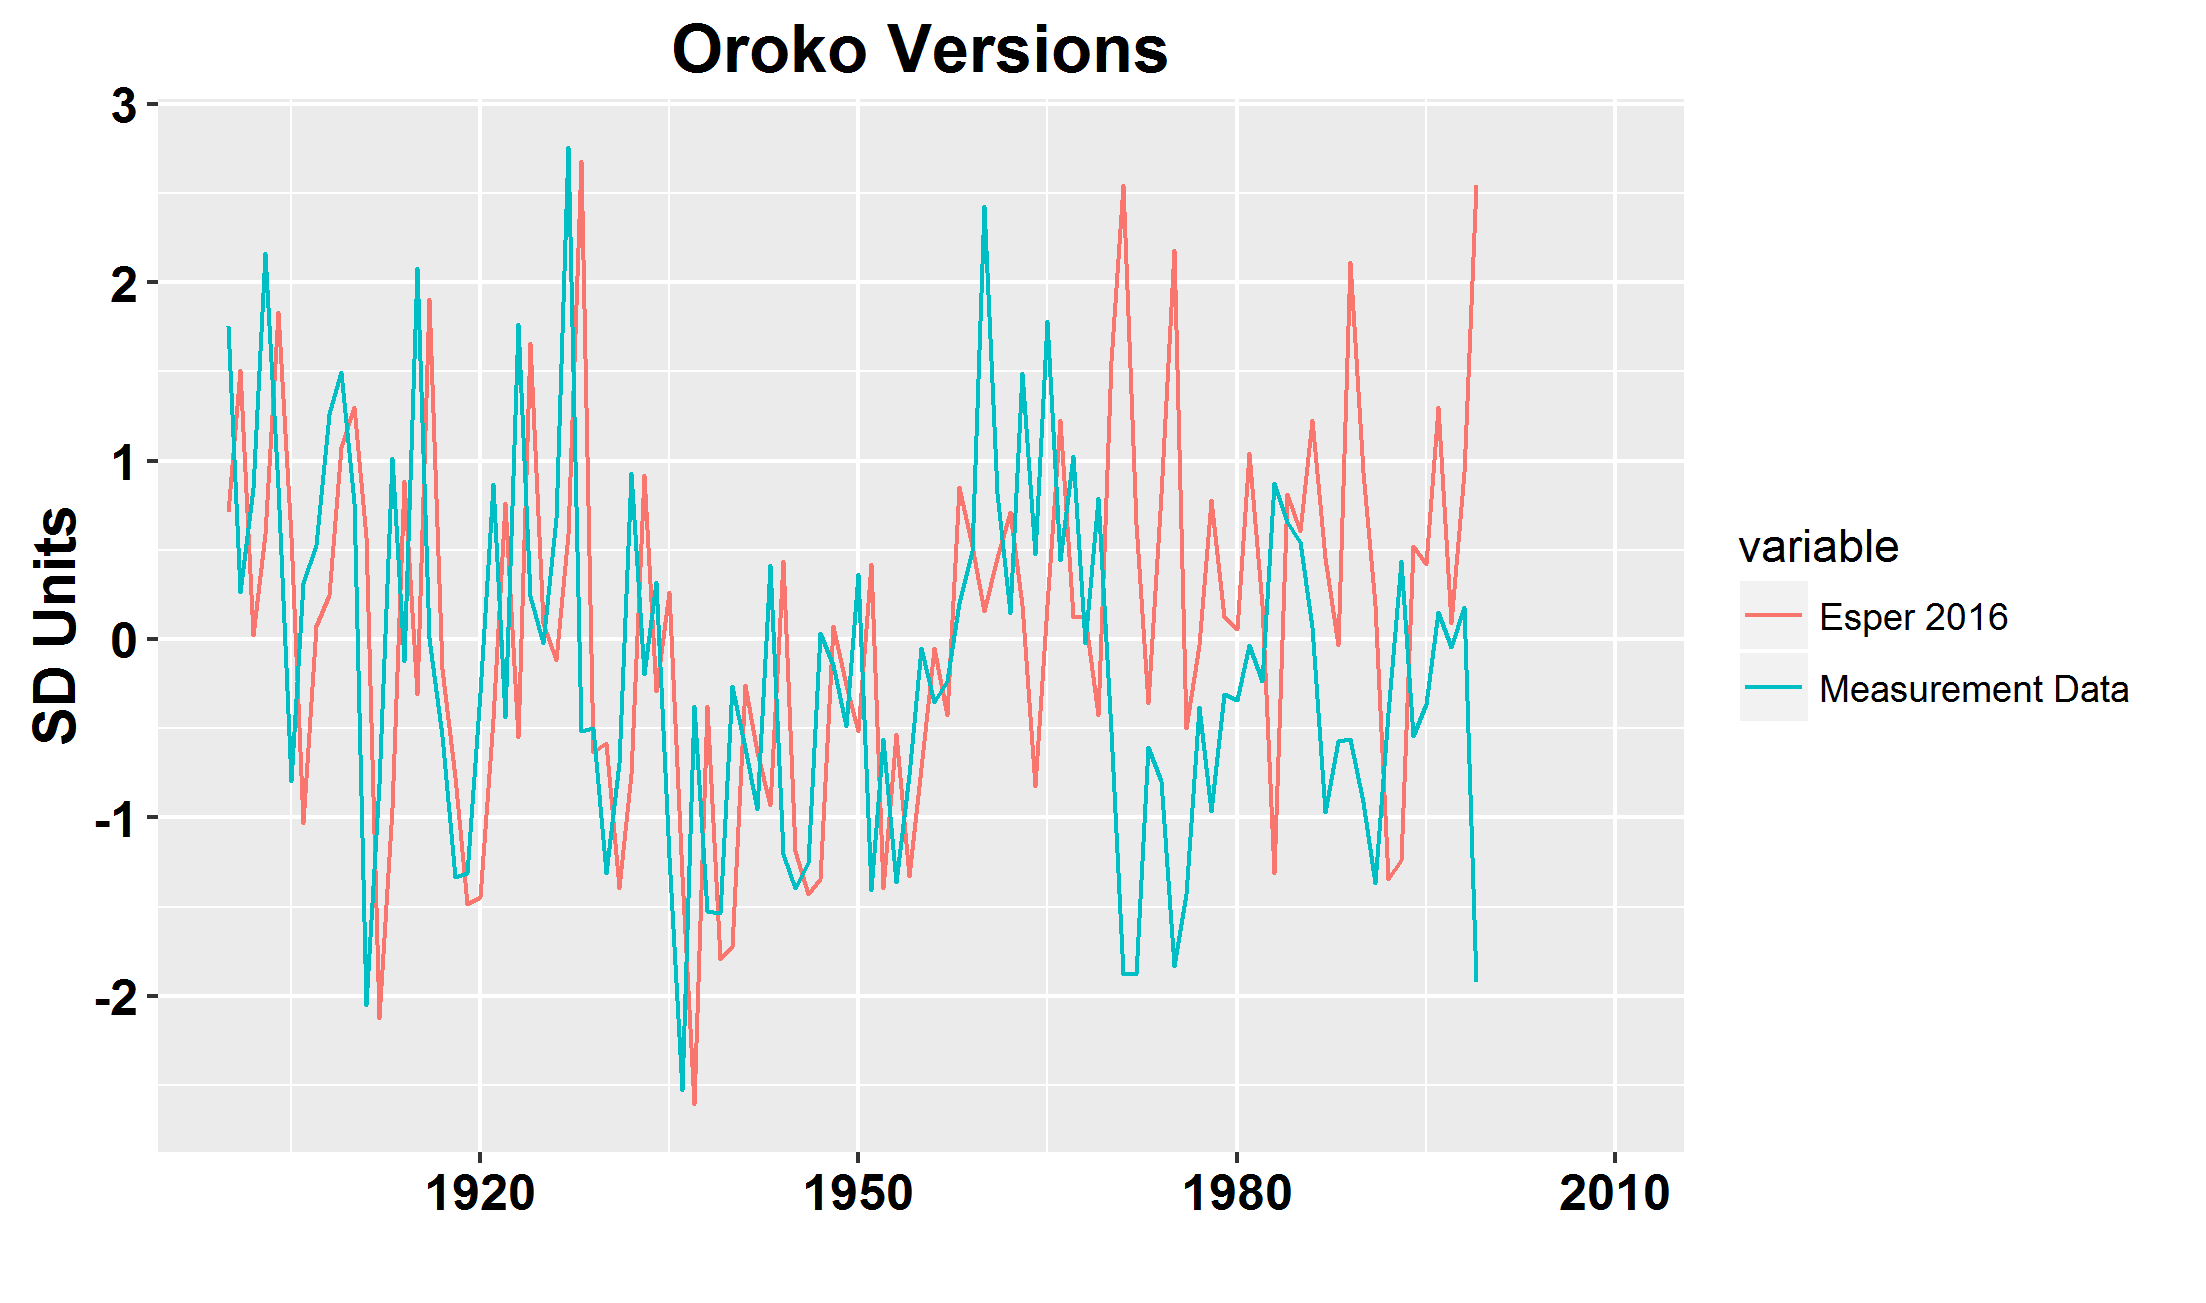 Figure 1. Comparison of Esper et al temperature reconstruction and chronology calculated from archived measurement data, both scaled.
Obviously the incident is reminiscent of “Mike’s Nature trick” “to hide the decline”, though the details and nuance differ. These incidents cannot help but remind one of Mann’s vehement denial in 2004 that any researchers had ever engaged in such practices:
No researchers in this field have ever, to our knowledge, “grafted the thermometer record onto” any reconstruction. It is somewhat disappointing to find this specious claim (which we usually find originating from industry-funded climate disinformation websites) appearing in this forum.
Cook purported to justify the exclusion of post-1957 proxy data on the grounds that the “catastrophic loss of climate correlation” was due to disturbance, most likely due to logging:
This catastrophic loss of climate correlation in the surviving trees confirms that a stand-level disturbance occurred. It is likely that the cause is the known logging activity described earlier.
In the first article on the site, Cook noted that there was no actual “evidence of cut stumps” along the transect and posited other possible methods of disturbance, though later articles simply cited logging.
Although there was no evidence of cut stumps along the transect line, the cutting nearby would have opened up the forest and perhaps made it more susceptible to wind-throw. L. colensoi is also known to form root grafts between individuals, producing an interlinked network (Moar, 1955). Alternatively, the hydrology of the swamp may have been altered when drains associated with road construction and light rail access for milling were put into the area.
By the time of Esper et al 2016, the authors (including coauthor Cook) seem to have lost track of the earlier splice of instrumental and proxy data. One cannot help but think that the splice of temperature data into the reconstruction will give an inappropriate boost to the resulting correlation to instrumental data. It’s therefore odd that Oroko was one of the lower ranking temperature reconstructions in terms of correlation to instrumental temperature.
The “Most Recent” Reconstruction
In cases where there were multiple versions of a chronology, Esper et al said that they used the “most recently published” version:
In those instances where there are multiple versions of a reconstruction, we cite the (GPmost recently published account as it contains references to all previous work
However, this practice wasn’t followed for Oroko. Esper et al used an antique Oroko version which Cook had emailed to Briffa in 2005. They cited Cook et al 2002 (GPC), the earliest article on the site. A more recent version is used in numerous recent articles including PAGES2K (Gergis et al, 2012; PAGES2K 2013; Neukom et al 2014; Gergis et al 2016). These use of Oroko in these studies is complicated somewhat by quixotic and inconsistent lags in various versions (generally undocumented), but the same data underpins all versions.
The most recent version of the Oroko reconstruction (in Neukom et al 2014 etc) does not contain the splice of instrumental data. It goes down after 1960. The underlying measurement data used for the more recent versions of the chronology appears to be different (and presumably larger) than the data set archived with Esper et al 2016. For example, the recent chronology version contains three additional years past the most recent measurement (1999) in Esper’s Oroko archive.
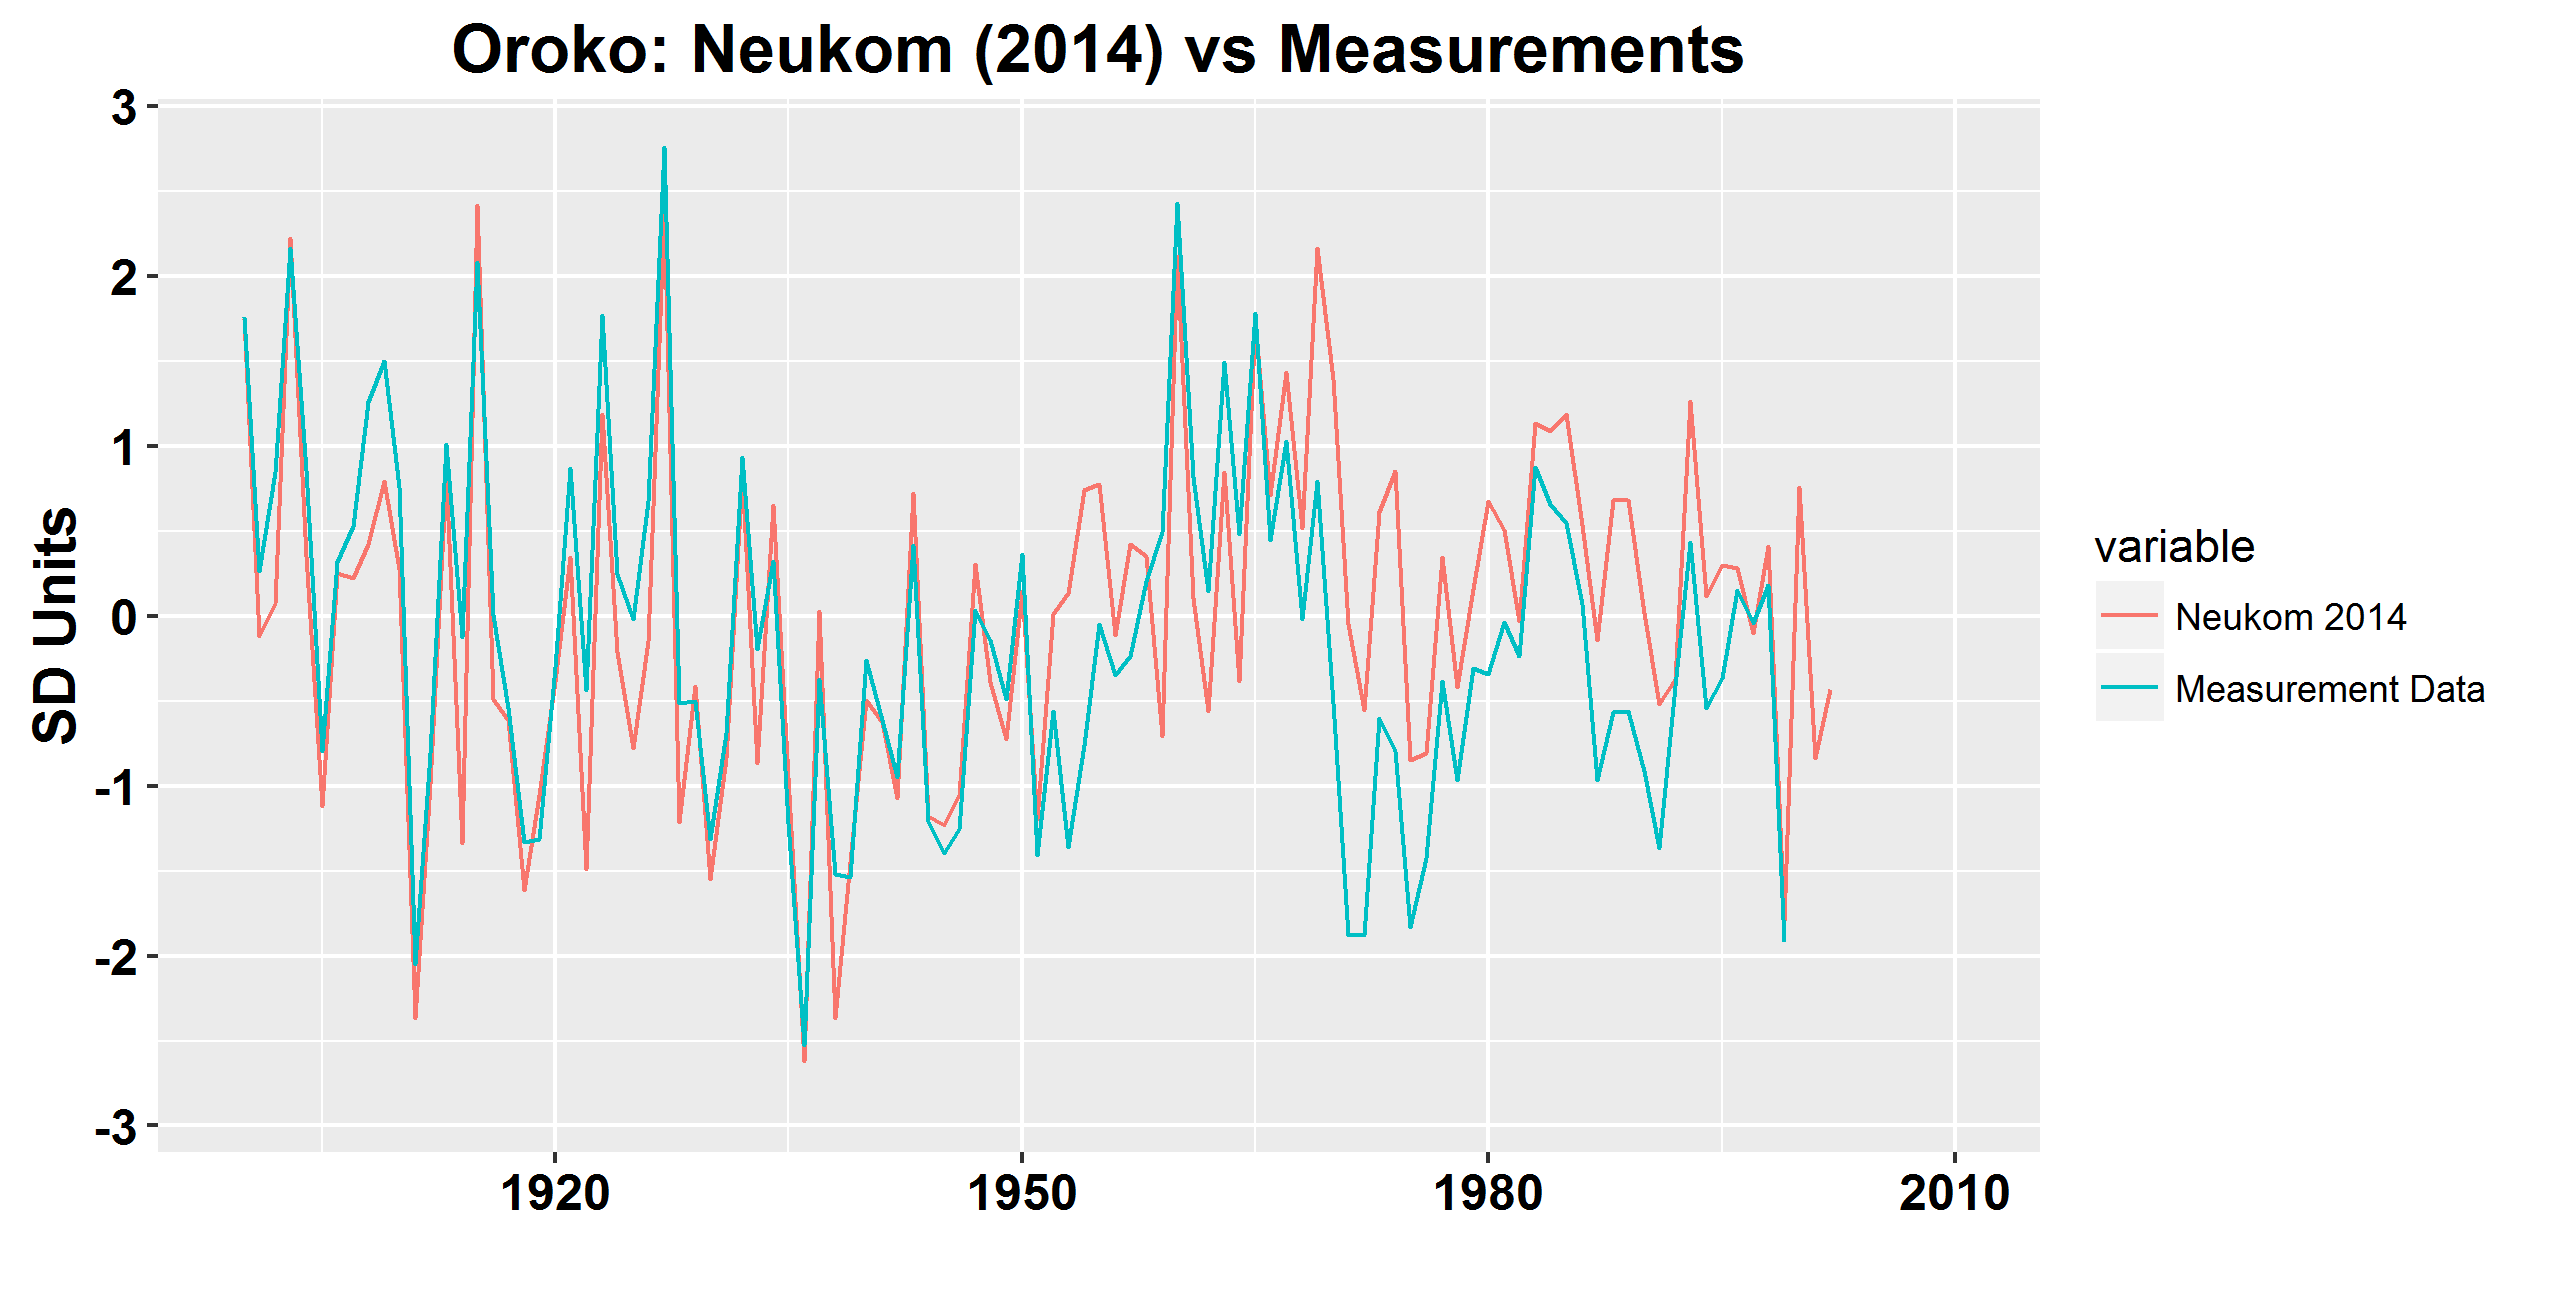
Figure 2: Oroko versions: comparison of Neukom et al 2014 unscreened to chronology calculated from measurement data in the Esper 2016 archive. The Neukom et al 2014 unscreened version is the most complete of the various recent versions.
The long Oroko chronology (in the unscreened Neukom 2014 data) is shown below. To my eye, its modern values are unexceptional over the past two millennia.
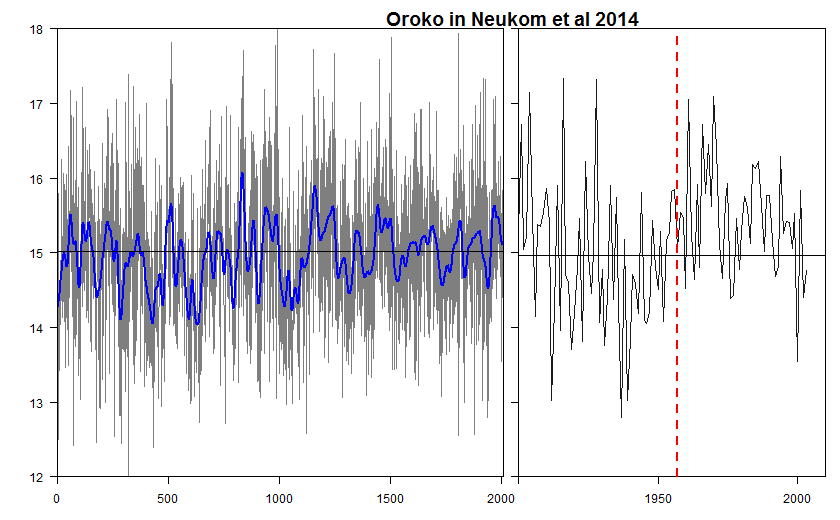
Figure 3. Oroko temperature reconstruction (from Neukom et al 2014 data)
Conclusion
Esper et al 2016 is an interesting article and the authors have made a reasonably diligent effort to ensure that the relevant data is available. I haven’t examined other datasets yet. Data issues tend to be idiosyncratic and the issues impacting Oroko are unlikely to impact other datasets. I’m glad to see that some Oroko measurement data has finally been archived – thirteen years after my original request – but it’s all too typical that, when finally archived, it appears to be a version that could have been made available in 2003. So despite Cook’s original sarcasm at the idea that he should be expected “to continually update the WDCP as the data are generated”, the data, when finally archived, appears not to incorporate data from the past decade. And worse, the reconstruction in which instrumental data was spliced with proxy data continued in use without warning labels, the authors of Esper et al 2016 seemingly unaware of or forgetful of the original splice.


45 Comments
Reblogged this on ClimateTheTruth.com.
“To my eye, its modern values are unexceptional over the past two millennia”
Oh I can see an exceptional long term pattern here alright, but it’s not restricted to the one graph and you have to look carefully at the bigger pitchers.
Reprehensible and inexcusable behavior – scientifically and in communications.
Just to add some detail for those interested in where these places are. The location for Oroko Swamp is near lake Wahapo in South Westland NZ.
A multi-millennial palaeoclimatic resource from Lagarostrobos colensoi tree-rings at Oroko Swamp, New Zealand. 43°14’S, 170°17’E
Lagarostrobos colensoi ( now known as Manoao colensoi) is a white silver pine, formerly classified alongside Lagarostrobos franklinii or Huon Pine from Tasmania, which is a slow growing but very long lived tree, with some living specimens which could be in excess of 2000 years old
I mentioned a few years ago in a prior review of Oroko (see here) that we had visited the windward coast of NZ about 2 degrees south of Oroko and it seemed implausible to me that such sites would be temperature proxies:
I suspect that Cook was “convinced” by the relationship because it went the “right” way.
…until it went the wrong way, hence an unsubstantiated story about logging and the grafting of instrumental records post-1957.
But see figure 3 above. The mystery is in how Cook, or anyone, perceived a temperature record in the data.
Memories coming back..I had thought the belief that non-treeline species could serve as temperature proxies was wholly a heresy only held by Australian Climate Science, Ltd. So now since 2014 some Europeans (Neukom, Esper – correct?) are tacitly approving this aberrant antipodean practice by inclusion of so-called proxies like “Oroko?”
This is old news, but here goes anyway: “They are definitely nowhere near altitude or latitude treelines.” Seeing the Oroko data back 2000 years, since Oroko is nowhere near altitude or latitude treelines, it is obvious (to me at least) that this tree-ring series was chosen (ex post, again obvious to me) because this series does not show a Medieval Warm Period. I can see no other basis for choosing this series for a tree-ring chronology. Who was it, again, who said, “We have to get rid of the Medieval Warm Period”?
“We have to get rid of the medieval warm period” Jonathan Overpeck.
When I plugged in the coordinates for Oroko Swamp (which I see were quoted in the Cook/Palmer/D’Arrigo 2002 paper), Google Maps directs me to a location due north of Okarito in the Tasman Sea. Sub-sea dendroclimatology?
-43.23, 170.28 ?
HAS: Your coordinates show the southern tip of what looks awfully like a swamp to me. The coords from the 2002 paper (-43.14S, 170.17E) do not. Where could the wrong coords have come from? Of really no importance but it makes one wonder.
The paper is quoting minutes, not decimals.
You and they are correct; I am wrong (not the first time in my life, either).
Peter Pond, by any chance did you do any consulting on the Hubble Space Telescope? 🙂
Confusion of minutes and decimal degrees are very common even in peer-reviewed papers in many disciplines. Never ever trust coordinates You haven’t verified yourself.
Confusion of East and West longitudes is also common, particularily near 0 and 180 lon.
Trying to view data on New Zealand’s famous Kauri tree dendrochronology I visited the website of the University of Auckland/ school of environment/ tree ring laboratory/ software and data page: Please contact the Lab Director for information on data availability. http://web.env.auckland.ac.nz/our_research/treeringlab/datasoftware.html
Way to go for a publicly funded University that got over a third of its nation’s research money.
So they will have kauri tree records from the north island swamps going back centuries and a different tree records from a south island swamp overlapping the later period. That would make an interesting comparison.
This post mentions Yamal in passing, which jogged my memory.
The leaked e-mails show that the Russian researcher who collected the tree-ring data observed that the trees line had not moved north as would be expected if climate warming had occurred. I attach an excerpt from the leaked e-mail (document 907975032.txt):
From: Rashit Hantemirov
To: Keith Briffa
Subject: Short report on progress in Yamal work
Date: Fri, 9 Oct 1998 19:17:12 +0500
Dear Keith,
I apologize for delay with reply. Below is short information about state of Yamal work. Samples from 2,172 subfossil larches (appr. 95% of all samples), spruces (5%) and birches (solitary finding) have been collected within a region centered on about 67030’N, 70000’E at the southern part of Yamal Peninsula. All of them have been measured.
[SNIP except for the last sentence]
There are no evidences of moving polar timberline to the north during last century.
Rashit Hantemirov, Lab. of Dendrochronology, Institute of Plant and Animal Ecology,
8 Marta St., 202 Ekaterinburg, 620144, Russia.
https://climateaudit.org/2011/04/09/yamal-and-hide-the-decline/ Scroll down to the map. Look for the red and gray dots.
Reblogged this on The Ratliff Notepad.
Steve:
This behavior…bleating and complaining about having to
“to continually update the WDCP as the data are generated”
is outrageous.
Of course he has an obligation to do this.
His employers, and the institutions that fund his research have an obligation to make sure his checks clear the bank, no?
And anyway, how hard is it to attach the file to an email, and send it to the people who fund one’s research?
I have no idea of how you manage to remain calm in the face of this kind of stuff.
Calm but determined. They hate that the most.
“One cannot help but think that the splice of temperature data into the reconstruction will give an inappropriate boost to the resulting correlation to instrumental data.”
Pardon me while I injure myself by laughing so hard.
How can a climate scientist consider something a reconstruction through 2000ish if the proxy data itself is cut-off after 1957?
If logging or whatever caused a problem that ruined the proxy for half of the record, you either justify using it and cutting it off at the time it becomes ruined, or you throw it out entirely.
Confused about the “disturbance”. I would think that if a forest was thinned out the remaining trees would grow at an increased rate due to lack of competition for water, sun and nutrients. If the authors believe the disturbance is too much, then simply stop the reconstruction at 1958. Steve, you are correct, Oroko swamp is at the exalted elevation of about 110 m asl, and that coast is one of the rainiest places on earth.
Great job in finally getting them to release some of the data.
“In the first article on the site, Cook noted that there was no actual “evidence of cut stumps” along the transect and posited other possible methods of disturbance, though later articles simply cited logging.”
Was there any actual evidence of logging or did someone suggest logging as a possible cause for deviation and subsequent articles presumed logging to be a fact?
The satellite view shows what appears to be the results of logging to the west and south of the swamp, but it is hard to identify if the areas logged drain into or would otherwise affect the weather around the swamp.
The swamp part of Oroko Swamp lies about 1.6km north of the NE corner of Lake Wahapo, and is around 1.6km NS by 800m EW. The area has significant conservation values and was incorporated into Westland TaiPoutini National Park in 2010.
There is clear evidence of logging apparent in Google Earth imagery to the immediate west and south of Oroko Swamp where you can see radial patterns around 350m radius surrounding draw points. The ‘disturbance’ inside these logged zones is extreme. That logging enroaches to within ~100m of the SE corner of the swamp, and about 700m from the western side. To my eye, that logging looks much younger than 1957. But there are also faint traces of tracks on the immediate west side of the swamp and the low lying area to the east, and it is a strong possibility that there was an earlier phase of ‘selective’ logging (in the true sense of selecting premium trees – as opposed to the later practice of selecting an area and bowling it).
As commenter RobR mentioned in the 2014 thread, the history will be documented at the Department of Conservation (previously Foresty), but won’t be found with a keyboard search. And there are plenty of locals and forestry professionals still around who would know the history. It is not an unreasonable assumption that Cook would have made enquiries when he was doing his work there – so I wouldn’t jump to the conclusion that it is an unsupported assertion.
Although it is entirely reasonable to question whether the proxy should be continued after 1957 if the ‘disturbance’ was that profound.
It would be very helpful to know the exact location of the transect/sample sites.
Cook is an experienced and diligent field scientist and his express observations on field circumstances are entitled to deference. He comes from the dendro tradition of poor statistical analyses, but I can’t imagine him withholding adverse r2 results. He seems ornery, somewhat in the manner of his mentor Jacoby, rather than poisonous, like some others.
The give away is that the explanation for the divergence wasnt offered before the divergence was discovered.
Any relevant changes in the local environment should have been noted before the analysis was conducted.
One can always find a rationale for the divergence after it is discovered.
There are so many factors that affect plant growth rates, that the temptation to pull one out of one’s hat in order to justify a decision to either include or exclude a data set is just too great.
Thats why this kind of stuff has to be observed, and noted BEFORE one conducts the analysis.
Logging.
Riiiight.
David, along with it not being on the tree line, are you suggesting that the occurrence of logging in the vicinity also wasn’t noted in the due-diligence report on the site’s selection? 🙂
There was such a report, wasn’t there?
I fully agree with you.
A forester should be able to explain what effect logging has on growth rates of a forest, if any. My bet is that he will explain how selective removal of mature timber in fact increases (not decreases) the growth rate of the remaining timber. He will probably explain how thinning of the stand enhances the growth of remaining timber by reducing the competition for available space, nutrients, etc.
Cook might find it beneficial to his science were he to consult specialists in other fields and provide references.
“…with instrumental data (which went up) – in a contemporary variation of what is popularly known as “Mike’s Nature trick”, though Mike’s Nature trick, as discussed at CA HERE, was a little different.”
Is the link missing under the word “HERE”?
Maybe, or it could be a redundancy- here meaning this website.
The comment about forgetfulness on how a series is created is an interesting one. As science is built on layers of understanding it must accept past work in order to progress forward. The inability for scientists, even like Rob Wilson whom seems somewhat objective on the matter, to critically and objectively analyze the effects their math has on the series they process is a huge problem. It means that the naturally self correcting nature of a hard science simply doesn’t exist in the paleo-climate field. Papers which splice instrumental data in these dozens of different manners, need to be systematically recognized and removed from publication.
The big problem is that this is how these people are paid though and if the math were corrected, and the data processing were corrected, there would be very few high warming results to report. Rob Wilsons insistence that the data is good, were he able to prove that, would result in an entirely different conclusion about current temperatures being unprecedented.
Of course the alternative is that the tree data isn’t a good temperature proxy and I certainly haven’t read any papers which prove it is good, which should be a pretty easy feat if the data were good…..
Layers of problems ‘forgotten’ and accepted as fact certainly won’t cancel each other and turn into good work.
Just seems like there is no reason for this. Why not just say that?
‘Here are some tree rings that have surprising agreement with local temperature from 18xx – 1957. After that, they don’t agree at all. We think it might be because of logging in the area. OF course, any number of things may have affected the correlation BEFORE 18xx when we don’t have instrumental temperatures to check it against, but with that in mind here’s what the temperature WOULD have looked like if everything else had stayed the same.” That would be good science.
‘The divergence between temperature “reconstruction” and chronology arose because Cook spliced instrumental data after 1958 into his reconstruction.’ What does that even mean? I can’t hardly believe that a serious scientist would just replace his data. I’m assuming that the fact wasn’t hidden, but still… It just makes no sense.
(BTW, is there a well-known temperature data set that was used here?)
ATTP, if you’re listening, what do you think of Michael Mann’s tone? What about Dr. Cook’s specious evasiveness? Leave aside the tone: One sees clearly from Mann’s actual _words_ that his group decided to behave like soldiers in a war rather than scientists, closing ranks against the enemy. They had barely heard of McIntyre, and still decided that stonewalling him was more important than science, more important than truth.
Isn’t there a point (one I reached some years ago) where one has to say that the paleo community are not the victims here? Instead of policing Steve McIntyre’s tone, maybe it’s time and past time to do something about the bad actors who have ruined this field’s reputation. As I’ve said many times, this should be especially true for anyone who cares about AGW. This single email should be enough for anyone who cares about science to denounce Mann.
Scientists receive, and generally deserve, a level of trust from the public. Politicians don’t; no one trusts a word they say. Mann and his cohorts have managed to convince many of us that climate scientists are politicians.
One has to hand it to Supermann that he knew at once this guy from Toronto was kryptonite.
If graphs like your Oroko Versions top graph were complete with error envelopes, it would plausibly show that different techniques were used for different portions. That is among the uses for error envelopes.
However, they seem regarded by some as an optional, last minute add-on to satisfy the ‘rules’ rather than a proper, in-depth device with meaning. (I won’t harp on this on CA any more.)
Geoff.
Interesting:
Funny how data derived from trees is somehow more private than data derived from living human beings.
Oh, and maybe we should try a petition some time?
re the Mann email – I had a look at what ‘SHILL’ means from Wiki, first part states –
“A shill, also called a plant or a stooge, is a person who publicly helps or gives credibility to a person or organization without disclosing that they have a close relationship with the person or organization. Shills can carry out their operations in the areas of media, journalism, marketing or other business areas. A shill may also act to discredit opponents or critics of the person or organization in which they have a vested interest through character assassination or other means.”
makes me wonder who the real Shill is here ?
I had thought it came from “taking the Kings/Queens Shilling” – accepting money for your services, but you live & learn 🙂
I had some time to look over the material from Abram et al. that Nic Lewis provided on this thread and to better understand the Sizer plots that were used extensively in this paper. I have not had access to the paper but I judge that my analysis that I will show in this post will not hinge on that reading.
I was rather surprised by the showing in the SiZer plots of the repetitiousness of positive trends emanating from the 1800s to near present time in numerous plots in the Abram paper. I was not surprised that the Northern Hemisphere (NH) plots would show similar plots in temperature reconstructions since I suspect the reconstructions would have used much the same proxies. I also have no confidence in these reconstructions actually showing good estimates of past temperatures due mainly to the lack of validation of these proxies as reasonably good or consistent thermometers and the use of post facto selection of proxies. My point here is not to show a problem with the NH reconstructions but rather to look at the results of what I’ll call a sensitivity test of the Abram use of SiZer plots.
Recall that the SiZer plot is produced by first smoothing the temperature series with a choice of several smoothing kernel types and smoothing at various frequencies by changing the window length, h, used in a locally weighted polynomial. In Abram the graphs show the SiZer plots using h from 15 to 50 years. The first derivative of the smoothed series is used to show significantly decreasing or increasing trends. In Abram a 90% confidence interval was used. The graphs are color coded to show a significantly increasing trend in red , a significantly decreasing one in blue, not significantly increasing or decreasing in purple and lack of sufficient data to determine significance in grey. The value of h used is shown in the SiZer plots on the y-axis and the time on the x-axis. The time intervals at which the first derivative is tested for significance provide vertical bands in the graph while the h values prove horizontal bands. The discrete bands are not seen in the Abram plots since the values of h used are continuous from 15 to 50 and the time intervals are for each year. I did the same for the SiZer plots shown here in my analysis.
I used adjustments to the R code for SiZer in attempting to emulate the Abram plots by changing the parameters available for the function. I suspect that the kernel type used in Abram was normal. That kernel does more smoothing than the choices of biweight, triweight and Epanechnikov. In my analysis shown here I used the normal version. I could come close to showing in general what Abram claimed for trends but did not replicate exactly the individual plots.
In my sensitivity testing I wanted to look at the results of a SiZer plot and the underlying smoothing series graphs using various ranges and specific values of h when the other parameters used were those that I suspected Abram used. The results are shown in the linked/shown graphs below. I used eight NA reconstruction series of which some were the same as used by Abram. For each of the eight series I calculated and graphed the locally weighted polynomial smooth of the series using h values of 50, 30, 10 and 5. I than plotted three SiZer plots for each series using three ranges of h incremented by 1 and consisting of 15 to 50, 38 to 50 and 3 to 15.
It is obvious from these plots that looking at the lower frequency part of these series that the reconstructions look much alike and that a positive trend tends to run from the 1800s to near current time as claimed in Abram. When the frequency emphasis is changed to higher frequencies a different picture is seen. In that case differences in individual reconstructions emerge and the long term trend from the 1800s to present time is either no longer seen or is much less obvious.
Since there are no rules that can be derived for the best way of presenting, vis a vis the smoother used, these plots, the implications of the plots must be considered. A long smooth positive trend run up from the 1800s to current time as claimed in Abram could, without the unconvincing evidence provided by Abram of early onset GHG effects and by itself, indicate a long natural trend that would greatly diminish the amount of modern warming due to GHGs. I do not think that argument would hold sway with the consensus or skeptic point of view on these matters. It could, however, explain why Abram went to the lengths it did to show early onset GHG effects once the authors wanted to show the low frequency plots.
My question in these matters is that suspecting the modern warming period coincides mainly with the rapid rise of GHGs in the atmosphere in the 1970s, why would plots using in the 50 year range of smooths be used. After all the mid 1970s to current time is only a bit more than 40 years. If the higher frequency smooths are closely observed in these eight reconstructions, a meandering series with little long term trending is seen up to around 1910 or so and then a sharp jump up to around 1950 and from there a leveling off to a somewhat meandering structure again. Again here I must point out that I have no confidence in the reconstructions reasonably reproducing past temperatures and the higher frequency analysis here is evidence of that – as is the low frequency analysis without contorting the GHG early onset forcing. My point is that entirely different pictures are painted when using low and high frequency trend analysis.
One Trackback
[…] https://climateaudit.org/2016/08/13/esper-et-al-2016-and-the-oroko-swamp/#more-22587 […]