 In 2011, Andy Revkin wrote an article (archive) entitled “Straight Talk on Rising Seas in a Warming World” (among other articles on the topic), in which he optimistically sought guidance on the topic from a then recent study of U.S. East Coast sea level coauthored by Mann (Kemp et al, 2011). Joshua Willis told Revkin “that, using patterns in layered salt marsh sediment, [they] found a sharp recent uptick in the rate of sea-level rise after 2,000 years of fairly stable conditions —
  a pattern Willis refers to as a “sea-level hockey stick” — an allusion to the suite of studies finding a similar pattern for global surface temperatures (albeit a hockey stick with a warped shaft)”.
However, as so often, the supposed “hockey stick” appeared only after the data had been severely adjusted. The difference is shown at the figure at right. Unadjusted (raw) relative sea level (i.e. how sea level appears locally – the concern of state planners and policy-makers) in North Carolina increased steadily through the last two millennia, with somewhat of an upward inflection in the 19th century; it is only after heavy adjustment that a HS shape appears.
In this case, the relevant data for local and regional planners is the data prior to adjustment by climate warriors, as I’ll discuss below: this is not a hockey stick but an ongoing increase through the Holocene.
Relative Sea Level and Glacio-Isostatic Adjustments
Kemp et al’s adjustment subtracted estimated glacio-isostatic adjustment (GIA) to arrive at “sea-level change after correction for glacial isostatic 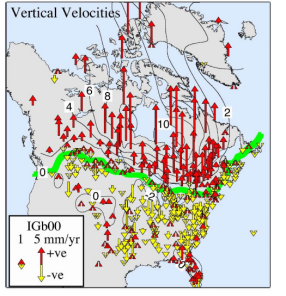 adjustment“. This is not a figure that is of any real relevance to policy and unfortunately serves only to mislead earnest observers (like Revkin) seeking guidance from a distressingly ideological community.
Glacio-isostatic adjustment is a very important topic in Antarctic studies, since (as discussed at CA here), the estimate of Antarctic ice mass loss is approximately equal to the (poorly-constrained) Antarctic glacio-isostatic adjustment. IPCC AR5 promoted very extreme Antarctic ice mass loss estimates through their adoption of GIA estimates that were already discredited in the specialist community (see CA here).
Isostatic adjustment is a lingering effect of disappearance of continental ice sheets more than 10000 years ago. The direction of the effect is opposite in Canada versus the US. In Canada, land is rising relative to the ocean as the land rebounds upward due to the removal of the massive LGM ice sheet. In the U.S., most land, including all of the Eastern Coast except for Florida, is moving downwards relative to the ocean, to compensate isostatically for upward movement of land in Canada. The contour line showing the break between the two zones follows the Canada-US border to an astonishing approximation. Around Hudson Bay, uplift is approximately 10 mm/year, while relative subsidence on the mid-Atlantic coast is estimated at about 1.1 mm/year.
Paleoclimate Evidence of Relative Sea Level Rise on US East Coast
There is overwhelming paleoclimate evidence of relative sea level rise through the Holocene along the US East Coast, reported in numerous specialist articles, a few of which will be discussed below. I haven’t attempted to survey literature on the topic; I presume that there are many other references. However, the story is consistent in the references below.
Long Island, New York
In 1975, Sanders and Kumar (pdf) identified analogues to present-day barrier islands in shallow cores offshore Long Island. ‘They (plausibly) interpreted these paleo-barrier islands as evidence of former sea levels. They estimated relative sea level in the early Holocene (~9000 BP) to be ~24 meters lower. In addition to sea level rise, higher sea levels through the Holocene caused encroachment of the Atlantic Ocean onto the continental shelf: they estimated that the ocean had advanced by ~7 km (nearly 100 m/century) during the sea level rise:
when the sea level stood at -24 m [9000 BP], a chain of barrier islands, very similar in height and size to the modern barriers south of Long Island, existed approximately 7 km offshore. These barriers were approximately 8 to 10 m high.
Miller et al 2009 (New Jersey)
In 2009, Miller et al (2009) estimated relative sea level rise since 10000BP as ~18 m, as shown in the figure at right. In the last half of the Holocene (since 5000 BP), they estimated 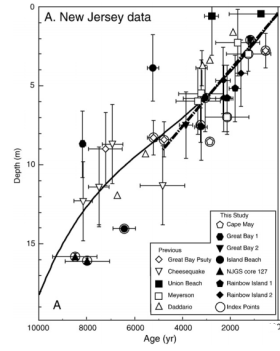 relative sea level rise of 9 meters (~1.8 mm/yr). They said that this was a substantial increase from then current New Jersey estimates of only 0.5 mm/yr rise since 2000 yrBP. Their estimate was obtained from offshore drowned salt marshes.
Miller et al (2009) allocated over 60% of the observed relative sea level rise (1.1 mm/year) since ~5000 BP to geoidal subsidence, with the balance (~0.7 mm/year) attributed to eustatic sea level rise. Citing Lambeck 2002, they speculatively attributed late Holocene sea level rise to ongoing erosion of the West Antarctic Ice Sheet (a topic of very great interest separately):
Lambeck (2002) suggested that west Antarctic ice sheet melting was the major contributor to mid–late Holocene rise.
Miller et al reported that their results were indistinguishable from other recent estimates from contiguous regions (Delaware, southern New England):
Ramsey and Baxter (1996) evaluated dates from nearby Delaware sites and provided a preferred relative sea-level curve that is indistinguishable from ours, with a mean rate of 1.7 mm/yr. A compilation of data from Southern New England (Donnelly et al., 2005) is also virtually indistinguishable from the New Jersey and Delaware records with a mean rate of 1.9 mm/yr. We conclude that from 5000 to ~500 yrBP relative sea level rose ~1.7-1.9 mm/yr for the region from Delaware to southern New England. This is about 1 mm/yr slower than regional rates of rise since 1900 AD (Fig. 1). Rates in Delaware and Southern New England were faster from 8000-5000 yrBP, though the rates in New Jersey are not well constrained for this interval.
Kemp et al 2011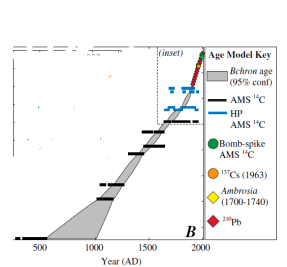
Kemp et al 2011 thus arrived in a milieu where long-term relative sea level rise along the US East Coast was well known. They reported on two rather short North Carolina cores (Tump Point and Sand Point), which were dated to the past two millennia, and did not discuss the longer Holocene context. They observed that both cores showed a consistent increase in relative sea level of about 1.2 mm/year over the past two millennia, somewhat less than than the corresponding rate in New Jersey (which has higher GIA).
From these amounts, Kemp et al deducted 0.9-1.0 mm/yr for subsidence to obtain the “climate-related rate of sea level rise”:
To extract climate-related rates of sea-level rise (Fig. 2C), we applied corrections for crustal movements associated with spatially variable and ongoing glacial isostatic adjustment (GIA). A constant rate of subsidence (with no error) was subtracted from the Sand Point (1.0 mm/y) and Tump Point (0.9 mm/y) records.

This resulted in the “sea level hockey stick” (SKS version shown at right), which was characterized by Revkin as follows:
“Among other things, he [Josh Willis] speaks about the recent study [Kemp et al. 2011] that, using patterns in layered salt marsh sediment, found a sharp recent uptick in the rate of sea-level rise after 2,000 years of fairly stable conditions — a pattern Willis refers to as a “sea-level hockey stick” — an allusion to the suite of studies finding a similar pattern for global surface temperatures (albeit a hockey stick with a warped shaft).”
But, for an observer in North Carolina concerned about ocean encroachment, the relevant figure is the history of relative sea level, which has been consistently increasing over the entire Holocene, not the Mannian hockey stick.
North Carolina relative sea level rise previously discussed at CA here.
Kemp et al 2013 (New Jersey)
Two years later, Kemp et al 2013 reported on two cores from New Jersey, which, collectively (see their Figure 7b below) showed relative sea level increase of ~1.6 mm/yr (4 meters over 2500 years), slightly less than Miller et al’s average Holocene RSL increase of 1.8 mm/yr, with, once again, an inflection upwards starting in the 19th century.
This time, they allocated all of the relative sea level rise in New Jersey since 4000BP to glacio-isostatic adjustment (GIA) and other land changes (compaction), i.e.that there had been no eustatic sea level rise since 4000 BP
Eustatic input ceases at 4000 yrs BP in this model, since then all RSL changes (1.1 mm/yr) are attributed to GIA and associated processes such as redistribution of water in response to changes in the geoid.
Projections in a Holocene Context
To place recent projections of relative sea level rise e.g. Rutgers projections 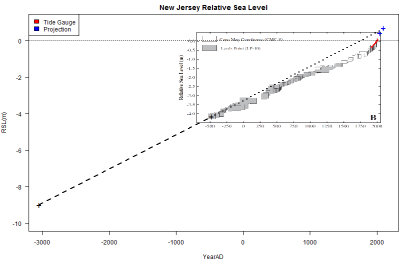 of ~42.5 cm (1.4 ft) by 2050 and 76-103 cm (2.3-3.4 ft) by 2100 (both from 2000 levels) in New Jersey (blue + signs), I’ve superimposed Miller’s estimated 1.8 mm/year Holocene increase (dashed line) to 2100AD on Kemp et al. The increase measured by tide gauges in the 20th century (the short red squiggle) is merely an episode in a a continuing sea level increase over thousands of years. While the increase in the 20th century and projected increase in the 21st century are more rapid than the long-term average, even average late Holocene encroachment of the ocean onto the land along the mid-Atlantic coast would be relevant to development along the coast. As an editorial comment, it seems plausible to me that the Little Ice Age in the second half of the 2nd millennium could easily have contributed to a relative slowdown in eustatic sea level rise.
Discussion
Although Revkin was clearly hoping for and expecting “Straight Talk” about sea level rise from Joshua Willis, he got anything but. Willis’ message was about as counterproductive to the science requirements of an earnest planner as one could imagine. The base case for a planner is that relative sea level rise along the US East Coast has been going on for thousands of years. Rather than East Coast relative sea level rise being represented by a “sea level hockey stick”, it has been an ongoing increase for thousands of years. Yes, there has been a recent inflection in relative sea level rise, but the planners have to deal with relative sea level regardless of the inflection. The ocean has been encroaching on the land in the U.S. mid-Atlantic for the past 10,000 years and will continue to do so for the next 5,000 years.
I noted above that Lambeck (2002) had suggested that West Antarctic ice sheet melting was the major contributor to mid–late Holocene eustatic sea level rise. The future of the West Antarctic ice sheet has been the subject of many recent alarmist screeds, none of which have fully discussed and analysed its past. In a future post, I’ll discuss West Antarctic Ice Sheet retreat in more detail. As a lead, it is my understanding that the West Antarctic Ice Sheet has been retreating for the past 20,000 years and will continue to retreat for the next 5000 years. Sea level rise seems to me to be intrinsically connected to being in the Holocene interglacial and the only thing that seems likely to stop continuing sea level rise is a reversion to Ice Age conditions – a cure obviously worse than the disease. As a matter of historical contingency, our civilization developed settlements along the ocean at a time when the West Antarctic Ice Sheet was only part way through its retreat and we might as well recognize that.
On balance, our civilization effortlessly accommodated sea level rise in the 19th and 20th centuries. However, barrier islands off the US East Coast have been gradually submerged. Present-day barrier islands will also be gradually submerged in their turn, regardless of the Paris Treaty. Attempts by climate scientists to portray this as a hockey stick issue with an easy control knob are false science.


111 Comments
Missing link at end of 5th para “(see CA here)”
Here is the CA post on Zally(2015) Antarctic study with GRACE data showing the growing eastern region mass dominating the loss in the western. https://climateaudit.org/2015/12/02/antarctic-ice-mass-controversies/
Here is hi-res of the vertical GIA velocities map. (Florida looks luckier than thought.)
Sella(2007) is the paper the map came from.
Two missing links in the paragraph below.
“Glacio-isostatic adjustment is a very important topic in Antarctic studies, since (as discussed at CA here), the estimate of Antarctic ice mass loss is approximately equal to the (poorly-constrained) Antarctic glacio-isostatic adjustment. IPCC AR5 promoted very extreme Antarctic ice mass loss estimates through their adoption of GIA estimates that were already discredited in the specialist community (see CA here).”
“The ocean has been encroaching on the land in the U.S. mid-Atlantic for the past 10,000 years and will continue to do so for the next 5,000 years.”
“Javier” has a different view, but the difference between 1,500 and 5,000 years won’t matter to us.
“5) Since the precession cycle has bottomed and the obliquity cycle is half way down we should expect the next glacial inception to take place within the next two millennia.”
I think that there’s convincing evidence that climate has gotten colder over the past 10000 years with the 19th century being the coldest since the LGM (incipient neoglaciation in Baffin Island and Iceland.) From that perspective – with incipient return to ice age, it would be wise policy to do whatever we could to avert a return to deep glaciation and adding CO2 to the atmosphere would have been wise policy.
The earth is gradually warming; it’s been gradually warming for more than 150 years, and it’s not likely to stop warming anytime soon — maybe somewhat faster, maybe somewhat slower, whatever happens.
And so the current period of the earth’s temperature history that some choose to label as the Adjustocene will continue indefinitely into the future, unless and until Mother Nature in her infinite wisdom decides to reverse course and bring the current period of warming to an end.
It is easy to predict that the debate over climate change and the long-term impacts of our carbon emissions will continue indefinitely into the future as well, until and unless a prolonged period of statistically significant cooling occurs which lasts thirty to fifty years or more.
From a public policy perspective, in a world where technology is making population numbers increasingly irrelevant for promoting sustained economic growth, keeping millions of creative people busy responding to real and supposed dangers to our human existence here on earth can become an exceptionally useful manpower sink.
Reducing the world’s carbon emissions faster than the natural progression of science, technology, and supply-demand economics can achieve is strictly a matter of public policy decision making. Likewise is a decision to force an early adaptation to the predicted effects of climate change, whether the predicted change is temperature up or temperature down.
In any case, if — for whatever reasons — we choose the ‘climate is warming’ option as the basis for our public policy decisions, then forcing an early end to our reliance on fossils fuels cannot be achieved without putting a stiff price on carbon, one that is high enough to greatly accelerate our inevitable departure from a fossil energy economy.
You cannot look at the latest 150 years of temp data that is high resolution and compare it to Holocene temps directly. A 150 year blip is unlikely to even show up on Holocene restorations at all. If you can look at Holocene temp curves and say the overall direction of temperature is increasing, you must be looking at very unique data. Temperature will be going WAY down at some point, period, and a few ppm CO2 is not going to do squat.
dayhay: “You cannot look at the latest 150 years of temp data that is high resolution and compare it to Holocene temps directly. A 150 year blip is unlikely to even show up on Holocene restorations at all. If you can look at Holocene temp curves and say the overall direction of temperature is increasing, you must be looking at very unique data. Temperature will be going WAY down at some point, period, and a few ppm CO2 is not going to do squat.”
When in doubt, predict that current trends will continue. It’s an approach which makes the prediction of short-term future trends a simple process, and it’s good enough for government work.
It’s my opinion that the earth’s GMT, as measured by today’s climate data tracking systems, will continue to rise at about the same rate as it has been rising for the last 150 years or so. Maybe it will be rising somewhat faster, maybe somewhat slower, the actual rate depending upon which decadal trend pattern is currently operative at any given point in time.
In other words, whatever it is that happens to happen is what will happen.
I’ve seen no convincing arguments that the relatively gradual warming we’ve been experiencing for the last 150 years or so will come to an abrupt end; that it will do so well before the end of this century; and that a statistically significant and long-lasting cooling trend as measured by today’s climate data tracking systems will suddenly emerge.
This doesn’t mean that Mother Nature, in her sometimes fickle behavior, won’t decide to break form and suddenly throw us a curve ball. Anything can happen. But will it?
In any case, the prediction of future catastrophic global warming is an indispensable tool for pushing a variety of public policy agendas, especially ones that have the characteristic of spawning unholy alliances among strange bedfellows; for example, the powerful alliance that’s now emerging among the renewable energy and natural gas industries.
The public policy debate concerning the validity of today’s mainstream climate science has not, and will not, reach a critical mass until and unless significant economic and personal lifestyle sacrifices are being demanded of the voting public by federal, state, and local governments.
Dayhey, if your argument that the most recent trends in GMT are mostly irrelevant to the long term climate picture, and that the long term Holocene trend is what will dominate — even in the near term — then the surest way for that argument to be given a fair hearing is for the US Congress to propose a stiff, revenue positive tax on all carbon fuels.
If the US Congress ever actually does that, if they ask the public to make real sacrifice in the name of fighting climate change, you’ll quickly be given an appropriate public forum for making your Holocene Trend scientific arguments, with about as much time and attention allotted for your presentations as the Anthropocene / mainstream climate science people will have.
The problem with short-term trends is drawing long-term inferences from them. There is adequate geological information to suggest that the single greatest biological threat from “climate change” is inadequate, rather than excess, atmospheric CO2. That suggestion has short-term, intermediate, AND long-term support. The short-term support is the increased vegetation along desert margins observed with satellite-imagery.
Intermediate support may be seen in the increased dust found in Antarctic ice cores correlating to the coldest spells of the late Pleistocene, the extremely low levels of atmospheric CO2 tracked in ice cores, and the inverse relationship between temperature and ice accumulation during the Pleistocene. The sum of these suggests that rather than the dust being the result of planetary scattering of wind-born loess, that the depths of the glacials witnessed drier, dustier conditions planetwide. Reduced vegetation cover due low levels of precipitation, and in part to inadequate CO2 supplies, would explain increased dust in Antarctic ice more efficiently than loess blown by wind from the northern hemisphere. CO2 reached very low levels, close to the lowest limits for biological primary production to persist, which would result in the reverse of the recent changes observed from satellites.
The long term support is drawn from the Geocarb III model which indicates that the last time in geological history prior to the Pleistocene that CO2 and planetary temperatures were comparable to the present was at end of the Permian. The planet, and atmospheric CO2, only recovered in the aftermath of the extinction. That recovery ended in the mid-Mesozoic and has been trending steadily lower since then – roughly 150-million years. That data suggests that biological and chemical “sinks” bury CO2 more rapidly than natural sources can supply.
There is no parallel support for drawing any negative conclusions regarding climate warming, even it were long term, which is unlikely. Thanks to data adjustments it is problematic to draw any reliable conclusion regarding modern trends, let alone Holocene trends. That is, even if the climate is warming, there is no evidence that this is a biologically “bad” thing.
There is NO evidence that shows that the linkage between increased CO2 and increased low troposphere temperatures is causal, and good evidence that it is not. To wit, the Vostok long ice cores show dropping temps at the end of glacial maximums, while CO2 is still building, peaking after the same 600-1000 year lag as when the warming began. So any reduction of human CO2 emissions will probably not have any effect on temperatures at all, and all the effort and cost of imposing such a reduction will be a total waste. Count me out.
The last interglacial endured for some forty thousand years and sea levels rose several meters (6-8?) higher than today’s, according to the USGS. Our interglacial began 11,717 years ago. If the earth presently verges on the next ice age, the planet is in trouble. So be frightened. VERY frightened. If sea level stops rising.
Correction. The previous interglacial lasted for 10,000 years (117-127 KA BP), and the sea-level probably rose 3-4 meters higher than now. The “7 meters” higher sea-level is a factoid.
From my USGS source:
“During the last interglacial period (about 125,000 to 80,000 years ago), sea level in the Chesapeake Bay area was 5 to 6 meters (m) higher than its present level. “
Yes, I’ve often argued the precautionary principle doesn’t cut the way AGW alarmists think it does, particularly given recent evidence that staple food crops could be negatively affected by the falling CO2 in a cooling world, and the fact no one can predict with much certainty how much longer this interglacial will actually last.
After the Minoan and Roman Warm periods the subsequent cooling may have reduced agricultural production which led to collapse of civilisations.There was widespread collapse of civilisations at about 1200BC possible caused by migration including the Sea Peoples.
The cooling after the Roman Warm period may have reduced agricultural production in the Empire and caused the barbarian tribes such as the Huns to migrate from Mongolia to look for pasture for their animals. Also the cooler periods may have caused rats and humans to move indoors which would have increased the spread of bubonic plague which weakened the Byzantium Empire in the 6 Th century.
Did cooling in the early 1300s help to spread bubonic plague in the 1347-1349 by rats and humans moving indoors to keep warm?
I assumed the upper US Midwest and northeast, those areas south of the Great Lakes would also be rebounding in elevation since they too had been under the ice sheet during the last major Glaciation. So ‘this map comes as a bit of a surprise to see those areas with negative elevation velocities. Still, the overall net gradual slope of sea level rise during the Holocene makes sense. At a net sea level increase of 2 meters per 1000 years, hopefully east coast coastal cities we be able to make the necessary changes to stay viable.
Agreed EdeF:
I puzzled over these researcher’s depiction of Canada rising from loss of ice while claiming the American parts are lowering in response.
Just how does that work geologically and tectonically?
Are the Appalachians some sort of seesaw that allowed the glaciers to lift America while depressing Canada?
The way these researchers describe GIA, it appears that the North American Continent tilts. If that is the case, why isn’t North America tilting from colliding with the Pacific plates?
Just how does the Atlantic rifting affect North America?
Or America’s sliding up over the Pacific plate, that has factually raised elevations across America to America’s Midwest?
Virtually none of the GIA assumptions or claimed correlations are known beyond general assumption.
Which places a great deal of suspicion on NOAA’s GIA and Geoid calculations with respect to sea level.
What matters to local planners at their local tide gauges, not some distant bureaucracy’s activism.
I remember reading some of this research back when it was “press released”, and puzzling how they could obtain “cores” along such unstable shifting coastlines.
One certain proof exists in Venice, New Orleans and a few other coastal cities on reclaimed lands:
That is, coastal lands sink as their life based carbonaceous remains are consumed/oxidized/dissolved.
Any core(s) involving seaside sediments must somehow account for this loss of material and loss of sediment heights.
After cutting off the Mississippi river source through channelizing the river and dikes for banks, land is disappearing at an alarming rate throughout the swamps and bayous below New Orleans. Land that was walkable slowly shrank or is shrinking below water levels.
nothing to do with plates sliding over one another.
more like (and this analogy is from general knowledge and may not be precisely accurate) a teeter-totter with light person+heavy person on one end and a light person on the other end. The heavy person gets off. The light person on the other end goes down, while the light person on the same end goes up.
Steve, teeter-totter is about the right analogue for post-glacial isostatic adjustment. Either that or what happens to the edges if you lift a big weight straight up off the center of a spring mattress.
There is what is called the “fore-bulge” some distance from the center of mass of the glacier over Canada. The mass of ice in Canada depressed the crust, causing the mantle to flow outwards producing a bulge in the crust to the south roughly in an arc.
The melting of the ice mass centered on Hudson’s Bay allowed the land to rise and it is still rising. The mantle is flowing back north and the fore-bulge is returning to its previous elevation. That explains the subsiding land in the US and offshore. The same phenomenon is happening in Russia.
******************
If Loutre and Berger are correct, the onset of the next continental glaciation will be a few thousand years in the future. MIS 11 was an interglacial that lasted about 50,000 years when sea level rose to 20 or so meters above present sea level.
M.F.LoutreA.Berger, Marine Isotope Stage 11 as an analogue for the present interglacial, Global and Planetary Change, Volume 36, Issue 3, 1 April 2003, Pages 209-217
Probably the New Madrid fault zone is connected with this mid continent isostatic adjustment.
Only geological firmament does not act like a seesaw/teeter totter.
What is causing alleged Glacial isostatic continental movement is secondary to the sediment discussion.
Scientists claiming they “know” GIA is caused by ice 10,000 years ago are speculating.
Earth’s lithosphere is up to 100km, (60+ miles) thick. All rock, imbedded fluids and some gases.
Most rock is non-compressible.
Beneath the crust lies 2900km, (1800 miles) of mostly solid Mantle.
Can there be some hydraulic activity allowing glaciers to depress land?
Maybe…
The trouble with rock structures, if they are compressed, they stay compressed.
Isostasy, describes equilibrium between the floating lithosphere on top of the mantle.
Some continental depression is likely, but why is the continent decompressing? What geological features act like a sponge that allow compression/collapse the spring back?
Perhaps there is some hydraulic actions through displaced fluids; but again, why are the fluids returning?
Miles of ice may have depressed portions of North America, but those mountains of ice can not “lift” tens of thousands of square miles land outside of the glaciers’ zone.
In spite of alleged glacier weight, that is burden is relatively minor given the 100km of Lithosphere crust.
That’s akin to claiming the outer skin of an onion compresses the underlying layers.
GIA is NASA’s excuse to engineer in the sea level rise they desire. It would be nice if they’d spend big bucks on actually determining how and glacial isostatic changes occur?
As far as the East Coast’s and New England’s negative changes in altitude, I’d lean towards groundwater withdrawal as a primary cause to consider.
Back to the main topic. Sediment layers:
Given that coastal sediment layers lose height/thickness over time due to humus loss.
Perfect examples are Venice and New Orleans; but there are many examples worldwide.
On a low lying coast subject to frequent tropical, non-tropical and extra-tropical storms; just how are these researchers accounting for annual humus loss in the sediment layers?
Then there are the various human dwellings and occupations along the East coast. Proving a piece of land/waterfront is virginal is near impossible on the East coast.
As much as people like to point to New England and Plymouth Rock; the entire East coast down to Florida was heavily populated/farmed/harvested/fished and/or used by man.
Think plastic deformation. Incompressible rock deforms under conditions of extreme heat and pressure if force is applied. In the case of GIA the force is gravity. The deep crust flows under gravity until equilibrium is established.
Perhaps. Deformation, is one prevailing theory, without any direct evidence of which I am aware.
A theory that does not explain why distant land that was not under kms/miles of ice is raised higher?
Consider that allegedly less than 2km of ice deforms:
A) 100km of hard rock lithosphere
B) 2900 km of mostly solid mantle underneath the lithosphere.
Rock does not deform; except under extreme pressure and heat.
Synclines and anticlines, formed by deformation, are easily seen in the Appalachian mountains. But those geological folds did not occur at the surface. Those folds occurred miles deep during periods of colliding continents, (orogeny, orogenic).
Which only demonstrates that when heated to high enough temperatures and severely stressed, rocks will fold, sort of, maybe.
Unless molten, rocks are never truly plastic. Synclines and anticlines exhibit stress cracks from the folding process. Cracks that are frequently healed through millennia of hydrothermal solutions.
Leaving the question, exactly what, where and why is the lithosphere deforming?
Then we’re left with the opposite situation; exactly why and how is the process reversed?
Rocks do not compress, unless one is compressing sand sediments into fused sandstones.
Rocks do not “flow” unless molten, which is called magma. Well, hydrothermal solutions do transfer minerals and fill voids or erodes.
Claiming that the “deep crust flows under gravity” is baseless. Tectonic forces demonstrate that with sufficient heat/pressure rocks will deform; nothing demonstrates that the “lower crust flows”, ever.
All along the East coast, if one visits crushed rock quarries that supply construction; one can observe ancient faults caused by one orogeny or another.
What seems to be a continuous rock substrate is extremely discontinuous due to all of the cracks, dikes, sills, pegmatites, vents and faults.
Digging Herkimer quartz crystals in the rock quarries around Herkimer, New York; one uses the frequent cracks to help bust the rocks up. It also helps that the hydrothermal solutions that form the crystals follow existing cracks; so some of the largest crystals are located along those cracks. Though the best Herkimer crystals are found in apparently sealed pockets.
Water, oil and gases collect in formations that inhibit vertical movement. It is conceivable that under pressure, these pockets could deform/crush/collapse squeezing the fluids gases sideways somewhere.
Why would those fluids return? What would re-establish the pockets?
Oddly, volatiles under pressure usually escape to the surface along the weakest boundaries adjacent to where pressure is applied.
Excuse, please, but liquids are incompressible, yet they flow. Rocks flow too, under the right conditions. Analogous to ice, another solid that flows. Fractured fold crests means insufficient heat. Go on a field trip and observe deformed metamorphic rocks and you will understand. Marble fudge.
You seek understanding, that’s good. Read up on magma, metamorphic rocks, rock mechanics, isostasy, isostatic rebound.
There’s lots to learn here.
“MIS 11 was an interglacial that lasted about 50,000 years when sea level rose to 20 or so meters above present sea level.”
Actually no, since all those very high sea-levels are from “fore-bulge areas”. The very long MIS 11 interglacial gave these areas time to sink back further, not the sea-level to rise higher. The true figure is probably half or less:
Click to access raymo_supp_2012.pdf
http://journals.ametsoc.org/doi/full/10.1175/JCLI-D-14-00282.1
This is what is happening in the UK.Scotland is rising which is pushing Southern England downards. There is a fault scarp in Scandinavia caused by by the rock rebounding upwards at a sufficient rate to cause the rock to fail.
It is local tectonic. Here is Finnish official site. This is Public knowledge in Nordci countries. In Finland one part shall rise 100 meters more during next thousands years. http://www.maanmittauslaitos.fi/en/research/interesting-topics/land-uplift
Insults and slights are not deserved, mpainter.
You conflate assumptions then leap to conclusions.
Liquids flow, yes. Liquids flow downhill or in response to pressure. Under pressure, liquids flow around/through weaker/porous materials, away from the pressure source(s).
As yet, there is not a natural method for liquids to flow back uphill.
Ice flows, if there is an outlet; as Greenland demonstrates so well.
Ice mimics metals; as do water’s components hydrogen and oxygen when in solid states.
Rocks do not flow. Nor has anyone actually demonstrated that solid mantle flows.
If, the mantle flows, then what causes a reverse flow?
Fractured syncline/anticline crests are normal. Since the vast majority of rocks do not bend, short of molten or near molten state; those rocks break and are frequently healed by solutions/magma sometime afterwards.
Metals are malleable, but there are very few significant deposits of pure or alloyed metals in the crust.
There are fibrous minerals; e.g. chrysotile. But, even here there are limits. Flexing the mineral in the open air is not the same as trying to flex that mineral in situ.
Any object flexing must allow one side to compress and the opposite side to stretch. Except for metals and substances that act metallic, minerals will not allow compression/stretching; thus they also break and may heal later.
I’ve viewed, collected and dug through igneous, metamorphic, and sedimentary strata.
One does wonder just what temperatures you believe these rocks are heated to?
Metamorphic rocks are caused by high pressures and temperatures at depth. But, many of the metamorphic minerals decompose at high temperatures. High pressures will not prevent high temperature mineral decomposition.
Nor does mineral paragenesis allow for sufficiently high temperatures for those mineral emplacements to achieve a near molten ‘plastic’ state.
Even with minerals that can reach near molten temperatures without decomposing; there is that problem regarding how near molten minerals deformed over millennia reverse deformation and flow back to their original positions.
AntonyIndia includes a wonderful image that demonstrates, and perhaps accentuates Earth’s lack of conformity.
Why would a leveling process work in one area, yet not all areas?
Here is a link to an article from the Smithsonian which has the standard explanation for the spring back.
http://www.smithsonianmag.com/science-nature/melting-glaciers-are-wreaking-havoc-earths-crust-180960226/
Think of the Earth as a balloon (where the crust acts somewhat like a membrane surface). When ice accumulates in one area, the additional mass pushes down on that location (most at the center of the ice sheet). The crust being relatively rigid (and flowing slowly) will take some time under the ice load to reach maximum depression. The Earth volume will try to remain constant which causes adjacent crust to be pushed up (this being US central plains and East coast for the areas of most concern to me). When the ice is removed, the crust will try to return to a nominal condition (this means the areas pushed down by the ice will rebound slowly and the areas pushed up will sink slowly. This whole analogy gets complicated by regional crust conditions and the changes in water distribution as the ice melts and the crust returns to “nominal”. Continental drift acts way to slow to be a factor in these conditions.
Good post Steve. The bottom line is that US policy makers should be discouraging development in low lying coastal areas. That would mean eliminating Federal flood insurance. It’s a simple policy change that would make a real difference.
observation and question
When the satellite sea level measurements began in 1993, the rate of Sea Level rise (SLR) was approximately 3.2mm per year with a rate of increase in SLR which would result in a doubling of the rate in approx 100-150years (ie to reach an annual slr of 6mm per year).
At the same time the tide gauges were showing approx 1.4mm-1.6mm(ish) annual SLR with a comparable rate of a doubling of the rate of increase which would take approximately 100+ years to reach 3mm per year.
Recently, the satellite record was adjusted downward in the early years to match the tide gauge record due to measurement errors in the early years.
Question #1 Supposedly the satellite is more accurate, but then, if so, why the adjustment to match the tide gauge.
Observation – It would seem the rapid acceleration of the SLR is an artifact of the change in method of measurement and not an actual acceleration of the rate of SLR. Any thoughts?
There is also an adjustment to account for the ocean floor moving.
At 6mm per year, that is still 150 years to rise by 1m. How do you get predictions of high sea level rise, or even the lower numbers like 2m?
The correction for GIA, i e the hypothesis that the volume of the ocean basins is increasing and thereby “hiding” part of the sea-level rise is based on GIA models that are known to be grossly wrong, particularly in the most important area (Antarctica).
Joe, it is not true that satellite sea level measurement is more accurate than tidal gauges. In fact, for whatever locale that such measurements are required, the tidal gauge is the only instrument of any use.
It is true that for an understanding of a general global sea level rise, many local tidal gauges do not suffice as these are reflecting local factors such as subsidence. So it’s true that satellite sea level data better reflect a general, global sea level than do tidal gauges on unstable coasts.
BUT..there are tidal gauges that are located on stable coasts and these yield data superior to satellite SL data. The fact is that the satellites instrumentation is regularly recalibrated against a specialized tidal gauge located on the Harvest offshore platform in the Santa Barbara Channel. The bottom line? Do not believe those who claim superiority for satellite sea level data.
The tidal gauge on the Harvest platform is referred to as “ground truth”.
So it might be said that the “ground truth” concerning the claim that satellite SL data is superior, that such a claim is b.s.
I hope that this tidal gauge is verified by GPS. The Santa Barbara Channel hardly seems an ideal choice for a tectonically stable area.
Redundant verification
I have not been able to find the Harvest platform tidal gauge records online. Would be very interesting, imo.
As mpainter points out, NASA’s satellite sea level estimates are from a hodgepodge of calculations and assumptions; including the referenced GIA which that 3,2mm sea level rise included and the more recent geoidal calculations.
1) Wind moves water.
Extreme high tides and extreme low tides often have as a root cause long periods of wind blowing from one direction.
A train I used to ride to work crossed a number of small bays along the Potomac River.
Extended periods of Northerly winds left incredible mud flat expanses as over 1 foot, (300mm) water was pushed out.
Extended periods of Southerly/Easterly winds not only flooded the banks of those bays, but pumped incredible water rises in the Potomac River around Washington DC.
2) Wave action
Yes, wind causes waves; but there at a number of causes for waves, including winds beyond the immediate area.
3) Tide
Tidal flows are dependent upon latitude and location. Higher latitudes experience greater ranges of tidal rise/fall.
What is a 1 foot, (300mm) rise/fall at one latitude is much higher towards the poles.
Each minute prior to high tide represents greater water height.
Each minute after high tide represents lower water height.
Peak high tides and peak ebb tides are rarely still water.
Each moment of tide position changes longitudinally.
4) Temperature
Water changes volume depending upon temperature
Satellite sea level determinations are like measuring a moving North/South knife edge without the ability to determine how wind, waves, gravity or water temperature affect the water’s height.
So many Hockey sticks in climate science, is it time for a Hockey team to call themselves The Adjusters, and adopt the tactic of moving the goals into the path of the puck
Or maybe switch to Curling instead of Hockey as a guide?
I think you may be on to something Charles 😀 Make use of that Mannian brush
“Sea level rise seems to me to be intrinsically connected to being in the Holocene interglacial and the only thing that seems likely to stop continuing sea level rise is a reversion to Ice Age conditions – a cure obviously worse than the disease.” The Holocene was catastrophic warming for the Neanderthal.
Climate projections enjoy the luxury of never having to concede error since regardless of claim there’s a perpetually waiting set of future observations in which circumstances can be reassessed. And, regardless of the manner in which climate changes there will be political losers (victims.) Climate scientist Robert Way provided his scariest warming story here.
James Hansen, former director of the NASA Goddard Institute for Space Studies, says here:
People seem to forget that coastal cities and barrier islands do not gradually disappear. It happens in specific once-in-several-hundred-year storms (that happen every year somewhere). If a barrier island is inundated coast to coast with everything wiped off it, and left mostly below the surf afterwards, there is low likelihood for rebuilding. OTOH, beach restoration and building of dunes is already a part of the economy now. With common sense measures, that should be done regardless, storm risks are manageable, just like earthquakes.
Hog Island, wiped out by storms
Measuring sea level changes in mm on this?:
Between where I live and New Guinea 160000 mm difference in sea level today due to gravity differences. These can also change, probably more on longer scales. Nice global base line …not.
The concept of sea level only makes sense in a local context. The NOAA operates a sea level guage in Vancouver, BC, imagine that. The mean sea level plot of that gauge is absolutely flat for the last 35 years or so. South of there, at Neah Bay, Washington, the SL is falling about 2-4 mm/yr. Meanwhile, at the Grande Isle, Louisiana gauge SL is rising at over 9mm/yr.
Gauges located in Chesapeake Bay show a SLR of 2-4 mm/year. The gauge at Galveston showed a steady SLR of about 3-4 mm/year until their subsidence problem was addressed by limiting ground water withdrawal twenty years ago. This arrested sea level rise, limiting it to less than a mm/year.
I consider the Jason altimeter project data misused when sea levels are computed from its product. It has little practical value and must continuously be corrected. It’s accuracy depends on a theoretical distance from the sensor to the absolute center of the earth, to within a few mm. Preposterous, imo, to compute a global sea level rise from a device that is only useful for revealing a general topography of the sea surface.
“… absolute center of the earth” ?? center of mass maybe? If it’s that, doesn’t it move around relative to stations on the surface?
Yes, an altimeter measures distance from sensor to surface which measurement is used to compute height of surface with respect to the center of the earth. And, yes, the axis of the earth’s rotation wobbles on a period of ten meters, more or less. The accuracy claimed for Jason is to within 33 mm.
Rest assured, this new EGM 2008 Geoid has a resolution approaching 10km; the last one did 100 km. Good for mm jobs….
NASA’s SSH satellite project shows these graphics under social benefits; I fail to see a global hockey stick there. https://sealevel.jpl.nasa.gov/images/socbenefits/Global-mean-sea-level-rise.jpg
North America’s east and west coast differ 150mm in places during 1993-2006 not to mention seasonal differences.
Joshua Willis, the same as Josh Willis, an oceanographer employed at NASA Jet Propulsion Laboratory. His specialty is sea level.
Josh is involved in the Argo sea float project. It is documented by NASA that his contribution to the project was to discard data from Argo floats that were deemed too low. This was to correct for results that showed that the oceans were cooling, overall. That cooling of course was impossible because the “pause” meant that the oceans were absorbing all of the heat that somehow escaped our thermometers. So Josh proved that things were warming, after all. For this achievement NASA published online a prideful documentary of how the young scientist uncovered the hiding place of the heat that everyone knew was missing. But then Trump came along and that prideful documentary disappeared, tsk, tsk.
Correction, the documentary is extant, published by NASA Earth Observatory. Our young hero still has shine. A quote from that document :
“The oceans are absorbing more than 80 percent of the heat from global warming,” he says. “If you aren’t measuring heat content in the upper ocean, you aren’t measuring global warming.”
The young hero (search: Josh Willis Argo) has graduated from adjusting data to discarding data, enterprising young scientist that he is.
“The oceans are absorbing more than 80 percent of the heat from global warming,”
Ok, than why was the ARGO project started only in 2000? Climate science was settled, wasn’t it?
Just asking this question got me banned (again) from the Guardian comment section.
Reply to M Painter 28 Nov: discarding unwelcome data sounds like bad science: can you provide a reference to NASA’s documentation of this practice?
I did, here it is explicitly: NASA Earth Observatory Article: Correcting Ocean Cooling
Or search: Josh Willis Argo.
If you read the whole article, it plainly states the methods of Josh: he cooled the past and warmed the present by discarding past data that was too warm and current data that was too cool. And thus ocean heat content properly rose, and the fugitive warming was fingered. Our enterprising young scientist is now a self made man.
Thanks, mpainter. I hadn’t seen your earlier reference. The NASA report glosses over the criteria used to distinguish the floats producing ‘bad’ data from the rest, apart from the trend of the data not fitting preconceptions. As you point out, that looks bad, and NASA seems to owe us all an explanation. Thanks again.
mpainter wrote: Willis “cooled the past and warmed the present by discarding past data that was too warm and current data that was too cool.”
Which is correct, but misleading. Most of the historical data on ocean heat content before ARGO was acquired with XBTs. XBT’s used a lousy method for determining depth. Falling time was converted into depth using:
d = At + Bt^2
Different units had different coefficients (which later were found to vary with temperature in addition to innate variability between units). The whole OHC content record from XBTs is a maze of correction factors that are still being studied today. The large change (both up and down) in OHC from year to year was judged to be physically implausible, so five year averages of OHC are graphed today to make the data look less noisy. A skeptic might look at this mess and say that it doesn’t really prove anything, but other scientists even today keep trying to extract a useful information from the data we have – perhaps without realizing how their expectations might bias their results.
http://journals.ametsoc.org/doi/full/10.1175/JTECH-D-15-0216.1
ARGO floats work by a totally different methodology. Every year some floats are retested to ensure that the changes they are measuring are real. Floats producing dubious data can be tested and their results discarded or adjusted. Willis discovered that one manufacturer’s floats used incorrect software to convert pressure to depth, producing large errors (compared with nearby floats). The official ARGO records has been corrected following the manufacturer’s recommendations. At the moment, skeptical climate scientists are asking fewer questions about the reliability of the warming reported by ARGO/OHC (0.7 W/m2) than most other climate records.
http://journals.ametsoc.org/doi/full/10.1175/2008JTECHO608.1
Because of the radical change in technology between XBTs and Argo, the intersection of these two records was a mess. That isn’t a surprise. Changing from liquid-in-glass thermometer to a thermocouple introduced a slight bias in 3 m temps over land. Fortunately, everyone knew that the absolute temperatures reported by XBTs were dubious.
The important take home lesson is that the upper ocean has been warming according to ARGO for about a dozen years. If you want to believe the much longer XBT record (I’m not eager to), it now shows a similar warming trend.
Frank, you say “[adjustments galore]”
Yes, appropriate for the present era (the Adjustocene, see head post).
Also very appropriate that the chief adjuster should be… one Josh Willis (see head post)
As a skeptic, I can only wonder that I am invited to feel reassured over [adjustments galore] at NASA Jet Propulsion Laboratory. During the Adjustocene.
mpainter: You should feel reassured that the current rate of ocean heat uptake (as measured by ARGO) is relatively free from controversy:
That value is used to calculate “committed warming” (the difference between TCR and ECS) and the values from ARGO are somewhat lower than expected before ARGO.
It is now harder for high ECS models to reproduce the historic record of warming by sending “missing heat” into the deep ocean.
We can agree that the climate establishment has swept many problems under the rug. You want to call ALL data the Adjustocene. I want to know what data, if any, we can believe. ARGO currently appears to be believable and fits supports the idea that ECS could be around 1.5 or 2 K.
I emphatically disagree that what comes out of JPL is creditable as worthy science. Josh Willis is exemplary of the standards in that organization, imo.
When one believes in ghosts and goblins, one finds them when he looks for them.
When one’s science is performed with a “hockey stick” frame of reference, one finds hockey sticks.
When one has warming on the brain, one should not be in charge of such matters as the ARGO project.
The NASA Jet Propulsion Laboratory shows itself in need of a new broom. There are other NASA organizations that need to be cleaned up. GISS is one.
Steve, you say “On balance, our civilization effortlessly accommodated sea level rise in the 19th and 20th centuries. However, barrier islands off the US East Coast have been gradually submerged. Present-day barrier islands will also be gradually submerged in their turn,..”
### ### ###
Barrier islands can more properly be said to “shift” shoreward with rising sea levels. Actually greatly enlarged sand bars, these islands are subject to a process known as “rollover”, a result of taking the incessant pounding of waves which moves the sand grain by grain up the beach gradient to the dunes where the wind moves it across the island toward the lagoon. This rollover process is a permanent process of shorelines. The sand is replenished by rivers that bring their sediments to the sea and spread along the strand by alongshore currents. A rise in sea level simply speeds this process. This is a relatively minor point, seemingly, but the same process occurs on coral atolls. The atoll is never “submerged” but is maintained by the same sort of wave and wind effect that preserve the barrier islands: there is simply a shift of the strand and dunes toward the lagoon with the atoll maintaining a constant elevation of a few meters above sea level. My point is that much of the alarmism about sea level rise concerns inundation of atolls, but in fact these are self perpetuating under conditions of rising SL. In other words, scratch another alarmist myth.
There is a whole dimension about global tectonics that is hardly covered in the literature. One such dimension is the topic of a new book by a former boss, John N Elliston “The Origins of Rocks and Mineral Deposits” publisher Connor Court Australia. This deals With under-researched colloidal processes. While some aspects of crustal deformation fit easily into colloidal concepts, these have so far received scant attention.
This is not a pitch to sell the book, but more to note how dangerous it can be to make strong conclusions in earth science work when some of the field of possible processes remains unreferenced.
There is a lot of global warming publication that seems innocent of the dangers of making robust conclusions from incomplete science. We can but hope that the guilty authors will mature, learn from history and improve. I have long been sceptical of sea level change research because, inter alia, we know very little about the deeper half of the ocean and its supporting lithologies. Geoff
Steve: summary of Elliston online here riviste.fupress.net/index.php/subs/article/download/26/16/. As bonus, it includes a picture of Geoff Sherrington.
Thanks, Geoff.
I have a question to ask geochemists. Lots of chemical processes follow kinetics that can be said to follow sums of exponential functions. There are reasons for that physically. Is it possible that we don’t know enough about the mechanisms such that linear extrapolation should be considered with wide uncertainty bounds? Is it possible that logistic functions would fit better? What does that do to age estimates? That book sounds interesting. I’m retired now, so getting a copy might not be possible.
CDQ,
Overall, the kinetics and energetics of numerous chemical reactions are known with adequate certainty. They are measured mostly in simple systems?
Earth science systems are sometimes quite complex. In a thought bubble, think of numerous simultaneous and sequential reactions in a system that might or might not contain an unrecognised catalyst. While one fan model the system from individual reactions, the emergent properties can be unexpected and require more understanding.
There is no expectation of which I am aware that chemical kinetics are married to mathematical shapes, be they linear or exponential or polynomial. It is more he case that the chemist comes to regard chemistry as a language that speaks back, heard sometimes when results are not confirming. But if a reaction or a statement is measured with a large number of induced variations it will generally be possible to fit some ordinary mathematical shapes. It was not important in my type of work to fit shapes, it might be in others. Geoff.
Indeed, most are measured in simple systems, yet not all are. Consider biochemistry and pharmacology, for instance; yet you can still say and see that your results, while not married to mathematics, do fit some forms commonly. A very common function fit is the logistic function, which is a sum of exponentials. Granted that your work didn’t need these, but I’m wondering about the cases where it does or could be important, say, for instance, in age estimates. I’m wondering if errors and biases related to mathematical, or maybe better said, statistical overconfidence are being properly thought about and accounted for.
CDQ,
I have not examined logistics math enough to assist.
With age dating, the big problem is to know conditions at the start of the calculation process, eg what were natural C isotope ratios n years ago when the math of decay scheme
started. Some speculate that the rate of some radioactive decay varies with time, but these are likely rare or wrong cases. Much climate change error estimation is ad hoc and needs to comply with standardised guidelines. But we are OT here. Geoff.
Oh Steve, I blush!
Signed copies to Climate Audit readers available for $2,500 US. For the photo that is. The Elliston book is priceless. Geoff.
Steve: I respectfully submit that we should all be careful to distinguish between local SLR and global SLR (especially scientists like Willis). You are correct that local SLR in NJ has been about 1.8 mm/yr for several millennia due to subsidence (caused by glacial isostatic rebound further north). Local sea level rise can also be caused by global SLR, compaction, ground water or petroleum extraction and changes in wind. (IIRC, shifting winds associated with El Nino produce 1 foot of local “SLR” in the Western Pacific and 1 foot of fall in the Eastern Pacific. Sea level in NYC may respond to the AMO.) When discussing climate change, we are usually referring to global SLR, but local impacts are caused by local SLR.
Places like NJ – where vertical land motion has a big impact on local SLR – are lousy places to draw conclusions about global SLR. However, such locations are great for alarmists. The latest satellite altimetry measurement estimate for global SLR is 2.4 mm/yr since 1993 and 1.8 mm/yr or 18 cm/century (averaged over 20th century) for tide gauges. So local SLR in NJ COULD be about double global SLR. Tide gauges provide a more accurate record for telling us how GW has changed local SLR in NJ than Willis’s reconstruction (with a sampling rate of less than once a decade and a vertical error of about 0.25 m.
Putting the historical record of global SLR in convenient units of cm/century:
17 to 7 millennia ago: 100 cm/century (possibly higher during putative Pulse A)
7 to 4 millennia ago: 10 cm/century
4 to 2 millennia ago: 5? cm/century
2 to 0.1 millennia ago: 0? cm/century (less than 2.5? cm/century)
20th century: 18 cm/century (0.75 inch/decade)
1993-2013: 24 cm/century (1 inch/decade)
21st century: 40-80 cm/century projected, possibly 100 cm/century
acceleration need for 1 m of SLR in 21st century: 1 inch/decade/decade
0.25 mm/yr/yr.
Millennial changes in global SLR of 1 meter or less are challenging to measure, so rates of about 10 cm/century or less are within experimental error of zero before tide gauges. Nevertheless, we can see that 20th century SLR was not normal for the two millennia (and probably the four millennia) that preceded the 20th century. The early rising tide gauge record therefore must reflect the warming that ended of the LIA. Your speculation that the dip in the NJ record was due to the LIA makes perfect sense, but can’t be seen in the global SLR record (measured at geologically stable sites).
There doesn’t appear to be a clear gap between the SLR produced by the warming that ended the LIA and the warming attributed to GHGs after 1975. This makes some sense, given that sea level rose for about 5 millennia after temperature reached a plateau about 10 millennia ago (in Greenland and Antarctic ice cores). Given the slow response time of the system and the amplitude of the response at the end of the ice age (20 m/degC), fairly continuous SLR in the 20th century might be expected.
Y’all might like this paper:
Click to access Bezdek%20Sea%20Level%20Chesapeake%20Bay.pdf
Reblogged this on I Didn't Ask To Be a Blog.
May be OT – but I feel as if an enormous percentage of alarmist predictions about the bad effects of climate change boil down to rising sea levels. It seems to me like that is one of those problems that is relatively susceptible to geo-engineering type solutions. Does anyone know if there has been any serious looking into this?
I googled it and turned up a bunch of articles talking about how expensive it would be to pump the water back up on top of the south pole. I am not at all sure that even that wouldn’t be worth it if it would give us genuine control over the sea level, but is that really the best way to go about it?
You seemed to have missed the point: sea level rise is a local problem, with rates varying according to locale, to be dealt with in a local context. Pay no attention to the geoengineering clowns.
Back of the envelope:
– 1mm SLR = 360 billion tons of water/year = 1 billion tons of water/day
=2 trillion pounds = 1 trillion kilograms = 1 billion cubic meters per day
Suppose we’re going to address that by digging a hole 10 meters deep and letting the water run into it. Then the hole needs to be 100 million square meters in area = 100 square kilometers = 10 km x 10 km.
I feel like all the resources of modern civilization are capable of digging a hole 10 km x 10 km x 10m each day. Yesyes I know, it’s more complicated than that, but you get the point.
Ah! You meant to expose the absurdity of geoengineering schemes, yes I get your point now.
Why dig any hole larger than to make a fresh water retention lake to collect Antarctic spring melt? Then have an underground tunnel to continuously pump the water to to a natural retention valley somewhere close the the S pole. The continuous flow should be of such to prevent freezing in an insulated tunnel.
The termination of the tunnel is in the shape of a hockey stick with the blade aiming straight to the sky in the center of an open valley or plateau where the fountain opening will create what will become the largest ice mountain in the world. The preceding three kilometers of tunnel would be lined with an actuating liner wall that could continuously extend the height of the fountain as the frozen ice cone supports and ever growing height. A nuclear power plant would be required (hopefully fusion) to pump and heat the massive flow.
For every cubic kilometer of sea volume the level changes by ~2.5 meters. I calculate that at a flow rate of one ten thousandth of Niagara Falls it would take 132 years to build a one cubic kilometer ice mountain.
Niagara Falls flow = 2400 cu meters/sec
2400 / 10,000 = .24 * 3600 sec/hr * 24 hr/day * 365 days/yr = 7,570,000 cu meters/year
1 cubic kilometer = 1,000,000,000 cubic meters / 7,570,000 = 132 years
An actual geo-engineering XXL hockey stick under Antarctic land ice to prevent possible sea level hockey sticks? Power the water flow with wind turbines and the Micheal Mann’s couldn’t refuse… 😉
Slight math adjustment. Multiply all by 1 million.
360 million square kilometers of surface ocean at one meter depth is 360,000 cubic kilometers. So one would need to pump that per hundred years, 3,600 per year, 9.8 per day.
Digging more reservoirs to collect fresh water seems like a doable solution. I think this is the reason given for the drop in sea level around 2008.
Reblogged this on Climate Collections.
We could usefully start by refilling the Aral Sea and the like.
good idea – at least aral sea is a salt water lake
Perfect, 68,000 km^2 * 23 m deep = 1560 billion cubic meters = 4 mm sea level rise 🙂
I realize this is about as far from the scientific rigor of the main posts as possible…just trying to think outside the box a little.
We need to move a cubic kilometer of water/day (5 Niagara Falls) to lower sea level at a rate of 1mm/year. Until we get a powerful non-fossil fuel energy source our best solution is to create a temperature knob. Here are a few ideas:
1) Disperse a harmless atmospheric aerosol to warm the stratosphere.
2) Make organisms that produce a harmless surfactant (like Dawn) that would promote the formation of white sea foam (spoom), which has the emissivity of snow.
3) Genetic engineer sea borne micro-organisms with reflective husks that float for several years after their death.
4) Build a space parasol. The location in space that is in gravitational equilibrium between the Earth and the Sun is known as Lagrange point 1 (L-1). Several satellites sit in this semi-stable orbit. Power is still required to correct for the shorter solar orbit than the Earth’s.
5) Bjorn Lonberg has an idea of moored wind turbines to blast sea water fountains into the air to make reflective sea ice shades. Blast fountains could also be done on land ice pumping from fresh water reservoirs thereby shading that ice as well as keeping land surface at optimal reflective with fresh snow.
One huge benefit of any of these solutions over limiting CO2 is that they are easily reversible should a planetary cooling event occur, leaving CO2 as a warming dead-man’s switch to stave off catastrophic cooling (ice age).
A few weeks ago, someone posted an article on LinkedIn about saving the California (Sacramento-San Joaquin) Delta. While human impacts were rightfully given blame, some of it was attributed to sea level rise due to climate change. The irony is that the delta was created by sea level rise due to climate change some 10,000 years ago. It’s like now suddenly it is supposed to stop rising?
Steve ==> By tide gauge, unadjusted for Vertical Land Movement, Beaufort, NC has a total annual sea level rise of about 3mm/yr, since record keeping began in the mid-1950s. 60 years, about 8 inches. There is a CORS station at Beaufort, but the data set is only two-years long, not useful yet, by NOAA standards, for determining annual vertical land movement (VLM) trends.
If we accept the rough guess of – 1mm/yr VLM, this reduces sea level height change at Beaufort to ~ 2mm/yr, or about 5 inches of actual water rising irrespective of land movement.
2mm/year is very close to the generally accepted long-term global level of sea height rise.
There have been several papers relating an increase in SLR along the East Coast due to slight changes in prevailing winds, pushing extra sea water up against the East Coast (basically).
Why anyone would measure a proxy instead of the observed and observable physical phenomena is a mystery to me. Beaufort, NC has been a continuously occupied sea port for over 300 years.
Having lived at Beaufort for several seasons, over the last 15 years, and being intimately involved with the sea port and boating world there, I can tell you anecdotally that there is nothing unusual going on in the region with sea levels.
Near Beaufort is a town named Sea Level, NC. Altitude – 0 feet above sea level.
Storms pushing storm surge are the present and past threats to NC’s shoreline, particularly the barrier islands that are reshaped, cut in two, rejoined, and moved about by big storms. (We were at Beaufort when Hurricane Irene came ashore there as a direct hit.)
Up the estuaries, houses are now required to be built on “stilts” leaving 8-10 feet of unoccupied space below the living quarters to allow for storm surge.
The ONLY sea level rise of any interest to the people of North Carolina is LOCAL RELATIVE SEA LEVEL RISE. It is somewhat different in every locality.
Kip,
I’m a resident of the east coast (Virginia) and have been for almost 60 years. I’ve also spent some time (mostly recreationally) in Eastern NC, and I’ve been to Beaufort (not that that means anything), and anecdotally, there’s nothing here to write home about (and I live here). Oh, and the last King tide in November they tried to create a panic over? That was a bust. Lots of hype for months before “The Tide,” but haven’t seen a single story about it since.
And once controls were enforced on groundwater withdrawal in the Galveston Bay area, subsidence has been arrested and sea level at Galveston has seen only about one mm rise these last 18 years or so, when previously it had been over thirty mm per decade. The problem of sea level rise is now remedied at Galveston.
Another example to illustrate that change in sea level is meaningful only in a context of locale and that alarms about a global sea level rise is simply more climate alarmism.
mpainter wrote: “And once controls were enforced on groundwater withdrawal in the Galveston Bay area, subsidence has been arrested and sea level at Galveston has seen only about one mm rise these last 18 years or so, when previously it had been over thirty mm per decade. The problem of sea level rise is now remedied at Galveston. Another example to illustrate that change in sea level is meaningful only in a context of locale and that alarms about a global sea level rise is simply more climate alarmism.”
Yep, the 120 m of SLR that followed 5 degC of GW at the end of the last ice age are totally trivial compared to local change in sea level.
It should be obvious to everyone that small changes in temperature have the potential to cause large changes in sea level. The nearly 1 degC of warming in the 20th century (most of which is probably forced by man) could doom a good chunk of the GIS. It melted during the previous interglacial and southern Greenland was forested.
The important question is: “How fast?” I can find no evidence demonstrating that such a significant acceleration in SLR is currently underway. It takes an acceleration of 1 inch/decade/decade (from the current rate of 1 inch/decade) to reach 1 m of SLR by the end of the century (and 9 inches/decade). Unfortunately, the noise in the satellite altimetry record means it will take a long time (several decades) to detect such an acceleration.
If it didn’t melt during the MWP, then it seems like it’ll take a while.
SLR rate is not only a function of melt rate but also of ocean heat content OHC. I believe approximately half the SLR projected is due to ocean thermal expansion. The pause or drop in SLR in the LIA was likely due mostly to thermal contraction as OHC is much more responsive then glaciation and melt rates.
eloris: What makes you think the GIS didn’t melt during the MWP? The corals used to track global sea level rise over millennia don’t have the resolution needed to track 1 m of SLR over several centuries. In this post, Steve speculates that changes from the MWP and LIA can be seen against the background subsidence on the coast of NJ. Ice cores showed summer melting at the Summit of Greenland during 750-1250 but (with one exception) not again 2012.
Click to access Neffetal2014.pdf
It is possible that continued retreat of Greenland glaciers will uncover terminal moraines from the MWP that have been covered by advances during the LIA. This is certainly what happened in the Swiss Alps. Today’s warmer temperatures are exposing things at many locations that were buried by glaciers (not ice sheets) during the LIA. Why would anyone expect the edges of the GIS to behave any differently? However, studying the retreat of the GIS during the MWP won’t do much to advance the career of a climate scientist.
You are correct – it will take a while.
I feel like global SLR being 1m higher is the kind of thing that would be noticed if it happened during historic times. Wouldn’t many currently coastal areas have been under water, including areas that were populated during that time?
eloris wrote: “I feel like global SLR being 1m higher is the kind of thing that would be noticed if it happened during historic times. Wouldn’t many currently coastal areas have been under water, including areas that were populated during that time?”
Over a few millennia, 1 m of global sea level rise can easily be obscured by vertical land motion associated with local geological change. If you have visited ancient sites in the Mediterranean you can see the result of these local movements. The historic site of the port of Ephesus (Greek and Roman) has risen and is now 3 kilometers from the Mediterranean. However, the site of the ancient port of Alexandria (Egypt) is now underwater.
Global SLR from the ice ages has been tracked mostly with coral reefs in geologically stable regions in the tropics (far from glacial isostatic rebound and associated subsidence). That works great for 10 m of SLR, but different sites disagree about 1 m of change. (See Wikipedia composite.) Climate scientists are working on methods to track smaller changes in local SLR over a millennium or two and the article above is one such effort. The challenge is distinguishing between sand that is being shifted by currents on barrier islands and a change in sea level. In Figure B above, the boxes show the uncertainty (1 STD?) associated with each measurement back in time and doesn’t include any systematic errors.
Frank says: ” Climate scientists are working on methods to track smaller changes in local SLR over a millennium or two…”
### ### ### ###
Climate scientists? Nope, sorry. The field of research was old and well established many years before “climate scientists” came along to apply their dubious sort of methods.
Professor Nils-Axel Morner has been investigating sea level change for over fifty years. He is not a climate scientist. His field of research encompasses shoreline geomorphology and related issues. This field of study is many decades older than climate alarmism. Disgusting how climate scientists ignore the work of their distinguished predecessors in this field.
For those unfamiliar with Professor Nils-Axel Morner’s work, his field of Quaternery shoreline investigations encompasses sea level. See his comment below.
“Climate scientists are working on methods to track smaller changes in local SLR over a millennium or two and the article above is one such effort.”
#############
Venturing into a long-established field of study should give these climate scientists the opportunity to improve their methodology. If they only pay attention.
mpainter ==> This is the reason why local Tide Gauge data must be coupled with long-term CORS-type (see NOAA CORS) GPS stations, preferably attached to the same structure, so that the Vertical Land Movement (VLM) can be separated out from changes in the sea surface height (distance from the ‘center of the earth’, really the geoid, and the surface of the sea).
In truth, all that matters to Galveston is Local Relative Sea Level and its changes…..if it is rising, they have to deal with it.
Galveston “guessed” that ground water removal was sinking the land (they had good geological reasoning there) and have saved themselves a lot future heartache.
“…they have to deal with it”
### ### ### ###
As at Grande Isle, Louisiana, whose NOAA tidal gauge gives a MSL trend of -9.6 mm per year. Population on that barrier island is ~1400. The problem is a general subsidence due to sediment compaction/slump. All of the delta area is sinking. Meanwhile, about one hundred miles to the west at Sabine Pass, the MSL trend is flat for the past twenty years or so. So, absolutely, rising sea level is a problem to be remedied in a local context, alarmist hype notwithstanding.
mpainter ==> Quite so. The MSM’s two favorite examples are Norfolk, Va (really, the spot they highlight is in Portsmouth, west across the river at Hospital Point) which is built entirely on fill which washes out from under the waterfront road (and the nearby neighborhoods) as tide flows in and out through the rocks of the fill washing out the soil and a favorite intersection in Miami Beach which was built alongside the bay but unfortunately below Highest Astronomical Tide (Tidal Datum HAT) so that it can be counted on flooding at every King Tide and almost all storm surge situations. All entirely local situations.
Right, Kip, and all these local situations providing grist for the alarmist mill, those turning the crank claiming it is all AGW. And now rising sea level is the last refuge of the climate alarmists, all other alarms having been debunked and forgotten.
But, in fact, there is no basis for alarm over rising sea level, as this post and commentary show.
mpainter ==> There isa no need for alarm, but there is need, in some places, such as Miami Beach and other silly development areas built with total lack of concern or foresight at mere inches above highest existing tides, built on subsiding marsh lands, built on 50 and 100 year flood plains.
All these areas require rapid mitigation plans — some should be scheduled to be abandoned as seas slowly rise to flood them repeatedly.
Modern Man has a blind spot in his thinking [well,, many blind spots, actually] — one of them is that “things will always remain as they are, at their best, on a good day. Nothing bad will happen in the future and the bad times of the past will not return.”
I’m surprised they don’t use Jamestown as an iconic example of global warming in action. It used to be on a peninsula, but now it’s an island!
Dear Steve,
I am surprised, and maybe even a little disappointed that you didn’t use my analysis in Don Easterbrook’s 2016 Elsevier book, Chapter 12, p. 210-229, Section 3.4, Figure 12.6, where
I address the paper by Kemp et al. (2011) and conclude:
“Therefore, we must assume that there are serious problems related to the reconstruction of sea-level changes at Sandy Point, which implies that it cannot be cited as evidence of a recent acceleration in eustatic sea-level rise.”
best wishes / Nils-Axel Mörner
Professor Morner,
I am delighted to see you comment here as I am familiar with your work concerning the Maldives and how you took issue with the alarmist claims of the former government of that archipelago, concerning sea level rise there.
For those unfamiliar with Professor Nils-Axel Morner’s work, his field of Quaternery investigations encompasses sea level studies and he is has long been a much respected investigator in this area.
An experienced sea level expert in our midst!
Thanks for commenting. I haven’t read Don Easterbrook’s 2016. I’ve mostly been taking some time off from climate in 2017. It sounds like we agree on the issue. REgards, Steve Mc
” In a new paper published in Earth Systems and Environment this month, Australian scientists Dr. Albert Parker and Dr. Clifford Ollier uncover evidence that Permanent Service for Mean Sea Level (PSMSL) overseers appear to have been engaging in the “highly questionable” and “suspicious” practice of adjusting historical tide gauge data to show recent accelerated sea level rise where no such acceleration (or rise) exists. ”
http://notrickszone.com/2017/12/04/whistleblower-scientists-psmsl-data-adjusters-are-manufacturing-sea-level-rise-where-none-exists/
One Trackback
[…] https://climateaudit.org/2017/11/25/us-east-coast-sea-level-rise-an-adjustocene-hockey-stick/ […]