Yesterday, Science sent me 13 Esper site chronologies, all standardized using RCS methods, one of which is the updated Polar Urals site. It’s hard to think of a better testing ground for Rob’s argument that the variance of the Polar Urals series disqualified it and mandated the substitution of the hugely hockey-stick shaped Yamal series. See http://www.climateaudit.org/?p=541
In the spirit of spaghetti graphs, I have calculated 101-year moving variances for all 13 Esper sites, along the lines of Rob’s graph. I then scaled them all to have a mean of 0 and standard deviation of 1 . Here’s what I got, with the Polar Urals series shown in heavy black. Using the dendroclimatological statistical technique of "eyeballing", I do not observe any reason why the Polar Urals series is particularly problematic.

Figure 1. Spaghetti graph of 101-year moving standard deviations (scaled).
The red series caught my eye as it seemed to have a lot of similarity to the Polar Urals series in range. So I’ve plotted it and the Polar Urals series below. Guess what it was – the usual companion to Polar Urals: Tornetrask. So the variance at Polar Urals does not seem at all unusual relative to Tornetrask.
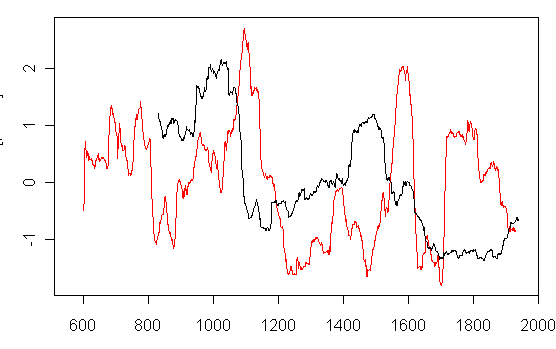
Figure 1. Non-spaghetti graph of 101-year moving standard deviations (scaled) for Polar Urals and Tornetrask.


3 Comments
Rolling standard deviations on a series with significant trends? I just don’t get it. If you have trends or cycles that have a period of greater than the window you use, the mean/trend effect is just going to swamp calculations of standard deviations.
Consider:
X(t)=t+epsilon (i.e. a linear trend plus noise)
epsilon=N(0,1)
and Y(t)=epsilon
Compare the standard deviation of these two series over any window and you will find that X(t) is much more variable than Y(t), but it doesn’t really tell you much. Indeed, it seems that selecting on stable variance is a recipie for squashing any actual signal in the series. I must be missing something. What am I missing here?
Steve, by rescaling them to have a mean 0 and sd=1 over the series length, that might understate some of the differences. Shouldn’t you rescale them to the mean and sd over the post-1901 subsegment? (Just kidding!)
What I’d rather see would be the Goldfeld-Quandt stats for each series. And, if homoscedasticity is suddenly so important, let’s hear an a priori declaration (without peeking at the results) from the tree ring experts of what the cut-off is that disqualifies a series. But beyond that, as you pointed out earlier, someone needs to provide a model to explain why we would not expect tree rings chronologies to exhibit ARCH behaviour, especially since they are otherwise known to be strongly autocorrelated. If there’s some reason to believe that a valid proxy would not reject a null of no-ARCH, then a gauss-newton regression is easy to do and generates F stats that settles the matter. Again, if paleoclimatologists really believe this is a legitimate selection criteria, let them pick the p-value for the F stat before peeking at the answers.
Even if one accepts an eyeball argument for the Yamal switcheroo, then the Yamal series looks like it should be truncated at around 1900.
My “Eyeball Technique” tells me that there is no climatic significance to any of the Esper series. Should I publish?