When you go through the NAS Panel report closely, it’s amazing how many of our views were adopted – on principal components, statistical skill, statistical methods, bristlecones. I started out trying to make a post showing our views side-by-side with those of of our opponents and those of the NAS Panel, but the post quickly got out of hand in size. I’ll start with biased principal components, not because it’s the most important issue. I don’t think that it is, although it’s got lots of publicity because the effect itself surprised people and it’s technically interesting.
For the purposes of this post, I want to distinguish between the existence of the bias as a mathematical effect and whether the effect "matters". I think that it "matters", but the impact is a different issue than the existence of the effect itself. (I might add here that correlation or covariance PCs are irrelevant to the bias – that correlation and covariance PCs yield different results in the North American network is just an empirical oddity because of low variance in the bristlecones, but I’ll return to that when I discuss the NAS Panel’s view on whether the biased PC method "matters."
In our submission to the NAS Panel, we asked them to provide an opinion on the existence of bias in the Mannian PC methodology as follows:
One fairly practical issue on which the Committee’s opinion would be useful is the existence of this bias. Von Storch and Zorita [2005] and Huybers [2005] both acknowledge the existence of the bias, although they do not agree with us on its ultimate effect on a temperature reconstruction. Mann et al. have denied the very existence of the bias. The two issues are obviously separable and we would welcome a specific opinion.
As you will see below, they provided a specific opinion (although not necessarily because we requested it) and the opinion endorsed our position.
MM05 (GRL)
In our GRL article, we’d pointed out that the MBH principal components method was severely biased and over-weighted bristlecones, a finding previously publicized by Richard Muller in an article for the MIT Technology Review online. We expressed the bias as follows:
[MBH] carried out an unusual data transformation which strongly affects the resulting PCs. Their method, when tested on persistent red noise, nearly always produces a hockey stick shaped first principal component (PC1) and overstates the first eigenvalue.
Internet Response
This finding provoked a furious internet response. This was pre-climateaudit. You’ll get a sense of the type of opinion-forming that we were facing and how quickly one could lose credibility when confronted with determined internet criticism.
One of the first responses to this claim came from William Connolley, a realclimate coauthor who has been very active on the internet, including as a Wikipedia editor, in attempting to discredit us.
But (having read their paper) I now think I understand what they think the problem is (aside: they complain about data issues with some series but I think this is beside the point: the main point they are talking about is below), and I think that they are probably wrong, …. Perhaps someone would care to go through and check this. If I haven’t made a mistake then I think M&M’s complaints are unjustified and Nature correct to reject their article.
James Annan quickly agreed with Connolley:
Having had a quick glance at this and their papers, I think I agree with you. In fact it appears that we can add not knowing the difference between multiplication and division, to the already impressive list of blunders that M&M have made. They even seem to talk about adding the mean to the time series rather than subtracting it too. I might check this more carefully over the next few days if no-one else beats me to it.
I corresponded with Annan at the time, sending him code, and asking him to check and withdraw his remark, if it didn’t hold up after checking. Needless to say, I didn’t hear back from him.
Tim Lambert made two posts here and here referring approvingly to Connolley’s post and concluded:
Jury is still out, but it does not look promising for McKitrick
Brad DeLong, also cited by Lambert, added to the voices of ridicule:
Tim Lambert and William Connolley think that my colleague Richard Muller has been snookered by McKitrick and McIntyre, who believe that Mann et al.’s data normalizations artificially enhance the influence of series that show an uptrend since 1900. But Connolley argues–I think correctly–that McKitrick and McIntyre are simply confused: the normalizations diminish the influence of series that show a recent uptrend.
But Connolley argues”¢’¬?I think correctly”¢’¬?that McKitrick and McIntyre are simply confused: the normalizations diminish the influence of series that show a recent uptrend.
Connolley re-visited the matter in more detail a few days later:
Err… well there you have it. If I’m right, M&M are wrong, at least for this part of their argument. So what is M&M’s mistake? M&M think that they are right, which is unsurprising. To be fully convincing, one would have to find the error in their work. They claim to have done extensive monte-carlo simulations of blah wibble (thanks to Ian R). But they haven’t put up their code, so we can’t go through it (and remember folks, McK confused degrees and radians before! (Thanks Tim L)). And anyway who has the patience? Update: they *have* put up their code (thanks McI).
realclimate
However, these criticisms were muted as compared to Mann’s post here at realclimate in January 2006.
Here, however, we choose to focus on some curious additional related assertions made by MM holding that (1) use of non-centered PCA (as by MBH98) is somehow not statistically valid, and (2) that "Hockey Stick" patterns arise naturally from application of non-centered PCA to purely random "red noise". Both claims, which are of course false, were made in a comment on MBH98 by MM that was rejected by Nature , and subsequently parroted by astronomer Richard Muller in a non peer-reviewed setting–see e.g. this nice discussion by science journalist David Appell of Muller’s uncritical repetition of these false claims. These claims were discredited in the response provided by Mann and coworkers to the Nature editor and reviewers, which presumably formed the primary basis for the rejection of the MM comment. …
So the facts deal a death blow to yet another false claim by McIntyre and McKitrick. Despite the plain facts, as laid out here, however, their false claims have nonetheless been parroted in op-ed pieces of dubious origin and other non-peer-reviewed venues. One of the primary missions of "RealClimate" is indeed to expose the false, disingenous, and misleading claims often found in such venues.
In another contemporary realclimate article, they accused Muller of not just "parroting" our findings but "scurrilously parroting" those findings. I thought that "The Scurrilous Parrot" would be a good name for a sailboat or a pub.
The blog comments to the Mann posting were interesting as well. Dano weighed in right away congratulating Mann for delivering this "death blow". Here’s another comment and reply:
All of this technical, statistical jargon is over my head, but I get the impression that the data on which the climate reconstruction is based is so sparse and uncertain that you can’t draw any firm conclusions supporting either MM’s or Mann’s side of the debate.
[Response: Even without technical training or a statistical background, you should have an adequate basis for discerning which of the two parties is likely wrong here. Only one of the parties involved has (1) had their claims fail scientific peer-review, (2) produced a reconstruction that is completely at odds with all other existing estimates (note that there is no sign of the anomalous 15th century warmth claimed by MM in any of the roughly dozen other model and proxy-based estimates shown here), and (3) been established to have made egregious elementary errors in other published work that render the work thoroughly invalid. These observations would seem quite telling. -mike]
The "egregious elementary error" linked to another realclimate post in which Mann said (using MM04 here for Michaels and McKitrick – but with the obvious implication that I’d been involved in the radian-degree error. They said there, linking to Tim Lambert:
Perhaps even more troubling, it has been noted elsewhere that MM04 confused "degrees" and "radians" in their calculations of areal weighting factors, rendering all of their calculations incorrect, and their conclusions presumably entirely invalid.
NAS Panel
So what did the NAS panel say about the bias in Mannian principal components:
McIntyre and McKitrick (2003) demonstrated that under some conditions, the leading principal component can exhibit a spurious trendlike appearance, which could then lead to a spurious trend in the proxy-based reconstruction. To see how this can happen, suppose that instead of proxy climate data, one simply used a random sample of autocorrelated time series that did not contain a coherent signal. If these simulated proxies are standardized as anomalies with respect to a calibration period and used to form principal components, the first component tends to exhibit a trend, even though the proxies themselves have no common trend. Essentially, the first component tends to capture those proxies that, by chance, show different values between the calibration period and the remainder of the data. If this component is used by itself or in conjunction with a small number of unaffected components to perform reconstruction, the resulting temperature reconstruction may exhibit a trend, even though the individual proxies do not. Figure 9-2 shows the result of a simple simulation along the lines of McIntyre and McKitrick (2003) (the computer code appears in Appendix B). In each simulation, 50 autocorrelated time series of length 600 were constructed, with no coherent signal. Each was centered at the mean of its last 100 values, and the first principal component was found. The figure shows the first components from five such simulations overlaid. Principal components have an arbitrary sign, which was chosen here to make the last 100 values higher on average than the remainder.(86-87)
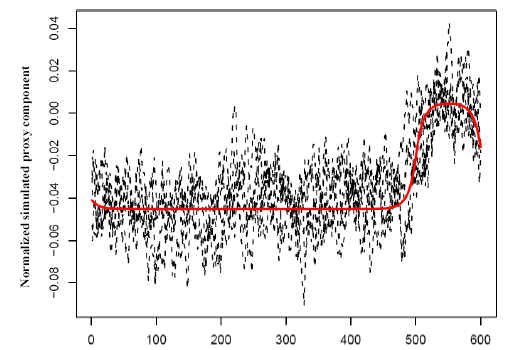
NAS Figure 9-2
We’ll forgive them for the incorrect citation – the point was made in our 2005 article. The earlier article noted "incorrect principal components" calculations in MBH, but was unable to diagnose the exact reason. The NAS Panel didn’t just devote a couple of sentences to the matter. They included a diagram showing simulations, not dissimilar looking to simulations that we’d previously shown, and even included source code for the simulations. (Dare we take some reflected credit for the NAS Panel including source code in a report? I wonder if any other NAS report has ever done this.) I guess someone on the panel was intrigued by the effect.
Again, the issue of whether this "matters" to MBH98 is different and I’ll analyse this issue separately. But I think that it’s fair to say that, on the specific question of whether the biased MBH methodology exists, the NAS Panel has found against Connolley, Lambert, De Long, Annan and Mann and in favor of us. I don’t believe that committees can determine "truth"; however, they can advise on a "consensus" and we can now say that the "consensus" on this issue is now against Mann and his associates on this one issue.
It’s amazing to look back and see the venom of the attacks by Mann and his sympathizers and exactly why I had to take up blogging (at John A’s timely suggestion) to prevent my reputation from being totally destroyed. Unfortunately, most climate scientists appear to have acquired their view on these issues through realclimate but even climate scientists may be vaguely aware that there are some issues.
PS: I’m not holding my breath for Mann to issue a Corrigendum on the above post (or Connolley or De Long for that matter.)
More on other NAS Panel findings in the next few days.


41 Comments
I thought of the red noise point the second I read that in the NAS panel report.
When you dig into the NAS details, there is more than a little M&M therein.
Their report might be “nice” but it is on the edge of becoming plagiarism. 😉 I am sure that this is temporary because if their observations become mainstream within climate science, I can’t imagine that they would cite (just) them for it because everyone knows that it was in M&M.
Blogging has certainly levelled the playing field in quite a few cases including the work of Steve McIntyre. In a way this has surprised even me, because I did not have the benefit of foresight into how a slow and meticulous examination of the evidence in full view of the Internet could have such farreaching consequences.
It’s interesting to note that as blogging has risen almost in tandem with a decline in the popularity and importance of Usenet. I’m not a sociologist so I don’t know what that means, but I find that specialist blogs in fields of interest are more informative than unmoderated shouting matches, even if I disagree with some of them.
I’d have to agree although I doubt that they’ll ever give it up completely when backpeddling can achieve so much. You have to be grateful that they put their opinions in visible, searchable form which is much easier to reply to than the Internet chinese whispers game of “friends close to Michael Mann say…”
I agree that the acentric method creates a PC1 that is more HS-shaped than otherwise. However, does it make the entire PCA (if you retained all the PCs) more HS-ish? In the actual regression, how much impact (numerically) on HS index comes from this acentric method. I ask this because the retained higher numbered PCs will dilute the effect of the PC1 (and might even do it extremely dramatically…I don’t know). Also of course the PCs are just one part of the overall reconstruction, so there is definite dilution going on.
Another thing. In addition to being confused/concerned/unproven to on the issue of using PCA to estimate behaviour vice an average, I also wonder if you DO use PCA, why do you:
1. Weigh the different retained PCs equally?
2. Combine with non-PCs?
The whole thing seems like a mishmash without a justification for the procedure.
Dear Climate Audit,
Good balanced article on NAS report at TCS Daily: “The Real News About Mann-Made Global Warming”
Got to love Connolly’s quote here:
“They claim to have done extensive monte-carlo simulations of blah wibble (thanks to Ian R). But they haven’t put up their code, so we can’t go through it.”
So Mann can go years without releasing code and nobody says a word, yet Connolly almost immediately notices MM don’t have code available (which was subsequently quickly provided by SteveM, while Mann dragged his feet for a few more years)?
I don’t quite care for the NAS statement – too vague and nice:
“McIntyre and McKitrick (2003) demonstrated that under some conditions, the leading principal component can exhibit a spurious trendlike appearance, which could then lead to a spurious trend in the proxy-based reconstruction…”
I have to love Mann’s response to the RC poster: “Even without technical training or a statistical background, you should have an adequate basis for discerning which of the two parties is likely wrong here.” Was he being serious with that?!?!?
The easy “defense” to this – which would be bought hook-line-and-sinker at RC – is “NAS is speaking generally and doesn’t mention MBH98. Note they said under SOME conditions, those conditions not being relevant to MBH98 and only particularly occurring when improper MM methodology (different than the proper MBH98 methodology) is used.” And, of course, they’ve “moved on” to RegEM.
#4. TCO, in the empirical situation of MBH, the North American PC1 plus white noise gives essentially the same result as the North American PC1 plus actual proxies (or for that matter, Tech Stocks plus actual proxies or Tech Stocks plus white noise). Fully explaining the phenomenon is different from observing the phenomenon. I think that the explanation rests along the lines of the Phllips article citedi n Reply to Huybers #2.
#7. I’m pretty sure that I’d posted up the code prior toConnolley’s comment, he probably hadn’t tried to locate it, certainly hadn’t contacted me.
An honest scientist must admit when they are wrong. So far the silence from these guys has been deafening.
Steve, how about posting up Figure 9-2 from the NAS Report, while we’re at it. And the rest of the paragraph on page 86, which addresses the issue of PC’s having no inherent orientation, a point that Ritson got so mad at us for making (though like W&A he couldn’t get his comment into print at GRL).
By the way, I just noticed that, on page 87, discussing Huybers argument about correlation PCs, they say “In this case, an argument can be made for using the variables without further normalization.” — i.e. using the covariance matrix rather than correlation matrix. But they also add that a decision on whether to equalize variances should be based on scientific consideration of the climate information in each proxy. A bit of a 2-handed answer, but they do indicate that there’s no presumption in favour of mechanical application of correlation PCs.
In my own academic dealings during my reckless youth, I got at least a sense of the dynamics and university staff politics that might at times seem to take center stage ahead of the grunt work at hand. But I must admit to being quite shocked by the degree to which Mann in particular, others at RC and some who dwell there (Dano being the prime example) completely ignore their own base of skills and knowledge and blatently set forth rubbish. It would be one thing if Mann was trained in the soft sciences (or non sciences) and therefore had somewhat of an excuse for doing so. But the guy has the PhD extension of the same exact training I’ve had, and I do mean truly exact in terms of part of it, we are both examples of those who have been through the U of Cal system. So, how is it that a guy who does indeed know the basic physics, and fully understands biases, at least basic stats, and the like, could so blatently issue rubbish and expect to get away with it?
Steve: your reply to me was overly couched and not directly responsive. We’ve been round this bush before. I want to know how much the final DAMN hockeystick differs if we change the CENTERING convention. If you can’t put a number against it, it’s not science. If you can put a number and refuse to, you’re an advocate not a scientist. If you continue to overstate cases, conflate issues and make selective points, I will continue to watch you like a hawk and cry foul.
On the Mannian response. Even if they are right, that the acentric method did no damage in MBH98, they still need to (1) acknowledge that it is wrong as a method and (2) make the assessment of how much it changes things mathematically.
One thing which strikes me on reading the ‘internet responses’ above is the common style of the language used. The indirect references to supposed facts, the implcation that if the reader does not understand then it is the reader who is at fault. It reminded me of this puzzle . Such logical falacies are aparantly something which are taught in schools in the UK nowadays – which came as quite a suprise to learn! I don’t believe that this points to an intentional desire to mislead, but it’s still interesting…
Steve: The venom of the attacks by famous scientists, and the lack of substance in those attacks is what attracted me to this blog and quickly convinced me that you really had something to say.
re 13: Would you be more explicit. What does “indirect references to supposed facts, the implcation that if the reader does not understand then it is the reader who is at fault.” mean? I know I’m a little dense, so help me.
# 10. Done in part. I’ve noted up their favorable comment on the covariance/correlation PC issue and was going to treat it separately.
Sean, your puzzle was interesting, though they missed a few of their own fallacies. There’s at least one argumentum ad populum(i.e. the bandwagon), one ad-hominem (he’s a drunk), and a few others if you dig! 🙂
Mark
RE: #13 – doesn’t speak well of US schools either, which Mann is a product of. This is particularly disturbing to me. There was a time when in America, we could count on a certain degree of healthy naivete, on an innately optimistic (admittedly at times, overly optimistic) view of the future, and on an innate aversion to the darker side of Machiavellian comportment. But no more. On the one hand, it guess it means we are “mature” along the lines of “Old Europe” – on the other hand …. well, I’d rather not think about it at the moment.
Let me point out -again- that the NAS report was NOT just a report on the Mann et al dendro reconstructions.
Reading many of the responses here, and some of the cited articles (the Spencer article at TCS stands out) one gets the impression that the only available evidence was the Mann reconstructions, and that the NAS report’s criticisms of that method and conclusions means that all AGW evidence is invalid, that there is NO remaining evidence for anything unusual happening in the late 20th century, and that the AGW hypothesis is cut off at the knees (note that these are three separable things). This is simply not true.
In fact, they spend quite a lot of effort in discussing other kinds of evidence outside of dendrochronology, some supportive and some inconclusive for the AGW hypothesis, and for commentators to act as if those parts of the report dont even exist is as tendentious as what many of y’all are accusing the “warmers” of doing.
Re #19 – Surely you can understand why Mann’s works get the most emphasis here?
SteveM touched on many other facets of the NAS report http://www.climateaudit.org/?p=715 . I wouldn’t be surprised if he expands on some of those items later in individual threads.
re 20.
Sure, Michael,of ocurse. And I don’t mind that – although I do think some care needs to be made at least on occasion to keep the context clear. Its when the comments imply expansion of that to the larger question that I get perturbed. In this thread, it was specifically post 6, and the approving cite of the Spencer piece, which strongly implied that the evidence *in general* was cut off at the knees, that triggered this coment.
RE: #19 – Regarding “other evidence”
1) The surface record – A highly discontinuous, non quality controlled, Western Europe – Eastern North America biased, arthropogenic energy dissipation, arthropogenic land use modification influenced metric. An in depth agnostic study of it and its skill, while supremely boring and unglamorous, would be in order. As a related project, efforts to do a much better job of modeling aforementioned arthropegnic effects.
2) Tropical glacier recession – nice precipitation proxy. So, therefore, study what if anything the delcines in precipitation in mountain areas of the tropics means. We honestly don’t yet know what it means.
3) The high altitude record – well wait, that record seems to be in conflict with the Hockey Stick
4) Mid latitude alpine glacier recession – could mean arthropogenic incremental warming above and beyond natural trends, or, could be a simple indicator of the ongoing momentum of exiting the LIA
5) Polar Sea Ice – show me the skill in the measurements. I am very concerned that we don’t really understand how to measure sea ice extent, even today, with the help of satellites. And of course, anything prior to the satellite era is highly suspect.
Anyone else have anything to add about “other evidence?”
Lee: For the record, I don’t think the NAS Report “cut AGW off at the knees.” But it did decrease the amount of “evidence” for it. Moreover, if the other “spagetti graphs” are as flawed as Mann’s (which is very probable), then there is even less evidence that the modern warm period is any warmer than the Medieval WP. What other studies indicate otherwise? I just don’t think we know what’s going on for sure.
#19. Lee, I intend to consider all such aspects of the report. You will forgive me if I start with sections where they address topics direcly pertinent to our past work. You’ve probably got a general idea on my views of the “other” multiproxy studies. Some of the glacier arguments are different again and require their own analysis.
Again, I do not say that any of this “disproves” AGW. Sometimes I’ve seen arguments to the effect that if the HS is wrong then things are worse than we thought. If this is the case (and I’m not convinced that it is), this hardly vindicates Mann. What kind of “vindication” arises if climate models have been tuned incorrectly. If the situation is worse, we should know. All the more reason why data and methods should be openly available.
BTW, Lee, my personal interest (and only area of expertise) in all this concerns tree rings. I have maintained all along that it is not feasible to use them as temperature proxies, and I think I have been proven right, so far. There may be some trees out there that would show temperature trends, but I don’t think there is any way to know which ones they are.
Lee, the “cut AGW off at the knees” is arguably appropriate in response to Mann’s hockey-stick being called the “smoking gun.”
Accurate? I’d say no. But appropriate in that context? Yeah.
re 22.
Steve, I have to dive back in to work; I’ll only comment (too) briefly here on your point 2, regarding tropical glaciers.
First glaciers are proxies for BOTH precip and temp. A primary precip influence has been strongly implicated (but is not rock solid) for Kilamanjaro, but my understanding is that many of the south american tropical glaciers are showing evidence of increased precipitation, even as they are retreating. Tropical glaciers are retreating worldwide, nearly uniformly – to attribute this all to precip effects requires one to postulate a coordinated worldwide decrease in tropical rainfall at all glacier accumulation zones. I don’t have time to look for the evidence right now, but my understanding is that this is not what has been observed.
I ahve also read claims that one can distinguish between glacial retreat due to changes in the accumulation zone and changes in the dissipation zone, by obeerving changes in the glacial thickness, for example, and that these changes are consistent with retreat “from the bottom up” as it were – but this is a claim I havent followed up.
There are other pieces of evidence too. If the “ancient sub-glacial plants” find holds up (I want to see the evidence that those plants were actually growing there), that is strong evidence for something unusual happening now. The observed destruction of annual layering by recent surface melt in the accumulation zone of one of the glaciers, not observed anywhere else in the core, is also strong evidence for recent anamolous temperatures at that altitude in the acumulation zone at that glacier. Given the stable vertical temp profile in tropics, this assumes additional significance.
And, the NAS report notes that the 20th century dO18 record in the tropical cores is anomalous. In tropical glaciers this can’t separate temp/precip effects but they do say something is happening to tropical climate that is outside previous known bounds.
re 27 : Steve Sadlow, not Steve Mc. I’ll learn…
I think you know better than most that “proof” in the world of scientific study, particularly when dealing with statistical analyses, is almost never acheived. Rather, the goal is to provide enough evidence to make a hypothesis into a theory that can be reliably trusted. Lack of an HS removes the primary piece of statistical evidence connecting warming to anthropogenic sources. As noted, this does not necessarily say the A should be removed from the context of GW, just that relyiing on the HS to “prove” the A is unreliable.
Mark
BTW – RE: #22 – If, after issues related to the quality of the measurements themselves have been resolved, and either the measurements shown to be relevant, or, somehow corrected for biases, the measurements still show warming, then of course, the thing I mentioned wrt alpine midlatitude glaciers would apply to any measurement. The question of the day is, if and only if there truly is century or millenneum scale warming, is it simply the momentum exiting the LIA, is it arthropogenic, or both? If there is a significant arthropogenic component of the warming, how much of it is due to GHGs, how much of it is due to plain old arthropogenic energy dissipation and how much due to land use and vegetation modifications. These last items of course overlap into the misnamed “UHI” debate. I say that “UHI” is misnamed because arthropogenic energy dissipation and arthropogenic modifications of land use / vegetation are certainly not limited to urban areas, they are ubiquitous whereever there is human settlement, agriculture, roads, and pastoralism. Consider also large scale mining, flood controls and managed forestry as well.
Re#19
A graph of surface temperatures in the Sargasso Sea over 3000 years based on marine sediment analysis (Kegwin, L. D. (1996) Science 274, 1504-1508;) does justice to both the MWP and LIA and is sometimes cited by AGW skeptics (John Daly)(Robinson et.al; Oregon petition). How good is this proxy? And does it correlate with any other better proxies or with solar irradiance data. Just curious.
S. Sadlow,
In that other thread, I had mentioned the Trinity Alps glaciers in Northern California, and that I had understood they were gone. You said that no, they were growing.
Turns out we were both wrong. Apparently one of three has disapeared since 1900, and the other two have shrunk 10-20% over the last 50 years. He seems to be claiming a rise in the equilibrium line elevation, and positing an increase in precip to offset that, but the evidence isnt presented here.
—
http://gsa.confex.com/gsa/2005CD/finalprogram/abstract_85221.htm
Paper No. 31-8
Presentation Time: 4:00 PM-4:20 PM
RECESSION OF MODERN GLACIERS AND POST-LAST GLACIAL MAXIMUIM GLACIAL CHRONOLOGY IN THE TRINITY ALPS, CA
HEERMANCE, Richard V., Geological Sciences, Univ of California, Santa Barbara, 1006 Webb Hall, Santa Barbara, CA 93106-9636, richard@crustal.ucsb.edu and BRIGGS, Richard, Center for Neotectonic Studies, Univerity of Nevada, Reno, Mail Stop 169, Reno, NV 89557
The presence of active cirque glaciers below 2743m (9000 feet) elevation in the Trinity Alps of northern California has been reported for over a century (Hershey, 1900; Sharp, 1960). We combine mapping and historical airphoto interpretation to show that only 2 of 3 glaciers that existed in 1900 remain, and that the remaining 2 glaciers have decreased 10-20% in area over the last 50 years. The remaining glaciers are located on the northern flanks of the highest peaks (Thompson and Caeser) in the range and cover ~5 hectares (1 hectare=10,000 m2) each. The active nature of the glaciers is reflected by extensive crevasses across the blue-ice. Each active glacier is associated with a series (3-4 each) of well-developed moraines. Relative dating techniques (e.g. soil development, stratigraphic position, geomorphic form) suggests that the youngest moraines record the timing and magnitude of multiple late Holocene glacial advances. The active cirque glaciers document a present-day equilibrium line altitude (ELA) of à⣃¢’¬°à’ 2500m (8200 feet) for the Trinity Alps. A rise in present-day ELA in the Trinity Alps is in accord with similar observations in the Sierra Nevada but at odds with ELA depression reported for nearby Mt. Shasta, underscoring the complex local response to broader patterns of climate forcing.
Cordilleran Section – 101st Annual Meeting (April 29–May 1, 2005)
Briggs conflicts with something he reported earlier directly to the UCSB Geology Newsletter. In that earlier report, he said they were actually growing. But in any case, there is still a lot of ice up there, it’s definitely not gone.
I meant to write Heermance … not Briggs. Brain fart … 😉
31: Here’s some relationships.
BTW, Steve M., I sent you a copy of Loehle’s paper which is summarized in the link posted above. Never heard anything from you…
Re: 19
But it is true the information being released to “civilians” via the MSM is skewed in favor of Hockey Stick world not the other way around. This NAS report IS one of the first “official” anything I’ve seen that speaks with relatively no “spin”. And that’s not saying much.
Do you deny that fact?
This is an article sent to me by a friend, who is a highly experienced, Phd et al gentleman (NASA, rockets, laser, etc), and a Maui resident, who attaches pictures of polar bears frolicking in the snow with all his emails. LOL
From Canadian free press article 6-24-06 :
Currently both Time Magazine and ABC news are embroiling themselves in the creation of further global warming hysteria.
Time Magazine is claiming, “The crisis is upon us”. In a special report on the climate Time claims, “The climate is crashing, and global warming is to blame.” The magazine then goes on to blame it all on Bush and the Republicans. Quoting from studies cited in Science magazine, Time claims the polar ice caps are melting at an ever-increasing rate and predicts that ocean levels will rise by 20 ft. by the end of this century and swallowing Florida and Bangladesh in the process.
What Time Magazine fails to include in their story of doom and gloom is the mountains of evidence that counters their claim. But then, it would be asking too much of Time to provide their readers with a fair and balanced report.
ABC news has gone so far as to ask for anecdotal evidence of man-made global warming from the public at large on their web site. This on the first full day of summer!
“Has your life been affected by global warming?” ABC’s web site asks, and then goes on to urge people to write in their anecdotal stories about how their life has changed due to global warming. This type of “journalism” is the best we can now expect from the former mainstream media, most of which seems to have bought the global warming story hook, line and sinker. What’s worse, the media is now making itself part of the story by shaping the news it reports and carefully tailoring information to suit its agenda.
http://tinyurl.com/kvzy3
(Steve if this article is too political, please delete the link for me. I only cut and pasted a portion of it. thank you!)
I recommend that everyone read this paper: Loehle, C. 2004. Climate change: detection and attribution of trends from long-term geologic data. Ecological Modelling 171: 433-450. It provides the most sensible reconstructions I have seen and shows very high correlations of the reconstructions to known solar cycles. The Roman Warm Period, MWP, LIA, and Modern Warm Period are clearly shown. And it is not “contaminated” by the SAT data (although it “predicts” modern temperatures reall well).
Dear Steve, you should write a book about it. It would need some chronology, organization etc.
#30 — “is it arthropogenic, or both? If there is a significant arthropogenic component of the warming,…”
Arthropogenic, Steve? 🙂 That would be warming caused by crabs, lobsters, and other arthropods? Must be frictional heat, what with all that scuttling about. Could they be the source of Tim Barnett’s ocean warming?
Sorry to chuckle, but sometimes little typos can accidentally lead to very humorous imaginings. Anthropogenic — originated by anthropos; apes like us. 🙂
RE: #40 – w/ CC to Armand (cheers!) – guilty as charged. This is right up there with “the Calistoga of Sarifornia” – LOL. Bit of a story behind this …. as an 8 year old lad, was reading my parent’s books for ARchealogy and ANthropology courses. Has one of those juvenile brain farts and once blurted out “ARthropology” in some setting. Dang, it must have burned into the non volatile part of the main memory banks! 🙂