Posted for bender.
bender writes:
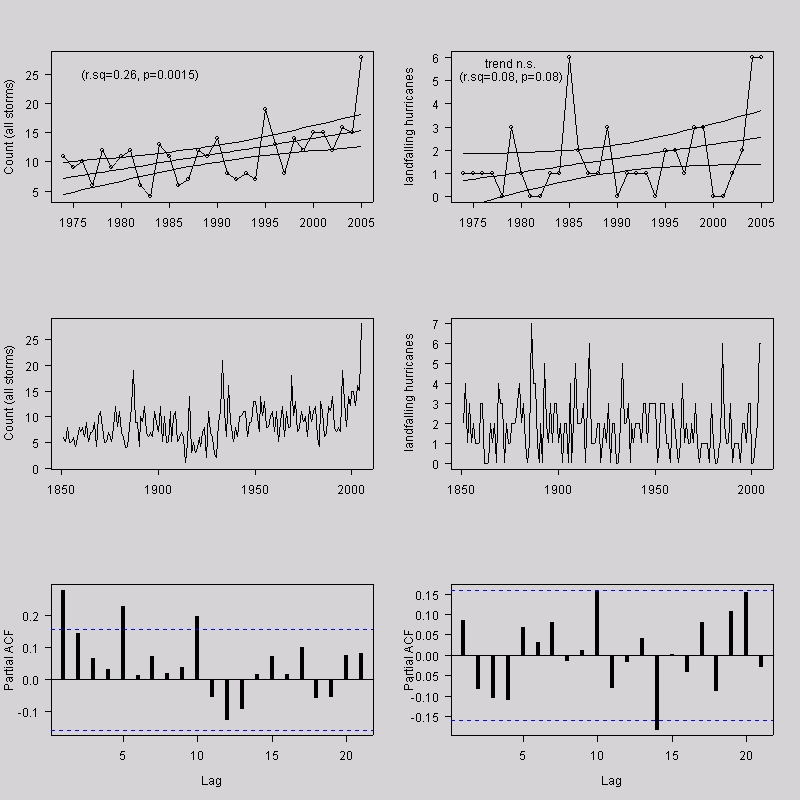
Attached are analyses of Willis’s landfalling hurricane data in post # 35. Interesting facts:
1. 1974-2005 trend is "n.s." (Note 95% confidence intervals now present.)
2. PACs for lag 10 and 20 are marginally significant. (Recall that for total # hurricanes lag 5 and 10 were sig. It is as though NAO affecting sea storms is operating on a 5y time-scale and continental high (blocking effect from decadal/bidecadal solar cycle?) is operating on a 10/20y cycle. Not sure if this has been noticed in the literature because I don’t read that literature. But I know that continental drought in the US is weakly forced by the 11/22y solar cycle, so why not the process of hurricane landfall? (i.e. You take your pick: hurricanes in 2005 are the ultimate solution for droughts in 2001-2003!) Note how this fits nicely with your "persistence" theory!


559 Comments
The landfall counts are nearly perfectly consistent with a Poisson process with a constant arrival rate. This seems odd; I would have expected that the arrival rate would be proportial to the number of North Atlantic hurricanes, but that does not seem to be the case. Is there some explanation for this? Judy Curry (#110 in previous post) may have touched on this issue:
but I found this explanation more confusing than enlightening. Perhaps the BAMS article (I have not re-read it) explains everying.
In any case, I am still surprised that the landfall data exhibit no trend or interesting time series structure (aside from the tiny blip at lag 14). The data seem almost “too good to be true” (#73 in previous post).
bender, if you ever have spare time to look at something, and you have access, perhaps you could review the linked paper.
It is a recent paper by Mann and Emanuel. They apparently had to eliminate some data due to aerosol cooling from 1950-80, and do some kind of statistical contortions in order to reach their conclusions.
link
Re #2
By the way, discrediting the AMO (Atlantic Multidecadal Oscillation) is to Atlantic hurricane climatology as descrediting the MWP and LIA is to global temperature climatology. It is a big deal. As I read it, Mann and Emanuel say they’ve done it, via statistics and data sorting.
I have a long post at Volokh.com that finds some errors in the latest BAMS paper on hurricanes and global warming.
Although I found the paper mostly persuasive that there had been a very large increase in category 4 hurricanes since 1970 (with drops or no change in the other categories of hurricanes), I see three problems with the paper.
First, the paper dismisses concerns that the choice of 1970 as a starting point may give a misleading account because of the evidence that there was global cooling from 1940 to 1970. They treat this legitimate concern as a logical fallacy, but they never explain coherently what’s fallacious about potentially choosing start or cut-off dates that are unrepresentative of larger trends or that give misleading measurements of the strength of any overall trend.
Second, if the authors actually did what they report having done with their data, then the BAMS paper should never have been published. In two charts showing the main hurricane trends, they report the data in five year periods, except for 1994, which is included in two periods, 1990-94 and the six-year period 1994-99. This may be just a typographical error, but they make this error three times in the paper (in most of the most important charts). And exactly the same error appears in another paper they published in Science in 2005 using related data, so it may well not be a typo. If these are not merely typographical errors, and they did what the article reports that they did (i.e., double counted 1994 hurricanes), then the paper should never have been published.
Third, although the article ended with a substantial discussion of responsible argumentation over the issue of hurricanes and global warming in the mainstream press, as an apparent model they pointed to their own public commentary:
Just to remind people: Katrina was a category-5 hurricane at its peak, but it was a category-3 hurricane when it hit the Gulf Coast, and it was only a category-1 hurricane at New Orleans (95 mph), though it was just below the threshold for a category-2 hurricane. The damage at New Orleans probably occurred, not because it was such an unusual hurricane but because the levees were in appalling condition.
But the data presented in the BAMS paper show what looks to be a very small and statistically insignificant rise in category-5 hurricanes from 1970 through 2005 (these data include some Pacific as well as some Atlantic hurricanes). The big increase shown in the BAMS paper is almost a tripling of category-4 hurricanes; other classes of hurricanes seem to show significant drops or no significant changes.
A 2005 Science article co-authored by the same group as the BAMS paper–Webster, Holland, Curry, & Chang, “Changes in Tropical Cyclone Number, Duration, and Intensity in a Warming Environment”–does look at Northern Atlantic hurricanes 1970-2004 separately from Pacific ones, but lumps category-4 and category-5 storms together, showing an increase for the combination, not reporting anything on category-5 hurricanes alone. I went to the data source cited in the 2005 Science paper and this is what I found for 1960-2004 hurricanes (the Science study covered 1970-2004, excluding the first two rows below and the 4 category-5 hurricanes that occurred after the period of their data, in 2005):
Category 5 Hurricanes in the North Atlantic:
1960-64 . . 4
1965-69 . . 2
1970-74 . . 1
1975-79 . . 2
1980-84 . . 1
1985-89 . . 2
1990-94 . . 1
1995-99 . . 1
2000-04 . . 2
As you can see, in the data they claimed to have used in their Science article (as I counted the events), there is absolutely no trend in category-5 hurricanes in the period of their study: 1970-2004. Indeed, the 1990s showed insignificantly fewer hurricanes than either the 1970s or 1980s. Thus, all of the increase in the North Atlantic category 4-5 storms reported in the 2005 Science article must be due to an increase category-4, not category-5 storms.
Neither paper reports any data that would show a statistically significant increase in category-5 storms that would form the scientific basis for their public claim, made along with their release of the 2005 Science article: “The southeastern U.S needs to begin planning to match the increased risk of category-5 hurricanes.”
What increased risk?
If they have the data to support that claim, they should make it public. Anyone reading that claim would think that their Science paper showed such a significant increase. But it didn’t. Even after I added the 2005 data on category-5 hurricanes, which they did not use because the season wasn’t over yet, the quick regressions I ran didn’t show any statistically significant increase in category-5 storms.
Did they just fabricate this claim of “increased risk” of category-5 storms?
If they don’t have such data”¢’¬?-and it appears that they don’t”¢’¬?-then it’s irresponsible for a scientist to imply a scientific basis for such a fear-inducing claim released along with a scientific paper. And it’s particularly odd that the authors of the 2006 BAMS paper actually discuss and criticize the mainstream press for poor environmental reporting that gives too much weight to critics of the environmental orthodoxy. The authors tell us that their scrupulousness put themselves at a disadvantage in public debate because they restricted themselves to making claims that were supported by peer-reviewed articles and data. Yet their own peer-reviewed data would seem to me to show that they had no scientific basis for saying that “The southeastern U.S needs to begin planning to match the increased risk of category-5 hurricanes.”
Bottom line:
1. The new BAMS article shows persuasive evidence of a huge jump in category-4 hurricanes 1970-2004, but declines or flat trends in the numbers of stronger and weaker hurricanes.
2. The BAMS article does not deal adequately with whether its choice of a relative cool period (1970) as a starting time influenced the results.
3. In both their 2005 Science article and their 2006 BAMS article, the authors appear to double count data from 1994, but it may just be the result of repeated typographical errors in both journals.
4. In the BAMS article, the authors criticize others for irresponsible public statements on global warming and praise their own caution, yet the press release they quote asserts an “increased risk” of category-5 hurricanes threatening the southeastern U.S., but neither their own two articles, nor the data they claim to have used, show any such statistically significant trend.
5. If the quality of peer review and editing in this field is only as careful as it seems to be on the BAMS paper, then I think it prudent for educated lay people to continue to be skeptical about the research and public assertions of climate experts, especially those who tell you to just trust them or who insist that they are just relying on what their data show. Wouldn’t expert reviewers of the BAMS paper already know that there had been no increase in category-5 hurricanes in the North Atlantic, and thus that the public statements that the authors proudly trumpet were irresponsible? Certainly, this brief foray into the literature leads me to be less confident of the conclusions of climate researchers, no matter how fervently they are asserted.
If you google paleohurricanes or paleotempestology, you can find some interesting thoughts on hurricanes in the past. At the CCsp workshop last November, the most interesting presention iMHO was by Liu who said that the last millennium had had anomalously low hurricane levels in the last 5 millennia (using sand deposits in coastal marshes and lagoons as a proxy as a I recall).
Here is my take on the debate:
* both the skeptics and warmers (Emanuel) say there is no long-term trend in tropical cyclone numbers. Worldwide, the annual number of cyclones continues to be ninety, give or take ten.
* the skeptics say that the intensity of storms is rising as sea surface temperatures rise. They use data from the last fifty or so years to support their position
* the warmers, especially those closest to the data collection (Gray, U.S. Tropical Prediction Center scientists) say the older data is flawed
* the warmers dismiss Gray and the TPC skeptics as “non-theorists” (DRS note: the issue seems to be data collection, not theory, so protests about people being non-theorists seems odd)
* the key metric is ‘power dissipation index”, which I believe uses storm velocity cubed and duration. (DRS note; if you take a data flaw and cube it, you get a much bigger flaw. Data purity is important.)
* the warmers say that, as sea surface temperature rises, storm power rises, and the historical data show increasing power, which matches rising sea temperature.
* the skeptics say that the early data, especially outside the Atlantic, tended to mis-estimate the strength and duration of earlier storms. GI, GO.
* the skeptics’ Atlantic data shows a multi-decadal oscillation (see Willis’ power dissipation chart on the other bender thread, #36 I think), with peaks roughly around 1890, 1930 and 1960. They believe we are currently in a busy part of the cycle, which began about 1995.
* the warmers seem to not believe in the oscillation (see Mann and Emanuel 2006) and instead, once data is filtered and statistically treated, the oscillation disappears and is replaced by (my guess, having not read the paper) a hockey stick.
* this question of the existence of the oscillation seems to have political implications. If the (apparent) Mann/Emanuel hockey stick is true, then those in the Atlantic basin (UCS, Canada, Europe) better do something about global warming or be blasted by greater storms.
* however, if the have been as-stormy periods in the past, and the Atlantic basin has survived before, then the political urgency drops.
Steve B., Peter H., Wiiis, bender, others, have I misstated anything? I’m just trying to summarize things in my mind.
Thanks
-Warmers are afraid of statistics that quantify the degree of uncertainty, and actively seek to suppress that information in scientific documents fed to policy people, in order to grease the wheels of an activist agenda
-Skeptics want policy to be made in light of the facts about uncertainty – uncertainty about temparautre trends, hurricane trends, CO2 sensitivity coefficients, the entire functioning of earth’s climate system, etc.
Speking of which, I haven’t received any response from Webster about the French thing. Maybe Ritson could help.
re #6.
Warmers desperately want to link extreme weather events to AGW, but I read somewhere that if the planet warms, the temperature differential between the Earth’s poles and equatorial regions will drop, resulting in weather that is more tranquil overall. Sorry I can’t provide any refernces, but does anyone know about this theory and any support that it might have historically?
I took a look at Emanuel’s (warmer) publication list, looking only at his work on tropics-related topics. I counted 45 publications, more or less, in his 25 year career.
I took a look at Landsea’s (skeptic, at least on tropical cyclone intensity and AGW) publication list, which is all tropics-related. I counted 53 publications, more or less, in his 15 year career.
The pedigrees, for whatever they are worth, look about even.
First-time poster, long-time reader of this site. Emanuel published a brief overview of the physics behind the link between hurricane wind speed and sea surface temperatures in the August, 2006 issue of Physics Today, “Hurricanes: Tempests in a greenhouse.”
http://www.physicstoday.org/vol-59/iss-8/p74.html
He presents an elegant argument, using a Carnot cycle analogy, to derive the maximum wind speed v as
v^2 = (Ts – To)/To * E,
where Ts is the ocean temperature in Kelvin, To is the temperature of the outflow (=200 K or so, according to Emanuel), and E is a parameter that accounts for the thermodynamic disequilibrium between the ocean and the atmosphere. If E remains constant as Ts is increased by 1 degree C, then the wind speed will increase by about 0.5%. My conclusion is that, while there is solid physics to support the connection between higher wind speeds in hurricanes and increased SST, the all-important magnitude of the effect is probably not measurable with existing hurricane diagnostics. Has Emanuel addressed this?
Re #11: I’m sure Bloom will have an answer shortly. I don’t.
#5 SteveM, I’m not at all surprised by your report that
“Anomalous” has become a touchstone for me. The word shows up often when (honest) earth scientists describe — usually with some embarrassment — carefully collected data on natural processes. It typically refers to some “statistically significant” but inexplicable artifact in the error structure of the data. While such artifacts are often interpretable as a trend or a period of extended excursion from the mean, many scientists have come to believe they represent something else, a truly deep and fascinating aspect of Mother Nature. Though a complete physical explanation for this phenomenon is lacking, it has been observed so frequently that it is hard to deny.
“Long-memory” (LTP, etc.) stochastic processes can provide a realistic model for the “noise” associated with these phenomena, and LTP models might be able to provide a reasonable framework for computing statistical significance. However, they do not directly answer the deeper, really interesting, questions: What is really going on? Why do natural processes exhibit behaviors so close to chaos?
What’s worrisome is when “scientists” try to remove these “blemishes” from their data. Sometimes they eliminate the offending data points altogether, usually mumbling something about “poor data quality.” Or they apply a statistical method that smears out the anomaly. Or, other times, they ascribe the “anomaly” to some arbitrary causal mechanism. While this last approach may cover up the artifact when viewed in the time domain, the artifact usually remains visible when you look at the frequency domain. In any case, to treat these natural systems this way reflects not only poor modeling, it also suppresses the most interesting part of the story.
Re #10
I also took a look at Bill Gray’s publication list. I counted 53 journal articles, more or less, over a career of around 35 years.
So:
Landsea (skeptic) 3.5 tropical publications per year
Emanuel (warmer) 1.8 tropical publications per year
Gray (skeptic) 1.2 tropical publications per year
Personally, I don’t think that size matters, that what counts is the content.
re: 12
Mr Bloom (or Mr Dano) discussing atmospheric thermodynamics? Now that would be a hoot!
Re #11
Emanuel states in his FAQ that, for a 1C rise in sea surface temperature, hurricane wind speed should increase about 5%. He also states that other modeling shows a somewhat smaller increase.
The worldwide tropical sea surface temperature has risen about 0.3C over the last 30 to 50 years.
So, the predicted increase in wind speed is maybe 2 or 3 mph.
The skeptics say that measurements, especially in years past, were, and are, not accurate enough to detect such small changes.
Emanuel uses power dissipation for his index, which lets him cube the windspeeds. That tends to make any slight wind speed differences in the historical record greater.
Suffice it to say that, to find a 3 MPH speed increase, the historical data (intensity and storm duration) has to be very, very good and, preferrably, cover a long period. Otherwise, GIGO.
“for a 1C rise in sea surface temperature, hurricane wind speed should increase about 5%.”
Shouldn’t it be a differential, difference between sea surace and atmosphere?
Re #11, would that the real world were so simple as Emanuel’s idealized Carnot cycle … Emanuel knows it is not. He says in that paper:
A second difficulty with the idealized equation is contained in his statement:
This is a huge oversimplification. Heat is transferred from the ocean to the atmosphere by a variety of mechanisms: evaporation, radiation, conduction, and spray are among them. To claim that this very complex system is linear with respect to v, the wind speed, is a gross generalization.
Next, Emanuel has conveniently ignored one of the largest heat transfer mechanisms in the hurricane. This is hydrometeors (rain, hail, graupel, sleet, etc.). The amount of energy transferred from place to place in the hurricane by hydrometeors, while not as large as the wind energy, is far too large to ignore. Every bit of energy that falls as rain decreases the wind speed.
Finally, there is a larger problem, this one also not acknowledged by Emanuel. The problem is that a hurricane is a natural turbulent flow system. With the recognition in recent decades of the Constructal Law (see for example Thermodynamic optimization of global circulation and climate, Adrian Bejan and Heitor Reis, or do a Google search on “Constructal Law”) has come a growing awareness that traditional methods such as the Carnot Cycle above give highly inaccurate answers for systems which are far from equilibrium (such as hurricanes).
Overall? It’s not an “elegant argument” as you say, it’s a Tinkertoy example and analysis which ignores many real-world aspects.
w.
Re #16, you quote Emanuel as saying:
I have confirmed that this is what he says in his FAQ.
However, this is about ten times larger than the increase given by his Carnot Cycle equation above, which is only about half a percent increase for a 1°C temperature rise, viz
((301-200)/301) / ((300-200)/300) – 1 = 0.664% wind speed increase
Clearly, either his FAQ or his Carnot Cycle equation is a long ways off the mark … or both … say what?
w.
re: 17
It’s multiple factors including temperature (as you pointed out), pressure and humidity gradients, plus recall that relative humidity increases with temp. It’s this dynamic of relative humidity that is emphasized in AGW-proponent arguments, as saturation vapour pressure (or really the partial pressure) of water increases with atmospheric temp warmed by even 1 degree.
In an ignorant press of course, all of that 1 degree increase is AGW — a view not dispelled by the authors. Such simplifications also contribute to “CO2 is The Don” arguments, while “H20 is merely a thug reactor.” There’s a lot more going on of course, but this narrower emphasis plays nicely into the boogie man publicity of CO2.
I haven’t seen Emanuel’s calculations, but I suspect that the answer is a qualified “yes, it’s a differential”. I think his numbers assume that sea surface temperature rises yet the environment (mid and upper troposphere) remain at a constant temperature.
Interestingly, the GCMs forecast that the upper temperatures rise faster than the surface temperature, at least in the tropics, so that assumption seems shaky. In general, the GCM atmosphere looks more stable, not less, than today’s.
But, there is a enthalpy differential in Emanuel’s model, which may grow with increasing absolute (but constant relative) temperatures.
An unusual headline for climate: A panel (IPCC) lowers global warming:
http://www.stuff.co.nz/stuff/0,2106,3784878a7693,00.html
http://news.google.com/news?ned=us&scoring=d&ncl=http://www.stuff.co.nz/stuff/0,2106,3784878a7693,00.html&hl=en
The Hadley Cycle was dsicovered long before the Carnot Cycle. If I’m not mistaken (and I don’t voich for it), Carnot used the Hadley Cycle as an analogy for his cycle. It’s funny that Emanual doens’t mention the Hadley Cycle, which seems highly relevant in dissipation of tropical energy.
George Hadley, 1685 – 1768 published his theory based on wind records from British ships in 1735. Amazingly, the structure of the circulation systems within the troposphere was considered to comprise three cells in each hemisphere; the Hadley Cell, a Polar Cell and in between the Ferrel Cell. This was the basic textbook depiction until about 35 years ago when the Ferrel Cell disappeared. We now consider a two cell system (Hadley and Polar) comprising basically a polar air mass and a tropical air mass. Most people still dont’ know that the tropopause that marks the upper limit of the troposphere in which these cells operate is twice as high over the equator as it is at the poles and the height also varies seasonally – at the poles it varies between 7 and 10 km (greater annual temeprature range) and between 17 and 18 km at the equator. in addition, the tropopause is not continuous but has a gap coincident with the middle latitude region where the two cells meet.
Here is a nice map showing the actual complicated boundary between polar and tropical air at the tropopause level. I don’t see a gap.
http://www.atmos.washington.edu/~hakim/tropo/
Script
Steve M., your link in #26 doesn’t work …
Thanks,
w.
It does now after I fixed Steve’s speling
RE: #3 – if warmers can discredit the AMO, then they can blame the current hurricane cycle on AGW, for maximum Algore factor.
Re: #18- Thanks for the details, Willis. Great insights, as usual. It appears to me that a lot of the required details you raise provide additional energy dissipation paths, and will act to reduce the wind speed increases caused by increased SST, which makes any claims about increased SST’s causing increased hurricane intensities even more suspect.
Also, the denominator of your calculation in #19 should be 200 K, not 301 K. The conclusion remains the same, however.
#25
You don’t see the gap in map view but in cross-section.
Yak (#30) thanks for your comment. Yes, the denominator in both should have been 200, and the increase should have been 1%. This is still a long ways from the 5% he claims in his FAQ … go figure. Either Emanuel is wrong … or Emanuel is wrong … but which one?
w.
re 31
show me a cross section, anyway what would a “gap in the tropopause” mean?
Here is the WMO definition:
see also
http://www-das.uwyo.edu/~geerts/cwx/notes/chap01/tropo.html
http://en.wikipedia.org/wiki/Tropopause
#re 31/33
Tim & Hans,
I have to agree with Hans’ retort “a gap in the tropopause”
That said, and following on from Hans’ links in #33 above, the gap is strictly theoretical.
Are we in reality or Sureality
Re #32- Willis,
In your calculation in #19, there is a missing square root sign. In #11, my equation syntax may not have been very clear. Emanuel’s result is (v)^2 =E * (Ts – To)/To. Or,
v = sqrt (E * (Ts – To)/To)
I still get a 0.5% increase in wind speed for a 1 C temperature uptick. Maybe Emanuel’s FAQ has a slipped decimal point? I can’t see how to reconcile the factor of ten difference in results reported concurrently by the same author.
Re# 34
In response to my comment on the climatesceptics group (yahoo) that, “I had understood the tropopause was not actually continuous at the point of the sub tropical jet.” William Kinninmonth replied. “That is true. It is also true for the polar front jet. There are strong vertical motions associated with parts of the jet streams and these cause strong horizontal potential temperature gradients.
Re #32, Yak, thanks for the clarification. Yes, the two results are different by an order of magnitude, with the FAQ figures saying 5% increase in wind speed for a 1°C temperature rise, and the Carnot figures showing a 0.5% increase.
However, that’s not the only oddity in the Emanuel results. I took a look at his graph of his power dissipation index (PDI) versus surface temperature. Here it is:
Now, the oddity is this. He’s rescaled the two to the same scale by multiplying the PDI by 2.1 x 10^-12. Looking at the period from the low around 1970 to the 2005 high, the sea temperature changed from from 0.4 to 1.4, a sea temperature change of one degree. And during this time, the PDI increased (according to Emanuel) from 1.9 E^11 to 7.4 E^11.
He is saying that for a 1°C temperature rise, the PDI increases by a factor of 3.9 … almost four times the power dissipated for a one degree temperature rise? I don’t think so …
The database shows no increase in the average duration of the storms from 1970 to 2005, so this means that the PDI increase must come from a purported increase in the wind strength. Since the PDI has increased by a factor of 3.9, this means that he is claiming that the wind speed increased by the cube root of 3.9 … which gives us a 60% increase in wind speed from a 1°C temperature rise.
Curiously, I had done an analysis comparing my own PDI figures with the sea temperature figures, and I found much less change in PDI during the 1970-2005 period. I never mentioned it, because it was so much smaller than Emanuel’s figures that I just assumed I’d done something wrong. Now, however, I see that his figures are very large …
What am I missing here?
w.
PDI takes into account wind speed, duration and size.
RE #37
Several things that I wonder about are:
1. The SST zone chosen (20W to 60W, 6N to 18N) is a subset of the tropical Atlantic, perhaps half of the Atlantic tropics, and is not actually the warmest part. The warmest region is west of 60W (generally, 60W to 95W and north to about 30N). It seems like the effect should be most dramatic in the warmer region, so why choose the cooler region for the graph?
2. In general, the storms are larger, more intense and spend much of their existence outside of Emanuel’s chosen region. The chosen region is actually something of a breeding ground storms and often they spend their “adult life”, where intensity is most critical, elsewhere.
3. I wonder why use just September SST, rather than, say, August thru October SST. September is the month of maximum storms, of course, but the storms in the PDI index probably include those in August and October, so why not use that SST data, too?
It may be that expanded SST data (expanded in region and time) would correlate just as well – I don’t know. His data selection simply raises my curiosity.
Perhaps Emanuel explains in the article his reasons for using limited SST data.
Further to my #39, linked is a map of the 2005 season. Look at the area of 20W to 60W and 6N to 18N.
Compare that box with the actual tracks of the storms, and where they spent most of their existence, especially the intense part.
link for 2005 season
OK, I’ll let this one go after one more comment:
I went to the GISS website where one can create sea temperature trend and anomaly maps using the Hadley data. I looked at Emanuel’s chosen box (East Atlantic) and compared that with the West Atlantic, both beginning-to-end and at different intervals. And, I looked at different months. (Caveat: this was an “eyeball” look at 250km resolution maps.)
What I saw was that, in general, the West Atlantic (the area where most of the PDI “points” were earned by storms) did not warm as much as the East Atlantic. Also, the regional warming was not completely correlated over time, meaning that in some periods one area warmed more than the other, and vice-versa.
Also, using the adjacent months, especially Ausgust, tends to add even more variability to the situation.
In short, I think that if Emanuel had used a broader (and more appropriate, in my opinion) sea surface temperature region and season, Emanuel’s figure 1 would not track so impressively.
If I can find a tool that lets me calculate a SST-time plot for, say, August-Oct over the whole tropical Atlantic (or better, the more-critical West Atlantic), i will post it.
Willis writes:
Because you have (1) cherry picked the time points (1970, 2005) and (2) inferred that the sample PDI at each time point is the ensemble mean PDI you have artifically inflated your assumed trend. The actual trend in PDI is probably half what you are assuming, if you used a statistically robust fitting procedure. (What I’m pointing to is the same difference between observation data points vs. fitted trend lines in the opening figure.) This may be not be the only thing you are missing, but it is one of them.
Fit a trend line to the PDI values as per the posted script and you will see what I mean. Working off the fitted trend line prevents you from cherry-picking start and end dates that happen to be located at noise-related local troughs or crests. Your factor may drop from 3.9 to 2.
Re #1:
1. Why are you surprised, TAC? [I’m not. The AR1 that alot of people are talking about is often not the result of an endogenous first-order autoregressive process, but instead some exogenous trend that affects only a part of the time-series. That exogenous forcing factor may strongly affect storm genesis, but only weakly affect storm decay.]
2. Are the weakly positive PACs at lag 10 and 20 *not* interesting? [Bloom wants someone to talk about “astrology”. Maybe he’s thinking solar cycles.]
Re # 42, Bender, thanks for your post. I had written:
You replied:
Since the correlation of the SST and the PDI claimed by Emanuel is so close, why does it matter whether I use
a) the trend of the SST vs the trend of the PDI, or
b) the 1970-2005 change in SST vs the 1970-2005 change in the PDI?
The differences between the two should be very small. In addition, since the correlation is so close, picking different start and end points should make very little difference.
You suggest that I check this by looking at your script. However, I’m using Emanuel’s figures, not those of the script, so the script figures are immaterial.
… please hang on while I get Emanuel’s figures …
OK, thanks for waiting. Using Emanuels actual 1973-2003 figures, rather than my estimates from just looking at Emanuel’s graph, I get the PDI increasing by a factor of 3.93/°C change in SST.
Using the 1973-2003 trends, I get the PDI increasing by a factor of 5.25/°C … a bit larger than a straight estimate …
Using the full dataset trends, 1949-2003, I get the PDI increasing by a factor of 4.75/°C, a result between the previous two figures.
But bender, for any one of these three estimates, Emanuel is showing a greater than three-fold increase in the PDI per 1°C increase in SST … does that make sense to you?
However, I asked “What am I missing”, and I realized later that I had miscalculated the increase in wind speed because I had not included the change in the total number of days of hurricanes. These increased during the 1973-2003 period by a factor of 1.8. This makes the calculated wind speed increase 30%, not 60% as I had reported before.
This leaves us with three different figures from Emanuel for the wind speed increase due to a 1°C SST increase “¢’¬? 0.5%, 5%, and 30% …
w.
Haven’t been following the argument closely enough to comment authoritatively, Willis. Just thought I might have something you might have overlooked. If my point is irrelevant, or a mere glancing blow, to your overall argument – which it may well be – I’m ok with that. Carry on.
Heck, bender, I don’t know if your post is irrelevant, because I’m not even sure if my post is relevant. That’s why I asked, what am I missing here?
In any case, bender, thanks for your contributions to the thread, sorry if the tone of my post was out of line.
w.
For a hint or two about Emanuel’s qualifications and status in the field, see here. That aside, it’s a nice not-overlong summary of the state of TC science as of 2003.
#43 bender, in #1 I wrote
to which you responded in #43
Well, the reason I’m surprised is that I’ve looked at a lot of earth science datasets, and they are rarely this simple (unless there is “something funny” with the data). My experience is that Mother Nature abhors linear systems (and specifically white noise); on the other hand, human engineering loves linear systems (and white noise). (I once heard that the goal of engineering is to linearize natural systems — with enough concrete and steel, you can make Mother Nature behave. At least we used to think so…). As a consequence, when I see really boring data, I look for a human influence. The unstated intent of my question in #1 was: Do these data accurately represent the whole truth about what occurred, or have they been “filtered”?
Considering the question from the perspective of process physics, it would seem that many of the factors that are hypothesized to affect hurricanes (SST; climate variables; CO2 concentration(?)) exhibit either trends or complex time series structures. Assuming this is true, I would expect these complex signals to show up in the landfalling hurricane data.
By analogy, I would also be surprised by reports that a company’s earnings had, over a period of decades, fluctuated randomly around a constant value, unaffected by market conditions.
Re #47:
I suspect R.A. Fisher would disagree (but of course he cherry picked his systems). TAC, how do you know the hurricane landfall numbers are not the product of a chaotic (nonlinear) process? Chaos and randomness can be pretty hard to distinguish. (Indeed, that is the idea behind digital random number generators.) Note: the PACFs shown in the intro graphic are for a linear model. Maybe a nonlinear time-series analysis would turn up something more “interesting”.
#48 bender: I’ll concede the point that I don’t know. However, having had some experience with data fabrication in the earth sciences, my initial reaction to “too good to be true” is suspicion.
Also, since you mentioned RA Fisher, you are likely aware that he used to argue for two-sided tests of a specific form: One ought to reject H0 if the data are too consistent with H0. I always liked that.
Re #49
Really? No, I was not aware of this. Do you have a reference I could look up?
#50 bender: Google “ra fisher and mendel’s data” and you’ll get a ton of references. I don’t know which one is the most reliable or accurate.
bender, I just spent a fascinating but ultimately frustrating hour searching the web for that RA Fisher quote generalizing his “too good to be true” comment about Mendel. FWIW, My “source” was a spoken (and, it seems, mis-remembered) remark by Lionel Weiss in a grad stats class 25 years ago.
However, the search did yield some interesting material. In particular, I would recommend taking a look at Patrick Bateson’s editorial on “Desirable Scientific Conduct” (Science, 4 Feb 2005; here). It discusses “selective use of the thumb” — a topic likely of interest to readers of ClimateAudit.
Sounds interesting. Link didn’t take.
#52 Here‘s the Bateson link with tinyurl — see if it works this time.
Bateson’s editorial mentions Nancy Olivieri of Toronto. Her legal battles have been legendary. Her lawyer (another Mac) is a close friend of mine.
Re: Fisher & Mendel: That makes sense. If your phenotype frequencies always converge exactly on the Mendelian expectation (remember those Punnett squares from high school?), then the data would be “too good” to be probable. I don’t see the landfalling hurricane data as falling in that category, however. They are noisy. Mendel’s data was not noisy enough.
The Bateson editorial refers to “affiliation bias” as something to be deeply suspicious of. (Indeed, it is the principle that Mark A. York uses to try to discredit M&M.) Myself, I decided long ago that affiliation bias is only worth considering in the early stages of debate. It’s been 8 years since MBH98, and I think any “affiliation bias” M&M might have had at the outset no longer matters. The source of the original skepticism does not matter when the skeptic’s argument has been proven correct. The fact is M&M’s arguments are correct, whereas the flaws in MBH98 (which are being replayed again and again in the other multiproxy studies) are fatal.
Re: #37, Figure 1 from Emanuel
This chart shows a relationship between SST and cumulative storm power. Emanuel acknowledges in the body of his article that the SST is from the Atlantic’s “seedling” area and not from the western Atlantic, where about 70% of the PDI is generated (my estimate).
In other words, it does not show the SST beneath most of the storms, but rather the SST in the region where many originated.
Warm SST in the seedling area tends to make storm seedlings more robust and mature. The storms begin earlier and become more robust before they encounter some of the adverse conditions (upper lows, land masses) of the western Atlantic. Also, the seedling area contains the important 26.5C isotherm, and so any warming of it will increase the +26.5C region, aiding storm formation.
Summarized, it’s not surprising that warmer seedling conditions generate a higher basin PDI, due to longer-lasting and more robust storms. Also, the longer a storm lasts, the greater its chances of reaching its potential (higher intensity).
If one’s goal is to see if SST is creating stronger storms, then the thing to look at is the SST beneath each storm and compare that to that storm’s intensity. That is a lot of data-crunching, but data exists.
I took a look at the storm tracks for 1992-2003, the “blade of the hockey stick”. My crude estimate, using storm days and intensities of intense storms, is that perhaps 30% of the 1992-2003 PDI was earned by storms east of 60W (an area somewhat remote until the era of satellites). For the period of 1935-1945, an era with SST close to current levels, there were no reports of intense storms east of 60W. I find that odd. It makes me wonder about the quality of historical data from that region. I will take a shot at figuring a PDI for the better-monitored western Atlantic (west of 60W and south of 30N) for 1935-1945 and 1992-2003.
Worlwide, the number of TS for the last 20 year has been constant. The North Atalntic has shown the greatest variance. This variance appears to mirror the Multidecadal Oscillation as well as the NAO.
Another point to make is the fact that many TS never hit land, and are not tracked by air recon, but satellites. Storm intensities taken from Satelite recon is very subjective -esp if the storm doesn’t have a well defined comma cloud or eye). Geostationary satelites have low resolution-3nm visual, 6nm IR. Polar Orbiting satelites have resolutions of .3nm in the visual. The process developed by Dr. Dvorak depends on how much cloud detail is present during the entire the storm’s entire life cycle. If the analyst misses this detail, his intensity calculation’s suffer.
One way to limit the errors of satellite analysis is to deploy more buoys to both the NW Pacific and South Pacific as well as the Indian Ocean.
JP, is this conclusion based strictly on data available in the literature, or do you have additional insight above and beyond what’s been published?
Bender,
Here are the some links to the JTWC. Instead of giving you ancedotal info, I’ll give the the links to thier archives, FAQ, and annual reports, etc… It would be very interesting to see what a comparable analysis for the West Pac would look like. From what I can see, there hasn’t been the elevated number of TS in the West Pac as comparable to that of the North Atlantic. There have been the occasional Super Typhoons, but this can be expected in an Ocean as large as the Pacific. The JTWC Are of Resonsibility doesn’t extend to the South Pac, but they do track cyclones in the North Indian Ocean.
http://tinyurl.com/kushs
http://tinyurl.com/hew6m
http://tinyurl.com/bqhdh
Another interesting thread. I will try to address a few points:
There is debate within the hurricane community as to which “metric” of intensity to use. There are a variety of measures, that tell you different things. Momemtum based measures are proportional to wind speed, Acummulated Cyclone Energy (ACE) is proportional to wind speed squared, and PDI is wind speed cubed. The most frequently used one is ACE. There are also cumulative extensive measures (for an entire season) that depend on the number of storms (as well as some power of wind speed and duration of the storm), plus measures that are intensive and don’t depend on the number of storms (seasonal average wind speed would be an example of intensive variable). Our variable NCAT45 is of the momentum category, and is intensive if divided by total number of storms. In my opinion, you need to look at both the extensive variables like ACE, and the intensive variables also to sort out the contribution from intensity, duration, and total number of storms. Kerry Emanuel is the main person using PDI, and people have started using PDI largely because Kerry has been using it. Kerry likes it since it correlates well with the SST and emphasizes the stronger storms. My preference is to look at duration, number and the intensity distribution separately, in addition to ACE, to try to untangle what is going on.
Re SST. The convention in the tropical cyclone community has been to look at SST in the “main development region” of each ocean basin, which is where the storms typically spin up initially to tropical storm status. But I agree that this is misleading. It seems that you need to look at the tropical SST averaged over the ocean basin, and also the gradients in SST which influence the atmospheric dynamics. Patrick Michaels in a recent GRL paper attempted to track the SST underneath a tropical storm, but that turns out to be a not very useful thing to do since there are so many variables involved in the evolution of an individual storm, not to mention the fact that the storm itself modifies the SST.
Re U.S. landfalling hurricanes, I addressed this a little bit in my congressional testimony
Click to access GT%20-%20Curry%20Testimony.pdf
The “cycles” you see in your analysis have been seen by others, I am particularly interested in the ~20 yr cycle, working on trying to understand that one now. The number of U.S. landfalling cyclones (again, using running mean to filter high frequency variability from El Nino etc) shows strong 70 year cycle and a noticeable 20 yr cycle (note I am told that the total number of named storms is the most reliable in this data set).
The 70 yr and 20 yr cycles are shared with the total number of NATL named storms, but the trend since 1970 (after you filter out 70 yr cycle) is barely there in the landfalling statistics. This is just what I have eyeballed, we have not done any serious statistical analysis of this time series yet, and I am certainly interested in what this group has to say on the subject. One hypothesis is that the AMO may have its greatest influence more in the track of the storms rather than in the number/intensity of storms that are mainly sensitive to SST (if you filter out the year to year variability).
Welcome back Judith. Your informative posts are appreciated, as always.
One thing to keep in mind when looking at US landfalling storms is that the majority, perhaps 70% to 80%, originate in the western basin (west of 70W). The factors (low shear, upper high pressure, presence of old fronts, etc) that favor development in this area (West Caribbean, Gulf of Mexico, Bahamas) may be different from the factors (Saharian dry air, SST, trade wind speed) of Emanuel’s seedling box (east of 60W). So, the US landfalling database may appear different from the overall Atlantic, because, to a large extent, it is driven by different factors and actually is different.
Speaking of Emanuel’s SST box, I think his paper’s correlations depend to some extent on the exact definition of the box. I found it odd that his box extends down to 6N, which is below the beaten path of late-summer disturbances. When I redefined his box to a more appropriate (to me) 10N, the correlation fades a bit. If I include the western basin, the SST hockey stick flattens and the correlation breaks further.
As a side note, I find his figure 3 box to be a head-scratcher. Figure 3 PDI is based on northern hemisphere storms yet his SST goes to 30S, so that half of his SST box comes from the uninvolved southern hemisphere. And, I have no idea if he’s mixing seasonal SST data (Pacific) with September data (Atlantic). I am not suggesting anything, but simply wondering, as my kids say, “What’s up with that?”
David
One final comment on Emanuel’s Figure 1:
The definition of the SST box affects the shape of the “handle” of the Figure 1 hockey stick. If the box is defined as 6N to 18N then the 2000s are the warmest period. If the box is defined as 10N to 18N, or 10N to 20N, then the period 1932-1943 looks to be as warm as 1992-2003. And, 1938 looks about as warm as 2003. (Caveat: this is based on me eyeballing data: I have not done all the averaging to get the exact grid numbers.)
Again, to me, 10N to 18N seems more appropriate than Emanuel’s definition (6N), based on the tracks of typical late-summer disturbances. If my box definiton is used, then the hockey stick becomes valley-like, and the 2000s are no longer as prominent.
I will crunch some numbers this weekend and see if my eyeballs are correct.
Re #63
Careful, Dr. Curry, if you try to understand low-frequency variability in these kinds of data
Steve Bloom might accuse you of being an astrologist. And that would be a major hit to anyone’s credibility.
Dang, forgot the smiley’s again.
A curiosity I noticed, other than the selection of a small sea surface area to compare against, is the fact that the North Atlantic data are compared to the September average SST, whereas the North Pacific data are compared to the July-November average SST. Since Emanuel provides no a priori explanation of this choice, I tend to suspect selective data mining … but YMMV.
w.
Thanx for the explanation Willis. I was wondering why you got different results. My I suggest a nonlinear effect where warmer temperatures increase late season hurricanes but decrease mid season hurricanes. As the temperature gets warmer what is late season changes but not the number of hurricanes. Atleast this seems true in the gulf. In the pacific things might be different because of different ocean currents.
Re #67: Analysis of climate cycles is one thing, bender, while assuming a priori that they are evidence of insolation changes is something else. That sort of thinking seems to be a slippery slope around here. OTOH I’m sure we’d all be very interested to see your predictions for 2010 and 2015.
Also, didn’t this whole discussion (now encompassing three threads and over 500 comments!) begin with a question you had for Judy? Since you seem shy about asking it again, I’ll reproduce it for you:
‘In Curry et al.’s Fig 1. the trends are so obvious that no statistics are required to convince a skeptic of their significance. But the observations are for 5-year windows. Taking a moving average will tend to exaggerate a trend by reducing interannual noise. If they had presented annual observations, how much would that have fuzzed up the trends? How much would it have compromised the statistics? Their argument 1 on p. 1028 is fine … as long as the uncertainty surrounding the statistics is taken out of the picture. Why did the authors choose to eliminate the uncertainty by using a 5-year window? Because it simplified a story intended for a lay audience? Is this a simplification, or an oversimplification?
‘”Science is what we have learned about how to keep from fooling ourselves.” – Richard Feynamn’
I’ve never been clear as to why, but you and Steve M. went on to make a huge deal out of this. Hopefully Judy will answer now.
Re the 5 year windows, this was Peter Webster’s choice on how to present the data. When he first started looking at the data, he was so struck by the large increase in CAT45 hurricanes that he did not think any fancy statistical analysis was needed. This paper was submitted around July 1, 2005. We didn’t think this would get published, since we had recently found out that we were apparently “scooped” by Kerry Emanuel who submitted his paper a few months earlier than us. Prior to the 2005 hurricane season, there was no particular interest in the hurricane and global warming issue, there had been a low level dialogue about this for the past decade or so. Subsequently, given the concerns that were raised about the quality of tropical cyclone intensity data particularly outside the NATL, it didn’t make sense to beat this data to death statistically. It will be interesting to see what the various tropical cyclone reanalysis projects deliver, this should at least give us some useful error statistics to work with.
In trying to understand long term trends or multidecadal variability, it seems sensible to eliminate those elements of high frequency (albeit high amplitude) fuzziness like el nino that are well understood and known (?) not to contribute to the long term trend (I would appreciate any robust statistical analysis of what we think we “know”)
This eschange is interesting to me, since it illustrates the gaps in perspectives of the climate researchers (wo bring rich Bayesian priors to their analysis) vs the perspective of the statistician/econometricians (I’m prepared to try to bridge this gap, but I suspect the gap with the lawyers eg volokh is beyond me). Both perspectives are valuable, and bridging the gap between the two would be a really good thing. Climate researchers are not all expert statisticians (I certainly am not, although we have two good statisticians in our group Carlos Hoyos and Viatcheslav Tatarskii) and I agree that there is plenty to criticize in much of the statistics in climate research. At the same time, statisticians without understanding the underlying physics, phenomenology and data constraints provide a limited contribution. So I am hoping that this exchange will help bridge this particular gap.
The debate here seems to be limited about the statistical analyses of the data, rather than the data and the conclusions from that data, per se.
If it is obvious there is no need for statistics.
If it isn’t, statistics assume importance to often result in competent scientists calling white black in contradiction to the evidence.
#72. Judy, rgarding statisticians. I’ve chatted with von Storch about this and he has got frustrated over the years with most statisticians who try to deal with climate data, because their approach isn’t veryhelpful – by which I think that he had in mind that they are used to independent distributions. Econometrics is a actually a field of statistics which is completely used to dealing with annual autocorrelated data; I think that econometricians are far more likely to be helpful to an average climate statistical problem than a statistician drawn at random from a university statistics faculty. Some people in business statistics are even more used to weird distributions – plus they are very used to the perils of self-deception when dealing with autocorrelated series. Econometrics is really quite a large field with many journals. Maybe what’s needed is a Journal of Climate Statistical Theory or some such title, where a proper understanding of the issues was built up.
I would say that that’s exactly when fancy statistical analysis is needed. Do you have a long-tailed distribution? Are the statistics autocorrelated? Hurricanes are obviously a form of extreme values – so you’re already deep into the tail of some kind of storm distribution.
Some of Mandelbrot’s early work on wild distributions was stimulated by hydrological variables. Ex ante, I would expect hurricanes to have a very “wild” distribution statistically. Having said that, it also seems quite plausible to me that warmer SSTs would result in more hurricanes.
Not interested in hurricane dynamics. Only interested in the way scientific information gets packaged for consumption by policy people. Will not say again. (“Statistics weren’t needed”, me arse.)
#74:
Such processes are also bread-and-butter for all (engineering) fields covered by an umbrella term “statistical signal processing”. For a rather extensive introduction see, e.g., the free book by Gray and Davisson: An Introduction to Statistical Signal Processing.
I should say, too, that my general unhappiness about the way uncertainty surrounding “unprecedented warming trends” is presented in graphical and statistical analyses comes by way of direct experience with junior and senior policy makers – people who routinely ignore uncertainty as an additional dimension of complexity too difficult to deal with. It makes their job MUCH easier if that information is suppressed … and so they actively seek to have it suppressed. (Witness Peter Webster’s choice, outlined in #72.) I have seen this happen with my own eyes, so don’t tell me I’m a paranoid conspiracy theorist. It happens, routinely. In fact I would say it is the prevailing culture. It is the reason why journals like Ecology devote entire issues to the problem of incorporating uncertainty into the science->policy process.
Bloom in #71 hints that maybe this minor point of mine on hurricane frequency does not merit the bandwidth it’s consumed. Maybe. OTOH, this was the entire problem with the hockey-stick. An uncertainty-free hockey stick is a convincing hockey stick. THAT is my point. (Now made so many times at CA I am starting to repeat myself.)
1/3 of “FUD” is “U”. And, unfortuantely, U (=uncertainty) is part of the equation that can not be ignored if we are to get a robust estimate of the “A” in AGW. Who shall disagree with that?
Re #77. Thanks very much for the link, Jean S. Looks like mandatory reading for all tree-ringers.
RE 75:
I think it’s plausible too, IF the temp difference between the SSTs and the mid & upper-atmosphere over those areas increases. The real power of tropical storms depends on the difference (both in temp & moisture) between these vertical levels, very generally. IOW, if the mid & upper tropospheric temps also increased the same as the SSTs, I don’t think there’d be any significant increase.
Basic greenhouse theory says mid & upper tropospheric temps will increase first, overall.
Re #80
Does basic solar theory suggest oceans may respond slowest, but strongest? Maybe the observed trend in SST-driven storm frequency is due to the latter (lagged effect of warming in the 1950s & 1980s) as opposed to the former? (These are wildly uninformed speculative questions, BTW.)
The sea surface situation is complex, IMO. First most of the Solar Shortwave radiation is absorbed somewhat to much below the actual surface and then is well mixed to a depth which varies quite a bit with season and latitude. Movement of heat below this level is very slow and dependent largely on ocean currents.
Longwave IR heat, however, is absorbed in the top few millimeters and some % of their energy is expended on increased evaporation before it mixes. This depends strongly on windspeed and so forth. Once it got entrained into a mixing cell, however, it would basically act like shortwave solar. But in any case, it doesn’t take too long to change the temperature of this surface layer, especially in the tropics where there’s both more radiation and a shallower mixing layer. That’s why we get these El Nino and La Nina situations. And these changes are far in excess to the expected changes from any increase in GHGs. Temperatures over large areas of the ocean surface can change by degrees in periods of months or a year or two. That’s why I’ve been suspicious about these claimed measurements of hundredths of degrees in the global SST and their asignment to AGW. It’s true that if there is much AGW it would eventually show up in SSTs, but there’s just not been enough time to accurately measure such changes. Those who claim to have seen it are either fooling themselves or lying.
Interestingly, Emanuel’s 2005 article notes that air temperatures in the tropics have not risen as much as sea surface temperatures, which increases the contrast and, per Emanuel, may account in part for the stronger storms.
Re 83, say what? Since the driver for the storm is the temperature difference ‘ˆ’€ T between the SST and the air temp … wouldn’t that make for weaker storms?
w.
But isnt it that SST are warmer than air temp, so if the sea surface is warming more, and the air isn’t doesn’t the satement hold true?*
*please note that this works against AGW theory in that air temperatures are not warming, if AGW was warming the air we would see a reduction in Hurricane intensity.
Re #85
That was my read on it, ET Sid. (I think Willis was just caught speed-reading. Nothing more.)
I agree.
I fear trying to correct Willis, because he’s usually correct. But it was bugging me.
Interestingly enough I did a little searching to confirm before I respond, and while I could find plenty of info on sea temperatures in relation to hurricanes, not so with air temperatures.
Re my 84, y’all are correct and I was wrong … not for the first time … nor for the last, I fear. Too much speed reading, as bender suspected.
My thanks to all for the gentle correction,
w.
You know what though? If ever Willis is so blind that he simply can not see his error, I have confidence he’s the kind of man who will provide his code for his peers to analyze. He might not be happy about it, but he would do it. That’s why he gets let off easy. Not because he’s playing for the “right team”, but because he plays by the rules. (Enough moralizing on my part.)
I think its time for a group hug.
a few further comments
For a moment, forget the “policy relevance” aspect of the hurricane issue. Purely from a scientific point of view, it would be reasonable for hurricane/climate scientists to conduct a study where they assemble a data set, present the results, and provide a physical interpretion of the data. Then, other researchers might build upon the original study and conduct a more rigorous statistical analysis of the data. And the research would proceed from there. Our initial paper was written purely to be a provocative scientific paper to present the results of the global satellite TC database. At the time the paper was submitted, we were not even thinking about policy implications, we were hoping that this would be viewed as a provocative paper that would be subsequently cited in the scientific literature.
Once you throw policy and the media into the mix, then this process does not work unimpeded (viz the theme of the mixing politics and science paper). At the time we submitted our original science paper around May 1 2005, the hurricane/global warming issue was no particular big deal in terms of policy and the media. It became a big deal in early august with the publication of Emanuel’s paper in the midst of an already very active hurricane season. Then when our paper was published right between Katrina and Rita, the #$%^& hit the fan. Now that the topic of hurricanes/greenhouse warming has clearly become a hot button policy relevant issue that people are paying attention to, I know that at least I personally feel more compelled to consider the policy implications of any further research I conduct on this topic in terms of the actual problems I decide to work on, the methodology used (in terms of data quality and statistical analyses), and the framing of the potential “sound bites” from the paper so that the results are easily and appropriately interpreted by the public. Why don’t climate researchers do this on every paper? We are not trained to do this, most of us are unaware of all the little policy wars going on surrounding this issue (and don’t want to be distracted by this stuff), and most of the papers we write (>99%) never make it into the public arena. Also, once scientists start considering the policy implications in our papers in the manner that I described, we are then characterized as having an agenda, as “warmers”, “alarmists”, etc. So what are researchers supposed to do in terms of conducting research on highly relevant topics? It is not obvious, and this entire craziness has resulted in the public perception in the integrity of climate science taking a beating.
In the most extreme case of all this (the hockey stick wars), media attention and the preparation of assessment documents for policy makers resulted in the dueling realclimate vs climateaudit blogs and substantial polarization of the groups, making it very difficult and contentious to come to something sensible.
Re the hurricane issue, I (and Webster, Emanuel, Holland) have been fighting “wars” over the data quality with people from the National Hurricane Center in the media and this has been very frustrating since much of the other sides argument rests in “appeal to authority” (they know the data is bad, even though they have been using it for decades and have previously said the data was ok), without any rigorous (or even unrigorous) uncertainty analysis. There should be no wars on the statistical front, I look forward to considering any statistical analysis that you conduct on the data and trying to learn from the issues that you raise (I assume that my colleagues would feel the same way, but they are more blogophobic than I).
re #91: Dear Judith, first thank you very much for sharing your thoughs here. As a working scientist, I’ve been here for a while for a very simple reason: you get a lot of information from here. I know nothing about hurricanes (except that I lived through Hugo/89), but I’m still following these issues with interest as it seems that there are a plenty of people who know something about it and, more importantly, are ready to put their thoughts on the line of fire. So my advice to your colleagues is not to be that blogophobic, and come here to share their thoughts. Maybe they learn something here too: there seems to be some expertise from various kinds of fields here. They can be anon if they wish not to reveal their identity, so there is nothing to loose.
I think the same as with any other topic. Simply be honest and open. Honestly do your best, openly share your data/results/methods/codes etc with anyone interested, and be prepared to admit your shortcomings/mistakes etc. This is the way science progresses, and this is what all scientists should be fundamentally interested: the truth whatever it is.
I’m sure Steve can share your feelings! Just read a bit around here what he’s gone through while trying to obtain any relevant data/codes.
Again, thank you for coming here. I sure wish you keep posting!
I’m getting off-topic, but I hope Steve allows this.
Judith:
This is why I think one should not really follow media on these matters. If you are interested, check the things yourself. This is why I came here in the first place: PCA is something I happen to know, Mann’s PCA calculations are so obviously fundamentally flawed, and I still saw commentary in the web/media furiously defending him and ridiculing Steve&Ross (“the messangers”). If a student of mine turned in a term paper with such calculations, I am not sure if I would even bother to explain him/her why it is flawed instead of simply saying “this is plain wrong”. I’m sure Wegman was thinking why in the heck, after two years, this thing is even an issue!
After following a while now what’s going on in “climate science”, I am not really worried about the media. My concern (and this IMO is something the climate field itself should really pay attention to) is the peer-review process in the field, which IMO seems to be somewhat corrupt. I wish you would take time to review the discussion here (CA topic Bürger and Cubasch Discussion). Two things: 1) do the reviewers actually have something to say about the actual content of the paper? 2) Are the comments (tone/language etc) of AR2 really acceptable? If I were the editor, I would dismiss AR2 from any of the comments he/she has made so far.
Jean, thanks for these posts (hopefully we are not going too far off topic). the post on the cubasch paper was very interesting. I don’t get my primary info from the media, but the media polarizes the scientific debate and raises the stakes and makes it more difficult for both sides to come to anything sensible.
The review process (and also the assessment process) is of great concern to me. Major difficulties are encountered on subjects of “relevance”, that have economic and/or policy relevance. The problems eventually sort themselves out in the published literature, but in the intermediate term a lot of craziness can result that can mislead policy makers.
At the Fall AGU meeting in Dec, there is a Union session on the Integrity of Science to address these issues (I am an invited speaker), I will try to raise this issue on the blog a few weeks before my talk to get input from people that I can ponder for my talk.
Judith, my business background is in mining promotions ands peculations and what attracted my interest in the HS and IPCC TAr was how “promotional” they were. In a securities offering, you have to give “full, true and plain disclosure”. This means that you have to prominently disclose adverse results i.e. results adverse to your thesis. This is the part that academics – at least the ones that I’ve been in controversy with – don’t get. Their attitude – and one that is all to prevalent is a “don’t ask don’t tell” statnadard i.e. if you don’t say anything untrue, then you’re OK. “Falsification” in science codes of conduct theoretically prohibits this, but is disregarded.
For business promotions, press releases are subject to the same standards as prospectuses. There is an ongoing duty of full, true and plain disclosure.
“Due diligence” is a big topic. Since journal “due diligence” is negligible, authors cited in IPCC etc. should be obliged to provide a complete due diligence package in the form of data and methods.
There’s nothing very hard about these issues. Just start looking at how other occupations – where money is involved – handle things.
Re #94, Judith Curry
An excellent idea, and may I join Jean and others in welcoming you here.
One place you might like to start with is a presentation Ross McKitrick gave recently on the need for an independent public sector auditor to review science that is being used for public policy.
Ross, if you are around, what sort of reception did you get for this paper ? Any chance of anything arising from it ?
Actually, Steve, if Ross has the time and the inclination, that presentation and how it was received might make an interesting header post.
Re #91
Finally, herein lies the answer to my original question about the Curry et al. Fig 1 hurricane trend graphic. Clearly, there could not have been any intent to deceive policy people (by suppressing the uncertainty around the trend) because this was not a hot-button political issue at the time the paper was submitted. My suspicions were unfounded, and I have regained some confidence in the community Dr. Curry speaks of.
If we recognize that there are much better ways to analyze and to present that kind of noisy time-series data then I’d say we’ve come quite a ways from the earlier assertions, ridiculous, that “hurricane counts are not subject to sampling error”.
The links in #98 should be reversed.
I’m not so sure if I agree with this. While Katrina brought the issue more to the forefront, my perception is that it was a big deal prior to May ’05, at least as a media issue.
As an example, see Chris Landsea’s Jan ’05 resignation from the IPCC, and his letter describing media coverage of the hurricane/global warming issue and the actions of his colleagues at the time.
Thanks for the opportunity to diverge a bit on this topic. I read the McCullough and McKittrick paper, very interesting. I totally agreed with everything until section 3.3, the recommendation of a government oversight committee (libertarian lawyers at Volokh, alert!). The issues raised at climatesciencewatch and by the republican war on science do not suggest that this would be a good idea. I think that the journals themselves have to take on a major part of this responsibility, with prestige of the journals becoming associated with the due diligence (and not with the number of press releases generated by the articles).
The issues raised in this paper, while valid and important, are only part of the problem in my opinion (but i won’t diverge this thread further at this point).
One little diversion. I’ve noticed some interesting parallels and contrasts in the hockey stick (HS) vs the hurricane global warming (HGW) controversies. In HS, the issue was availability and transparency of the data set. In HGW, the dataset was publicly available for anyone to pull of the web from a number of independent sources. The HGW data controversy arose from the people who created the data sets saying it wasn’t good enough to do AGW detection and attribution studies, without providing documentation for this assertion. In HS, the climate researchers were the “insiders”, while in HGW the climate researchers were the “outsiders” challenging the hurricane establishment.
re 100: the landsea/trenberth tempest was really a mini media tempest generated because the media likes conflict. It was mainly of any relevance at all because of what it said about the IPCC process and the behaviour of people involved in the process. There was no real science meat in anything that was going on between landsea and trenberth. My take on this was that the media discussion was not so much about global warming policy or hurricane adaptation policy, but rather mostly about the IPCC process.
#101. Judith, I agree with you that a government oversight committee is a bad idea and do not endorse it. I’ve argued with Ross about this concept. I think that there are many much more practical things to do – such as improve standards of data archiving, disclosure of source code, much more attention to disclosure of results adverse to the thesis. I also don’t think that inadequate due diligence at journals is a priority, although I think that some focus could be re-directed. I’d like to see less attention paid by reviewers to whether something is “right” and more to whether materials are provided so that the results can be tested.
The CPD review of Burger and Cubasch provides an object lesson in how journal reviewing goes astray. Nobody asks whether they have provided materials so that their results can be checked or verified. Leaving Mann’s review aside, I was very irritated at the reviwer who argued that some other problem was more interesting than the one that they addressed. So what? A securities commission reviewing a prospectus wouldn’t say – well, maybe you shouldn’t be selling hamburgers, did you think about sellling Mexican food? I’d rather see more effort spent on disclosure and less worrying about whether something is “right” which seems to degenerate quickly into arguing POV.
Re #100
Semantics. Media attention was ramping up over time; there was no threshold where you could say the issue was apolitical at month t and political at month t+1. Cr. Curry’s perspective resonates with my own lay experience: I did not start thinking about how you would properly analyze that kind of data until I saw the sickening Katrina images on TV and the cartoon time-series in the newspaper.
Bless you for this suggestion. Reviewing is a very challenging, time-consuming, and very thankless task. In fact you’re more likely to get spanked than thanked for a diligent review. Some journals are much more careful than others about review for correctness of assertions. (Any false assertions, however small, are usually declared a fatal flaw and the paper is rejected.) There are really two (or more) tiers of journals; the problem is that it is not clear to a non-specialist, or outsider, which are which. Thus it is not clear which papers “to trust” and which “not to trust”. You don’t want to abandon review-for-correctness because that trustability factor is the most sacred deliverable of all. But you definitely want to boost replicability by forcing authors to maintain publicly available turnkey scripts – which takes away their precious monopoly on truth, and serves to boost inter-lab competition. This will serve society’s best interest.
Two other innovative ideas: (1) authorship should be anonymous to reviewers, but (2) reviewership should be made public knowledge at the time of publication.
I’m signing off for about 36 hours, travelling back to the states from ECMWF (will post about Vitart and ECMWF seasonal forecasts when i get back to the states).
#72
That sounds like a gentle way of saying that climate research, as practiced, is essentially a subjective (Bayesian) activity, which may explain a lot about the tone of debate in this field. I happen to subscribe to the view that “subjective (Bayesian)” is absolutely not the same as “bad” — most of life’s best things are subjective (Bayesian) — yet it is hard to ignore that nagging problem of credibility when using methods resistant to impartial audit. FWIW, Volume 2B of “Kendall’s Advanced Theory of Statistics” — which generally endorses Bayesian statistics — does a nice job discussing conflicts that arise between (and because of) “logical” and “subjective” probabilities, particularly when dealing with propositions that are theoretically provable. It is also worth noting that some “classicists” are driven crazy by the very concept of subjective probability. It is probably true that at least one of the two sides in that debate “doesn’t get it”.
Though I have not heard the argument, perhaps even the hockey stick is defensible as a Bayesian construct. Could it serve as an informative prior, ostensibly obtained through rigorous mathematical manipulations but really just an expression of belief? Hmmm. When the NAS Report used the word “plausible” to describe MBH conclusions, was that a subtle hint intended to suggest viewing things from a Bayesian perspective?
Just a thought. 😉
#105 Bender,
The “traditional” review process (2-3 anonymous reviewers deciding on the fate of a paper) is now outdated. Technology allows us to post un-reviewed papers, and have a “dynamic” review process, played out in the open, as well as all supplementary material needed to reproduce the results. The end-user is the best judge of a paper’s quality and significance.
The peer-review system survives because it is at the core of the scientific hierarchy. “Gate keeping” is the only power that an academic scientist can ever have, and with it come prestige, promotion and grant money. That’s why there is resistance to change it.
On a practical side: it is unrealistic to ask reviewers to reproduce results that often have taken months, if not years, to obtain, not to mention complex experimental setups, etc. Not all papers are just statistical calculations like MBH. On the other hand, it would be possible for a journal to do some random audits of papers it publishes. Authors would have strict guidelines as to what material they should keep to supply the auditors. A journal’s reputation would be enhanced if it were to enforce such measures.
Papers used in the context of public policy decision should also be subject to stricter auditing.
Re #108
I agree the traditional model is growing outdated; but it hasn’t been abandoned, and won’t be for some time, for the precise reasons you outline: capital interests, once entrenched are immovable (except by their own choosing). Thus the discussion is worth having.
RE: #103 – A new ISO standard certainly seems compelling. Many of the principles of something like ISO 9000 would apply. About 1 year ago someone stacked up ISO 9000 against SOX in “Quality Progress” (the main, quasi technical “club” journal of the ASQ) and it was quite good in terms of mapping. For that matter, this blog might serve as the initial framework for developing the new standard. Amongst us we probably have a pretty good representation into international standards bodies.
I don’t think that “sampling error” is the right term. It implies something like polling where we take subsamples and have a distribution of the sample means that is guassian around the true mean. Or like in polling, where the method of sample selection may have a bias. I know that bender wants to make a point about the high variability of year to year numbers, not say that we didn’t catch right number of hurricanes. I think some other more precise term would be better, since the phrase “sampling error” can be take either way, and the more conventional meaning is the one that I have used.
I would make the same exact point if we were talking about “mega-mergers” in a finance study and the numbers varied a lot from year to year, but there was no question that we were not getting the valid data.
Bender: we’ve had a lot of discussion of review methods on the blog. The negatives with your approach are that authors may be discernable by subject matter and that publicized reviewers may be less willing to pan works. (But the positives of your approach may outweigh the negatives.)
FO: One basic function of editors (and really reviewers too) is just to uphold basic quality of writing and of logic. The CPD paper by B&C (open format) was really a mess. Surely not a good example of quality control. They even admitted that they retained terseness based on making a draft for GRL even thought the paper was now shifted to a non-letters journal (implying laziness). Based on that example, I’m rather concerned that open papers will be junky.
Well, Santer and Wigley are at it again. In a paper to be presented at the PNAS (Forced and unforced ocean temperature changes in Atlantic and Pacific tropical cyclogenesis regions, B. D. Santer, T. M. L. Wigley, et al.) we find the following marvelous bit of statistical legerdemain:
Near as I can understand this, they’ve taken the standard deviation of the temperature trends from a bunch of unforced model runs. These trends are for the Atlantic and Pacific Cyclogenesis Regions (ACR, PCR).
Then they divide the actual temperature trend for the region by the standard deviation of the model runs, and they claim that this is the sigma value of the observational data … that is to say, they claim it represents the odds that the temperature trend in the region is due to “natural internal variability”.
Man, I’ve never heard of such garbage in my life … the idea that we can determine if observations are from “natural internal variability” by looking at models which are known to underestimate natural variability is a joke. I can’t even begin to count the number of unsubstantiated assumptions in that method. Take a look at my analysis of Hansen’s models to see how badly their standard deviations represent reality.
w.
Judith, if you are still around, I have a question or two with regards to your March, 2006 study on tropical cyclone trends.
You’re quoted in the press release as saying that the is “no global trend in wind shear…over the 35 year (study) period.”
1. What is the geographic area studied? Was it global, the tropics, or a box in the tropics?
2. What is the data source?
3. Was this a review of 250 vs 850mb shear, or were other levels also examined?
The reason I ask is that have found that staed wind shear values for the tropics, satellite derived, are not very accurate, and they do a particularly poor job on important smaller-scale features, especially below 250mb.
Thanks
bender, Steve, or anyone, here’s a link to the June paper from Mann / Emanuel.
The shapes of their several curves look mighty familiar.
Mann states that he uses “a formal statistical analysis to separate the estimated influences of anthropologic climate change from possible natural cyclical influences…” with residuals, spectrums, etc.
I am interested in your take on the statistical approach. I will try to reconstruct his basic data, if I can figure out the details of his approach.
link
link for #115
Re #111: Thanks for blocking that spitball, TCO.
Listen up TCO, one time only: a realized instance of a stochastic time-series process is only one sample from a whole family of random possibilities. Read Steve M’s favorite, Koutsoyannis. *You* learn to use the proper terms and apply the proper thinking, or I’ll harass you like you harass Steve M. Spitballs are from delinquent students, not teachers. I will not argue with you, TCO. Bloom, meanwhile, still owes me for that free lecture last week.
Re #118: *Now* I get it! The error-riddled HURDAT data was just another member of that family, and so just as likely to be “correct” (in a statistical sense) as actual corrected data. Even better, so can randomly generated time-series that have no connection to reality! Is there an infinite number of them? This is great stuff. bender, be a gem and link me to some sat photos of some of these other TC time-series so I can compare them to the real thing.
Btw, I found an interesting NOAA Technical Memorandum NWS TPC-4: It contains many tables answering quastions like “What year(s) have had the most and least hurricanes?”
~ghw
Btw, I found an interesting article from NHC NOAA NOAA Technical Memorandum NWS TPC-4. It contains many tables answering quastions like “What year(s) have had the most and least hurricanes?”
~ghw
Re #119
Ignore
Bender: A. I got that, that’s what you were driving at. B. Your terminology is still at a minimum ambigious and maximum, improper. C. Don’t make a response and then say you won’t argue with me. It’s silly.
Re: #123
Good. Maybe you could explain it to spitball-deserving #119 (who has asked for a reasonable definition of what it means to be “ignored”).
Bender: As stated in the post, I’m aware that when you say sampling error, you actually don’t mean real sampling error from a population, but mean a high variation rate (or in your mind some sort of sampling of alternate universes). But the terminology is inappropriate (at least ambiguous and at most wrong) given that sampling error typically means observations of a subset of a population…of a real physical population, not of alternate universes.
Re #107:
TAC, yes, that would be me. So, help me “get it”. What does Bayes really accomplish for you. I mean really.
Re #125
TCO – bless your soul – the “population” being “sampled” in any given year is the set of hurricanes that might have occurred had the chaotic terawatt heat engine of planet Earth pumped out a different set of storms under virtually identical initial conditions. My terminology is correct. It’s maybe your concept that is wrong. When you heat a pot of water, does it bubble the exact same way each time you turn the burner on? Of course it doesn’t. But it’s the same damn process being replicated each time. Same burner, same pot, same water, same rate of heating. It’s just a naturally stochastic turbulent chaotic process.
Bender: How are we to know that when you originally used the term that it applied to your “what might have happened” set of universes. Given that there was significant discussion of missing huricanes, it is not at all clear that sampling error applies to your alternate universe set rather then the difference between observation and event.
Here is a google on “sampling error”, definition. I’m not finding any of the defs that restricts “sampling error” to your alternate universe set or even mentions stochasticity. If you decide that is what you want to talk about, you need to use a more restrictive term then “sampling error” or clarify the context ahead of time (and you didn’t in that original gibe against Bloom…so why bully him? Your term was actually ambiguous and even within the context of the overall discussion given the data error in earlier times discussion, landfalling versus overall, etc.)
http://www.google.com/search?hl=en&q=%22sampling+error%22+definition&btnG=Google+Search
BTW, given that the system may be changing over time and that there is a serious hypothesis that it is, it is rather bizarre to think of sampling the “what might have happened” set of universes. at the end of the day, we can only sample one set of “what did happen”.
so why bully him?
Why not?
On the boiling example: I actually have a (casual, operators-level) acquantance with nuclear reactor modeling for nucleate boiling, departure from nucleate boiling studies. Even here, I would want to differentiate from sampling errors (say of detection instruments observing parts of the fuel assembly surface versus the “run to run” differences.
Re #119/124: bender, be a gem and consider that constant third-person references to someone doesn’t constitute ignoring them.
Re #128: Thanks, Barney. Keep up the good work.
#130
Thanks, Barney.
De nada.
I have a question for you, Steve Bloom.
re: 66 David Smith
Your observations have intrigued me as they made be suspicious of data mining and reminded me of the way people develop stock picking strategies using past performances even to the point of cubing some attributes instead of squaring them or using them as is. I believe I saw Willis E make a similar observation of suspicion of data mining. Since I have not read the paper, I was curious as to how you judge the cases that Emanuel makes for choosing his criteria. How robust the location criterion is I guess what you are crunching numbers this week end to determine. I will interested in seeing the results.
Ken, re 133, you say:
The problem was, I haven’t found the part where he makes the case for choosing his criteria, either for the boundaries of the box, or for the time of the comparison (September for the Atlantic, versus July-November for the Western North Pacific).
w.
Re #134: Why not just email him and ask? But first I suggest re-reading the paper, carefully, since it answers at least a couple of the questions posed above. Probably you should also read reference 20. For what it’s worth, remember that Chris Landsea went over this paper with a fine tooth comb and found nothing to remark on with respect to the SST data used.
Re: sampling error, just to explain what my take on this would be.
If you just plot up a count of hurricanes, assuming the measurement method is near perfect, the bunch of numbers are just that: a bunch of numbers, which have little or no meaningful error.
The error “appears” when you start imposing a model on that data set. And the minute you do any maths on the data set – whether you intend to or not – you impose some kind of an implicit model. For example, if I take the average number of hurricanes per year, what am I actually doing – I’m implicitly suggesting there is some kind of an underlying process that has a mean value, and I’m attempting to estimate what that mean is. Likewise, if I compute a trend, I’m assuming the mean is changing in a linear manner through the series, and I’m trying to estimate the rate of that change.
As soon as I start doing that, the accuracy with which I can estimate the “true” values of my model parameters is governed by two things (assuming my measurements are near-perfect):
* the type of underlying model I have assumed (e.g. fixed mean, varying mean, distribution, autocorrelation etc.)
* the number of data points available
The former can be in error through model misspecification. The latter is a sampling error. Both have big consequences for the significance of any results that you calculate.
To summarise: the sampling error is the implicit error which limits my ability to estimate model parameters due to the number of samples I have available. Looking back at bender’s posts, I think this is how the term has been used, which seems technically correct.
I hope that helps to clarify things, rather than muddy the waters further…
Re issues on which region to look at in terms of SST. We published a paper a few years ago that looked at regional variability in global surface temperature trend
Agudelo, P.A. and J.A. Curry, 2004: Analysis of spatial distribution in tropospheric temperature trends. Geophys. Res. Lett., 31, Art. No. L222207.
Figure 3
this isn’t posted anywhere online and my online skills are limited to googling and blogging, so I won’t be able to get this diagram or article posted until monday. But it shows the regions where SST increase has been large vs small. I note here that this kind of analysis was NOT used in cherry picking the regions to look at for SST.
When we selected the SST regions for our paper, we used the “main development regions” for each basin used by the hurricane guys. In the atlantic, the main area of sst increase has been in the east (near africa), so the region we used (i think this is close to the region that emanuel used) is one of intermediate sst increase for the basin. If you look at hurricane tracks and see where the storms actually form and intensify, this main development region doesn’t seem very useful. so there is room to improve this type of analysis, but cherry picking by us to show large warming didn’t drive this particular selection
Re #114 and wind shear: for regions, we used the same main development regions used by the hurricane guys. Wind shear was defined as difference between 200 and 850 mb. The data were from the numerical weather prediction model reanalysis products. While the scale of these products is order 200 km, and magnitudes tend to be a bit smoothed out, there was plenty of year to year wind shear variability, it just doesn’t show up in the trend. A small trend in NATL wind shear was found; i think this is actually the AMO (starting at 1970 and ending in 2004 is not neutral in terms of the AMO, but doesn’t introduce a huge trend, either).
Re #136
In dynamic systems a single time-series is just one sample from a whole population of random possibilities. If you were to draw a second sample (which you can’t in reality, but could in theory, and can using replicated model runs) that sequence of counts would look different, because of random variation. In this sense hurricane count is subject to sampling error. The reason it matters is because we are interested in making an inference about temporal behavior re: the possiblity of a trend.
It is beyond me how Bayes is going to help you estimate the real probability that a hurricane is going to destroy your property. If someone can prove to me that insurance companies use Bayesian statistics for doing that, then maybe I’ll read up on that subject. Until then, it looks to me like a cheap dodge. “We can’t answer the important question, but here’s a seemingly related question we could answer.”
Re #138 Thanks, Judith. I do wonder about the accuracy and usefulness of data over such a sparsley-sampled region, and at only one level.
Re #135. Steve B., I agree,and I will e-mail Emanuel.
Regarding my data efforts, I’m first trying to reconstruct Emanuel’s SST curve in Figure 1.
To do that, I’m using the SST anomaly data from the GISS website, which says they use “HadleySST1v2” for pre-1980 and “Reynolds et al” for post-1980. I assume that these (Goddard, Hadley and Reynolds) are reputable sources and that there’s no big squabble between Hadley and Reynolds data post-1980.
Now, some comparisons:
First, I chose two periods for spot-check. One is 1998-2003, which is clearly the top of the Figure 1 “blade” and is anomalously high. The other is 1938-1943, which appears to be the peak of the last Atlantic multidecadal oscillation. I looked at five-year intervals, so as to minimize the impact of any single freakish year, and to approximate Emanuel’s smoothed-data approach.
When I look at Figure 1, and I estimate the difference between those two periods, what my eyeballs see is a difference of perhaps 0.25 to 0.30 units (which I assume is degrees C) per Emanuel. A clear difference.
When I look at the GISS-provided data, using Emanuel’s box (6N to 18N), what I get is 0.15C rise. (Now, it makes me uneasy that my numbers (0.15)don’t match Emanuel’s (0.25-0.30), but perhaps there’s a multiplier involved or his axis is in something other than C. I’ll keep crunching away, though.)
When I make the box 10N to 18N, what I get is a much-smaller 0.04C rise.
This spot-check indicates to me that the two periods (circa 1940 and circa 2000) are of essentially the same warmth in the 10N to 18N box but, if 6N to 10N is added to the box, then circa 2000 becomes “unprecendented” in warmth and the valley-shape becomes a hockey stick.
Why choose my box instead of Emanuel’s? Well, when I look at the storm-days (days of named-storm intensity) in the regions in question in 1998-2003, I get 3% that were in 6N to 10N and 97% that were in 10N to 18N. The percentages are similar for 1938-1943. It seems odd to use 6N to 10N in a box when that region had so little role in storm-days.
Comments (helpful, neutral, or acidic) are certainly welcome. Meanwhile, I’ll look for other data sources and continue looking at other GISS-provided periods pre-1980 to see if I can approximate Emanuel’s curve. Perhaps there is a problem is using the GISS data splice, but surely they have a good reason for the splice.
David
Never pick an arbitrary boundary when you have the option of doing a sensitivity analysis using variable boundaries. This tells us how robust your conclusions are to changes in boundary definitions, and saves you from the “cherry-picking” accusation.
Re 135, Steve, you say:
I was wondering what your source was for this statement.
w.
Re 137, Judith, thank you for your response. You say:
I’m not sure which paper you mean by “our paper”. In WHCC, you used the following definitions:
You specify the times involved as being:
To compare just the North Atlantic region, you used 20° to 90°W, 5° to 25°N, June through October.
Emanuel, on the other hand, used 20° to 60°W, 6° to 18°N, September only.
You must agree that his selection looks like cherry picking …
w.
#143 I hadn’t previously realized what SST region emanuel had used. I can’t comment on his motives for selecting that particular region/period, I have no idea what they were.
Re the different SST data sets, there are some differences between the hadley data set and the OI data set, that may not have been adequately sorted out. I will look into this, I agree that it is important. I have done a comparison study of some of the different SST data sets, but this comparison did not include hadley (I was focusing on the satellite-derived data sets).
Re #140: for confirmation that you are using the appropriate SST data, see
http://www.cdc.noaa.gov/Hurricane/
Re peak of the last AMO, it was 1950 based on the analyses that have been done. Note, the AMO has not been determined using the tropical SST; rather, the signal is highest in the higher latitudes. The tropical peak around 1940 is not peak of AMO, but apparently the peak of a 20 yr cycle (i’ve mentioned previously that this 20 yr cycle seems to be pretty important, and may conceivably be externally forced; solar or even lunar cycles). there is very little discussion of this 20 year cycle and hurricanes.
#107 Statistics should be as objective as possible. To use Bayesian statistics we must have a good theoretical reason behind our choice of prior knowledge or prior statistical evidence gathered in a classical manner which we know is truly independent from the new evidence we are using to refine our probability estimates.
Anyway the last paragraph has to do with estimation but I am curious when it comes to model testing does Bayesian techniques make hypothesis testing easier or harder. Here is the experiment. We have some prior knowledge and two intervals (An estimation interval and a verification interval). With classical statistics we don’t use the prior information so our estimate is not constrained to be near where we originally thought it was but it has a larger variance. With Bayesian statistics our estimate must be near where we originally though it was but t has a smaller variance.
If our original estimate is good then in both techniques there should be a large overlap in the likelihood functions obtained in the test and verification interval. In classical statistics the overlap is due to the larger variance. In Bayesian statistics the overlap occurs because we originally new roughly where the estimated parameters should be. Now the question is weather Bayesian statistics or classical statistics is likely to have more overlap in the likelihood functions obtained from the estimated interval and the verification interval.
As a side subject, unrelated to SST, there is the issue of the quality of historical storm data (number and intensity). There is no controversy in what follows, but rather it is just an illustration of the limitations of available data.
I looked at the percent of Atlantic tropical cyclones which spent at least part of their existence east of 50W (and south of 30N). This is important because is gives an indication of whether these distant storms were being detected in this sparsely-traveled region prior to reconnaissance flights and satellites.
(This uses the Unisys storm plots and my numbers would be better if I used storm-days, but I think the conclusion is good regardless of the database and despite my not doing the number-crunching for storm-days).
1900s: 14% of storms occurred east of 50W
1910s: 11%
1920s: 16%
1930s: 7%
1940s: 5%
1950s: 22%
1960s: 38%
1970s: 20%
1980s: 24%
1990s: 31%
What this tells me is that, prior to the 1950s, we were missing storms in the eastern half of the Atlantic, which (to me) is not a surprise. Then, using aircraft and putting more effort into finding storms, the number found east of 50W rose.
Also, eyeballing open-water storm plots prior to 1950, there were relatively few changes in intensities on the plots. This indicates to me that there was little basis (data) which could be used to note intensity changes of storms, so the recorded intensities were smoothed best-guesses.
Emanuel begins his PDI curve in 1950, which I believe reflects his agreement that pre-1950 storm intensity data is problematic.
The problem for anyone trying to see if the recent PDI is “unprecedented” is that we just don’t know the PDI for the last big “up” part of the Atlantic oscillation, due to a lack of quality data.
Judith, please take a look at Cohen and Sweetser’s paper in Nature in 1975. They identify a weak 22 year cycle in Atlantic tropical storm number and stronger 21.2 year cycle in the length of the tropical cyclone season. There are strong peaks at 51-52 years (AMO?) as well as around 11 years.
Re #142: Nature published Landsea’s critique of the Emanuel paper.
Re #143: Cherry-picking SSTs might be a fair charge if he hadn’t compared PDI with total tropical SSTs (in Fig. 3 and the related discussion). Also, looking carefully at the appended discussion from the paper, it appears to me that he may have selected regional SST data that gave the best correlation with PDI in order to take a first cut at the question of whether SST changes could suffice to explain the PDI increase. It turns out not. Had it turned out otherwise, then the question of which regional SST data was used would have become important. Note also that it’s not even the SST as such that’s key, but rather the difference between SSTs and atmospheric temps. Taking this combination of factors into account, Emanuel found that it still wasn’t enough to explain the PDI increase. He ends with a speculation that a complete explanation may require taking into account sub-surface temperatures, so obviously that will be a focus for further work.
“In theory, the peak wind speed of tropical cyclones should increase by about 5% for every 1C increase in tropical ocean temperature. Given that the observed increase has only been about 0.5C, these peak winds should have only increased by 2–3%, and the power dissipation therefore by 6–9%. When coupled with the expected increase in storm lifetime, one might expect a total increase of PDI of around 8–12%, far short of the observed change.
“Tropical cyclones do not respond directly to SST, however, and the appropriate measure of their thermodynamic environment is the potential intensity, which depends not only on surface temperature but on the whole temperature profile of the troposphere. I used daily averaged re-analysis data and Hadley Centre SST to re-construct the potential maximum wind speed, and then averaged the result over each calendar year and over the same tropical areas used to calculate the average SST. In both the Atlantic and western North Pacific, the time series of potential intensity closely follows the SST, but increases by about 10% over the period of record, rather than the predicted 2–3%. Close examination of the re-analysis data shows that the observed atmospheric temperature does not keep pace with SST. This has the effect of increasing the potential intensity. Given the observed increase of about 10%, the expected increase of PDI is about 40%, taking into account the increased duration of events. This is still short of the observed increase.
“The above discussion suggests that only part of the observed increase in tropical cyclone power dissipation is directly due to increased SSTs; the rest can only be explained by changes in other factors known to influence hurricane intensity, such as vertical wind shear. Analysis of the 250–850 hPa wind shear from reanalysis data, over the same portion of the North Atlantic used to construct Fig. 1, indeed shows a downward trend of 0.3ms per decade over the period 1949–2003, but most of this decrease occurred before 1970, and at any rate the decrease is too small to have had much effect. Tropical cyclone intensity also depends on the temperature distribution of the upper ocean, and there is some indication that sub-surface temperatures have also been increasing, thereby reducing the negative feedback from storm-induced mixing.”
Re #147: Note that in Emanuel’s FAQ he extended the PDI analysis back another 20 years for the Atlantic only. Also, whether the current increase in TC intensity is unprecedented or not is rather beside the point. The climate factors that are driving them now are prone to analysis.
Steve Bloom, thanks for the citation for your claim that:
However, the citation was to a “Brief Communications Arising” in Nature Magazine. Having written one of these myself, I know very well the constriction of the 500 word limit. Landsea did not question the SST data, and did not even mention the SST data … but that means nothing, as he only had 500 words to make his case about totally different problems with the study.
I have written to Emanuel to ask why he chose those areas and times, rather than the traditional areas and times used by Dr. Curry. He has been quite gracious and prompt in answering my questions in the past, and I will share his answer if I can.
w.
Re #147 Aircraft reconnaissance flights started in 1944. Emanuel said he chose to start in 1950 since that is when the reanalysis products began.
Intensity data prior to 1944 is almost certain to be totally useless. Landsea stated in several papers (prior to 2005!) that the data since 1944 in the NATL is “reliable.”
While i think the analysis of storms E and W of 50W is very interesting, it seems that there is some real E-W oscillation in genesis regions and tracks that would contribute to E-W variations on decadal scales. For example, i don’t think that there were more storms missed in the 30’s and 40’s than in the previous decades. But I agree that it is surprising to to see such a difference in the first half of the century vs second half.
In terms of number of named storms and hurricanes, i think that most storms were identified back to 1900. Another consistency check that we have used is to look at the ratio of number of hurricanes to number of total named storms. Five year averages of this number are amazingly constant back to 1900; prior to 1900 the ratio is much larger, indicating that a number of weaker storms were missed. The other consistency check we have used is to plot the total number of named storms against avg SST (five or 10 yr averages), and the two track as if the number of named storms were a giant thermometer, with the tracking breaking down prior to about 1880.
An interesting challenge to try to design little tests like these that might cumulatively allow us to assign some uncertainties to these numbers.
re #148 Doug thanks a ton for this reference, this is VERY helpful
Re #148: That does sound interesting. Unfortunately Nature charges extra for articles that old.
Judy, probably you already know about this, but John Fasullo has a paper in prep titled “Assessing Tropical Cyclone Trends in the Context of Potential Sampling Biases.” Also there’s a new hurricane paper (focusing on climate cycle teleconnections) in this week’s GRL by two guys I never heard of. It seems to be a growing field!
re 154: thanks steve, i’ll check out the GRL paper. The Fasullo paper addresses the data set since 1970. assessing the quality of the pre 1944 NATL data wide open. The HURDAT data is an unfortunate mess. I have two students that sent 15 pages to the best tracks committee of inconsistencies in the best track data relative to the designated landfall data. Apparently the only people with voting privileges on the best tracks committee are NOAA employees (which worries me).
RE #149: The question I have about Emanuel’s Figure 3, which you cite, is why does he use Southern Hemisphere SST data in Figure 3, in addition to the Northern Hemisphere, but does not use Southern hemisphere storms? Seems like apples and oranges.
I am still struggling to re-create the SST of Figure 1, and will search for a database curve-generator that can do the job. I did notice a note in Emanuel’s paper that, “This filter (equation 3) is generally applied twice in succession”, and the word “generally” opens the door to not using it for all years. That might explain the sharp rise at the end of the period. I assume that, in the middle years, he used the stated double-smoothing for all years.
Re 156, David, you say:
Chris Landsea, in his “Brief Communications Arising” in Nature, addressed this point, noting that the use of that filter leaves the final points untouched, and thus leaves the spike at the end of the Atlantic record. See http://www.atmosp.physics.utoronto.ca/~jclub/journalclub_files/Emanuel05-hurricanes-Communication.pdf#search=%22landsea%20emanuel%20hurricane%20SST%22 for Landsea’s analysis.
w.
Thanks, Willis. That explains the spike at the end. The SST in the box was quite warm in 2003 and 3004, but was cooler in 2005 and so far in 2006. I think I’ll update the end of the graph once Septemeber is finished.
Of equal, or maybe greater, concern to me is recreating Emanuel’s SST wiggles in the middle years, where the PDI seems to move in concert with the SST.
I have a statistics question: Emanuel uses double-smoothing. To take the absurd case, suppose he had used triple-quintuple smoothing and turned the curves into similar-looking lumpy lines. Can one properly use statistics to show a “correlation” despite using a lot of smoothing, or are correlations valid only on unsmoothed data?
Judith, thanks for the information above. I think we all agree that pre-1944 intensity data is of little value.
David
Re #150 Thanks, Steve, for the feedback. For me, the central question is whether, and to what degree, the recent tropical SST are unprecedented. If we are in the high part of a cycle and close to historical maximums, that is one thing. If there is no AMO cycle, and we are heading to the stars in temperature, then that is another, highly serious, thing. The shape of Emanuel’s curve implies (to me) the latter. It is a famous curve (repeated on RC) and I want to understand it.
The question of whether there is a correlation between SST in the seedling region of the Atlantic and PDI is, to me, a given. Everything else being equal, a warm seedling area (above 26.5C) will tend to generate more, and more enduring, storms, and that gives a higher PDI. Now, I don’t know how strong the correlation is, because there are other factors involved (like the famous desert dry air of 2006), but the correlation exists to some degree.
I also wonder if higher SST in the seedling area is, to an extent, a symptom of something else, like lower pressure gradients (= less trade wind), and so a time of higher SST is also favorable for reasons other than SST.
It is a complex subject.
Anybody have a link for Emanuel’s “additional material”?
In the North Atlantic, it is very difficult to deconvolute the causal mechanisms for the tropical SST variations over the last century, since the AMO and external forcing seem to be in synch since about 1850, which is the length of the historical data records. Mann and Emanuel’s analysis said that it was all global forcing. Trenberth said it was mostly AGW, with AMO contributing a small part. I say that you can’t do this deconvolution in the NATL until you have properly accounted for the 20 yr cycle since this seems to confuse our interpretation of the AMO. so the last word has not yet been said on this, obviously.
What Webster et al did (and see esp FIg 2 of my BAMS article) is to show that there has been an SST increase in all of the ocean basins since 1970, with each ocean basin having different modes of decadal variability (the natural internal modes for each basin are not in synch with each other). If you average over all the ocean basins and look at the longer time series, then you see that the basin averaged tropical SST pretty much follows the global temperature variations (forced by the combination of solar, GHG, volcanoes, pollution, etc).
So just looking at the NATL can tell you anything about AMO vs greenhouse warming, to infer anything about greenhouse warming you have to look globally (which was the main point of the webster paper). So this just defers the problem of explaining the NATL temperature variation back to the attribution of the global surface temperature variations.
The degree of smoothing will reduce the numbers of degrees of freedom which will decrease the likelihood of passing a significance test. I see more reasons for allowing smoothing with something like tree rings where (because we don’t understand mechanisms perfectly) previous year temps may affect this year growth or where a missing or double tree ring may mean that dating is off a year or so. I don’t see such a quick justification for that, in storm work.
I don’t know if Emanual does this, but there are some interesting tendancies by Mann to want to retreat to citing “low frequency effects” but to claim the validity of annual data. To have the cake and eat it too. However, when challenged to show interannual correlation, they are unhappy/unwilling. When challenged to bin data, Gavin was unhappy, “because there aren’t enough bins for statistical validity” as if it were the data’s fault that they weren’t numerous enough, rather then accepting that a limitation existed on what conclusions could be made.
Re #163
Judith, did you mean to write:
“just looking at the NATL can’t tell you anything about AMO vs greenhouse warming”
Re #160
Willis, that smoothing scheme sounds like the kind of fudge that I started off complaining about in my original post at RC. In the case of two noisy trends, the correlation coefficient will be directly proportional to the degree of smoothing. Therefore it is probably meaningless, except as a descriptive device to show there is a shared trend, however weak, between the two series. But to be fair I would have to see the details, the precise inferences that were attempted from the analysis, etc.
Smoothing reduces your effective degrees of freedom by introducing false autocorrelations that were not in the original series. It is a useful graphic device, but a dangerous statistical device.
#166 was a cross-post with TCO’s #164, hence independent corroboration.
Re #165
And here you have, in a nutshell, the entire problem with climate science: the data do not exist to make the conclusions that warmers desperately want to make. So they try to work around these limitations as best they can, “for the good of the planet”. Why do they do it? Because, assuming they are right, they are forced to because policy-makers are basically spineless.
yes, that was a typo, just by looking at NATL SSTs you CAN”T tell anything about AMO vs AGW
Re #168, bender
Sorry to be thick, but what do you mean here ?
Re #170
Let me try again.
Why do they do “whatever it takes” to work around these data limitations? Because, in their view, they have no other choice. Policy-makers won’t act on uncertain science, and so the scientists are forced to simplify the science in order to generate the forward momentum that both institutions want to see happen. They assume “no unnecessary harm done” because they really do believe their hypothesis is correct.
I got an answer back from Dr. Emanuel regarding his choice of areas and times to analyze. He wrote (in full):
However, it is simply not possible that he has done this for the Pacific. In the Atlantic, he used the September temperature for a particular area. But in the Pacific, he used the July-November average temperature. Since one of those months must have a higher “genesis rate” than the average of all of them …
Something’s not right. I have written asking for clarification.
w.
Consider the following thought experiment. Lets say it is 2050, and we have seen another 2C increase in global sea surface temperature, along with the projected increases in hurricane intensity, sea level rise etc., in short what the climate models have been projecting come to pass
In 2000 (circa now), we had some substantial scientific evidence supporting such projections, but the projections were by no means definitive at that point (remaining uncertainties regarding solar forcing, feedbacks, paleo record, whatever). Lets say we all (both realclimate and climateaudit) somehow agreed to assign a 50% likelihood that the scenario described in the first para would come to pass ca 2050.
In hindsight (from 2050), it would look like we should have undertaken an agressive AGW adaptation and mitigation policy. On the foresight side (from 2000), our view of all this is that “maybe” there won’t be a problem and it is certainly easier to do nothing, but if this really does come to pass, we are in deep doo doo.
So what should policy makers do? its called decision making under uncertainty, there are all sorts of models like precautionary principle, no regrets, etc (see Prometheus, they discuss this kind of thing alot). This kind of risk management is used regularly by the U.S. govt, on everything from military strategy, homeland security, preparing for avian flu epidemic, etc., based on likelihoods that are often far less than the 50% associated with AGW. Unlike homeland security, avian flu, etc., the U.S. has been adopting a close your eyes, cross your fingers hope for the best risk management strategy re AGW (we can argue about why, but big oil etc have somehow convinced the public that emissions reductions (which is not the only possible strategy) would mean the end of competitive enterprise and the american lifestyle).
As advocacy groups on the other side (i.e. we should do something about AGW) get frustrated by the tactics of Exxon Mobil, Competitive Enterprise Institute etc., they then promote every new scientific study as a reason to adopt their pet energy policy.
Then there are the assessments, which are very important and potentially useful, which are somehow expected to provide the “answer”, which of course they can’t. there is a mismatch between what the policy makers want from IPCC and what scientists can deliver.
Scientists are caught inadvertently in the middle of all this. While i agree with Pielke on the no regrets type of policies, i disagree with him that the science is irrelevant. We SHOULD try to keep improving our understanding, capabilities in climate modelling, data archaeology, etc. Assessments can be a useful tool if the task is framed appropriately and the right mix of people are involved and there is thorough independent oversight.
At this point, the whole policy debate then gets highjacked by emotional issues such as katrina.
and check out the brilliant (IMO) editorial in the economist
#173 — Judith, given the large parameter uncertainties in GCMs, assigning a 50% probability to the realization of their projections is wildly over-confident.
Also, a more subtle point, in the absence of knowledge, there is no “precautionary principle,” because — in the absence of knowledge — one doesn’t know whether whatever one does will make the future better, or worse, or effect no change at all. This uncertainty is even greater when the system includes chaos. I think a ‘no regrets’ policy makes far more sense than any other, given the absence of predictive knowledge.
Given that, the best policy is to do those things that preserve the wealth and technological capacities that will allow the most competent adaptation to whatever happens. That approach does not include scaling back power generation, or moving to fuels production methods that have a low positive returns on high inputs (like bio-ethanol).
I’d also observe that the activities of ExxonMobil or the Competitive Enterprise Institute are no more excessive than the antics of the Union of Concerned Scientists, or the NRDC or Green Peace who incessantly tout a science of doom and guilt.
After reading some of the testimony concerning predictive certainties given before Congress, and concerning the absolute futility of Kyoto, I think the tactic taken by the US presently would be pretty much the same almost no matter which major party controlled the presidency or Congress. Large cut-backs or re-organizations with no commensurate payoffs make no sense whatever.
re: #173
Judy Curry, it is my view that your thought experiment provides a good starting point for a discussion on how should we(and how will we) proceed on the potential of AGW and its effects. I would like to add some thoughts to your experiment and particularly with regards to the current political nature of the situation.
The hesitancy to act would appear to me to come from politicians who, while talking a good game, are not ready, without some catastrophic occurrence, to ask their constituents to make any present time sacrifices to mitigate a problem that has uncertain probabilities of occurring in the longer term future. One can take the more certain cases of unfunded liabilities for government health and pension programs and observe how the public reacts to those warnings for some guidance. Looking for groups such as skeptics/denialists and special interests to blame for the politician hesitancy is misreading the actual case in my view. The politically greener EU countries have not really accomplished much more than talk when it comes to controlling/reducing GHG. Kyoto has to be understood as more window dressing than substance.
I think the whole AGW policy situation must be handled on the basis of determining probabilities for projections of potential future climate conditions and what these climates changes will bring in the way of negative and beneficial effects. What it would actually take to mitigate the projected climate conditions and effects must be clearly stated and defined and not referred to with the wringing of hands and we gotta do something attitude nor one whereby the public is vaguely informed for fear of antagonizing them.
I remain a skeptic on the whole issue of AGW and I do not gain confidence in evidence that is revealed by scientists attempting to play the dual role of doing science and making policy. I take away no better understanding of what the potential effects of AGW could potentially be when I hear that they will all, uniformly, be negative. I became very leery when I hear about the near future tipping point (caused ostensibly by AGW) that will spawn catastrophic weather with less than good science or probabilities behind its projections. I admit that it might be too easy for my libertarian instincts to suspect some of these projections as part of a strategy to panic the public and clear the path for initiation of government action — much as was the case of WMDs.
My trust in the free market does, however, find solace in rising oil prices and in the ingenuity of man in the free market of ideas, with minimal government interference, of finding alternatives and making the AGW controversy at some future time a moot point.
Most sincerely,
From a resident of Northern Illinois waiting for the opportunity to sell our climate to Canadians looking for a warmer winter climate and coastal residents escaping the raising sea levels and tropical storms.
To decrease the “likelihood” below 50% for AGW, given all of the supporting research, I would argue that a credible competing hypothesis is needed to explain what observations we do have. Solar variability (probably the most viable alternative) does not have a credible case . AGW, with whatever uncertainties we put on it, remains the best explanation that we presently have.
I argue that it is precisely the Exxon et al. vs. the more extreme enviro advocacy groups, in the absence of any sensible federal policy, that has encouraged exaggerating the science on both sides (and much of this exaggeration actually comes from the media and advocacy groups, rather than directly from the scientists themselves).
Re what to do about all this, I have strong libertarian tendencies myself and am not a fan of Kyoto. I think the economist editorial is exactly on target and we need to get on with getting over “our addiction to foreign oil” George Bush quote. There is plenty we can do with “no regrets”. Establishing a “value” on carbon and trading carbon is a sensible free market, libertarian type thing to do. Once the federal govt stops subsidizing the oil industry, then there is plenty for the free market to do here.
Once we do that, climate researchers can get off the “hot seat” and play more of an evaluatory role and the need for alarmists on both sides will diminish.
173.A. I think you need to be VERY clear to differentiate objective, best estimates from calls to action. What you should not do is minimize or fudge or do anything like that on the 50% uncertainty if that is what you have.
B. Would also add real options based thinking. This is for instance the motivation to spend a small amount of money on a trial mine shaft, versus immediately making the bet on a large full mine. (Same thing applies with pilot plants/full plants, with all kinds of other decisions.) In the context of global warming, given increasing science with time (just look at all the “moving on” as evidence of that), it is likely that more certain decisions can be made in the future (and if you beleive in technological advance) that more effective mitigation and substition options will exist (of course the disadvantage is more buildup of the problem–but it’s still something to consider).
P.s. My “bet” is that there is something to AGW based on the simple idea of CO2 as a GHG and the observed co-rise in temps. I have very little reliance on the models, given the huge amount of parameters available for fudging things and based on the changes which have occured in their evolution over time (when the owners were not straightforward about how crappy the old models were, why should I beleive them that they are good now?)
Another very troubling thing to me is the lack of calls for out of sample testing by modelers and reconstructionists (true predictions).
Climate researchers as a group are not associated with specific calls to action.. IPCC does not specifically endorse Kyoto. The U.S. NAS did endorse Kyoto. 1600 of the worlds leading scientists (including nobel laureates) did endorse kyoto. If you check the names on those endorsements against the group of climate researchers actively conducting the research (including involved in IPCC), I suspect that you will find little overlap (an interesting exercise for someone; there are certainly almost no recognizable names to me on the list of 1600). Then climate researchers (like myself and IPCC authors) get lumped into a group of scientists (most of which aren’t climate researchers) that are are accused of meddling in policy and endorsing Kyoto. And the animosity of groups that don’t like Kyoto gets directed at climate researchers rather than the scientists actually making these endorsements. This whole thing is a mess really, its a wonder that climate scientists get any work done at all (like me, who has spent too much time this weekend blogging 🙂
Judith, you say:
First, there is a logical disconnect in your argument, a very common one, which involves the difference between GW and AGW. If the 2°C warming is from GW and not AGW, then every penny spent on “mitigation” (e.g. Kyoto) would be wasted. If it were a penny, I wouldn’t worry so much … but Kyoto is slated to cost not billions, but trillions of dollars.
There is a second problem with your argument, which is the underlying assumption that there is some kind of “mitigation” which will actually make a measureable difference. Kyoto, if it worked, was supposed to provide a 0.05°C mitigation by 2050 … whoopee … and that was our best “mitigation” option …
Third, we don’t have evidence that a 2° warming will cause terrible consequences or that we will be in “deep doo doo” if it comes to pass. Cold weather is much harder on humans than warm weather; hurricane increases (as you know) are still very much in question due to questionable data, short records, and the GCM predictions that the troposphere will warm faster than the surface; sea level rose by almost a foot in the last century without massive dislocations; we are currently at the cold end of the Holocene and polar bears survived times of no polar ice; drought is a bigger problem than heat, and increasing heat bring increasing rain; etc., etc.
Finally, is there actually anywhere near a 50% chance of a 2°C temperature rise by 2050? I have seen nothing that would convince me. The odds of a doubling of CO2 levels by that time are virtually nil, and the climate sensitivity to CO2 is small enough that even a very pessimistic analysis of the real odds does not foresee that kind of an increase from AGW. Nor is it probable from GW, given the upcoming Landscheidt Minimum in solar activity.
A thought experiment is only valuable if it has some relation to reality …
w.
180. My concern is not about scientists making calls to action. I would have no problem with that actually. My concern is that there needs to be a compartmentalization of absolute “let the chips fall” truth-seeking that is not skewed by desires for action. What I want is the “idealist”. I want the science equivalent of a judge who finds with the law regardless of personal sympathies or disagreements with the legislature. I want the liberal (or conservative) reporter who will still report the news completely candidly even when it hurts his side. Bottom line, what is done with the information (uncertainty) should NEVER change the reporting of it scientifically. No Schneider paradoxes for me. It’s the sword of Damocles on that one.
RE #172 The 6N to 10N portion of Emanuel’s box had virtually no genesis (tropical depression-strength or higher) events over the last 15 years. I don’t see how the 6N to 10N choice fits with his explanation.
On a personal note, the whole storm question is real-life for me. We housed storm evacuees for nearly three months last year, and my sister (the dummy) and her family stayed in New Orleans during Katrina. They had to swim to dry land. For several days we knew not if they were alive or dead.
I, too, have spent too much time on this blog this weekend, and must go work on (believe it or not) a bird-flu survival plan for my company.
David
Judith,
How would you respond to this summary:
a) the modest warming of the last 100yrs has been a net plus (strongly related to co2 or not). Most of the warming has occured in the higher latitudes in the winter (e.g. -40 to -30 … is that bad?).
b) co2 is increasing linearly and co2 warming ~ log co2 thus co2’s contribution to any future warming will be less than it has been in the past
c) the most likely warming future we can expect is more modest warming – a net plus for the next 100yrs as the planet moves ever so slightly from an arctic (mental image) to a tropical (mental image) environement.
I just cannot see the “call for dramatic co2 control action” in the above – especially given the high cost in the context of other more pressing claims on our resources.
Ask the forest industry of British Columbia, after experiencing incredible outbreaks of mountain pine beetle due to unusually warm winters for two decades. Your “tropical vacation” AGW scenarios are a bit simplistic, charles.
no quarrel with #180 in principle, but in fact this isn’t practical. most scientists would prefer to stick to the truth seeking part and forget calls to action or whatever and ignore the media and policy makers. In trying to be responsible scientists (and do what are institutions and funding agencies tell us we should do) we engage in various outreach activities, inform policy makers when asked, etc. When scientists do get involved in advocating policies directly related to their research (lets consider jim hansen and pat michaels), suspicion is cast upon their research and their “motives”. Scientists involved in advocating for policy that is directly related to their research have suspicion on their research, even if they themselves believe that they are being absolutely objective. We often find ourselves unfairly placed between a rock and a hard place
re 184, Charles, there are plenty of adverse effects, and some unfortunate social justice issues with many of the people being impacted the most being the most disadvantaged and unable to adapt. For example, a modest sea level rise will wipe out a big chunk of bangladesh, and we are looking at potentially of hundreds of thousands environmental refugees from bangladesh alone in the coming decades.
The other issue is the sheer rapidity of the change, makes it very difficult to adapt. Beyond the social justice and ecological issues, the potential adverse effects from a financial point of view are judged by the finacial sector to be pretty colossal (see UNEP FI documents).
Re #177: I appreciate you being here, and engaging in intelligent discussion. And I take your point re the need for an alternative hypothesis. However, don’t we have an alternative hypothesis – the Unknown Hypothesis?
The earth/solar system is large and very complex. It is not at all surprising to this layman that there is much that we don’t know about the planet, the climate system, and what drives it. Do we really know that apparantly rising temperatures are CAUSED by rising CO2 levels? And do we really know what will happen to temperatures if CO2 levels continue to rise? Do we fully understand the CO2 cycle, the degree to which higher CO2 levels are sequestered in vegetation (rising CO2 levels increases vegetation)? Do we really understand the role of the oceans as a CO2 sink relative to atmospheric CO2.
I personally am much more comfortable with the idea that we really don’t know what is happening than the notion that we should trust scientists who say that they are certain that they do know what is happening, but obfuscate, refuse to release data, fail to explain adjustments, or decline to allow replication of their work (and I am referring here to Phil Jones et al as well as the Hockey Team). Should I trust scientists who seemingly now accept that their 8 year old papers were flawed, still allow them to be used as foundation papers for a whole cluster of peer-reviewed papers? Should I trust scientists who name those who question them “denialists”?
Seems to me that the more sensible way to proceed is to acknowledge that there is much that we don’t know, and encourage disciplined, fact-based science to seek to gain more understanding, and then draw conclusions as to what we should do (if anything) to address the issues.
Judith,
What are the adverse effects of the last 100yrs?
co2’s role is diminishing right? how can you expect more adverse effects in the future than we have seen in the past?
where can i find a good comparison of the cost of co2 control compared to the net change in the adverse effects resulting from the co2 control?
thx
My link in 174 to the economist article didn’t work (i give up), here it is with spaces in the url
http://www.economist.com/ opinion/displaystory. cfm?story_id=7884738
This editorial addresses Charles query re the costs at least briefly. I bet there is more in this issue of the economist (which hasn’t yet hit the newstand, i have been checking).
The point is that we have been fighting this crazy “war” without spending enough time actually looking in a serious way at the various options and their costs. yes i’m sure there will be winners and losers economically (but potentially little to no net hit on the U.S. economy, depending on how this is done), but we need to reduce our dependence on oil at some point anyways, and looks like economics of rising oil prices are motivating alternative energy anyways
Re 187, Judith, thank you for your analysis. However, it seems you’ve bought into the “sea levels are rising, everyone panic” meme.
Worldwide, we’ve seen a sea level rise of about a foot in the world’s oceans in the last century, certainly what one would call a “modest sea level rise” … but where are the “hundreds of thousands of environmental refugees” you are predicting?
Regarding Bangladesh, there are not too many years of tide data. These, however, show about 400 mm of rise since 1980. The nearest longer term tide station is in Calcutta, a couple hundred miles away. There has been 600 mm of sea level rise in Calcutta since 1935 (see http://www.pol.ac.uk/psmsl/pubi/rlr.annual.plots/500141.gif). Now that’s two feet of sea level rise, in a very short period of time … … but where are the “hundreds of thousands of environmental refugees” you are predicting? We have seen exactly none from Bangladesh, despite the “sheer rapidity of the change” in sea level.
Finally, you say that “many of the people being impacted the most being the most disadvantaged and unable to adapt.” However … we don’t have a clue who will be the most “impacted”, nor if the impacts will be negative or positive, since the GCMs are acknowledged even by the modelers to be useless at regional scales. So how can you possibly make a claim regarding who will be “impacted”?
These rumors of impending disaster need to be carefully examined, on a one by one basis, before we get too swept away by the enthusiasm.
w.
Willis, the present and projected impacts have been documented ad nauseum elsewhere. Re Bangladesh, my colleage Peter Webster has substantial expertise and experience in working with the Bangladeshi on flood forecasting. There are massive and horrendous issues in Bangladesh, even without global warming. The southern part of the country is frequently flooded during the monsoon season, for weeks at a time. any sea level rise or major hurricane hitting bangladesh has the substantial likelihood of major loss of life. The USAID and the Asian Disaster Preparedness Center (who fund Peter’s flood forecasts in Bangladesh) are very very worried about the prospect of a massive number of environmental refugees from bangladesh in the coming decades. Believe it or not, I don’t shoot off enthusiastically about things I know nothing about.
I think more than looking for environmental refugees from Bangladesh, we should wonder why we haven’t had hundreds of thousands of refugees from the Netherlands, which is much lower than Bangladesh. The reason we don’t have them, of course, is that the Netherlands is a highly developed place with lots of money available to stop the flooding danger. This technology would be available for the Bangladeshi as well if they are allowed to develop to a modern level. The real danger is that their economy will be stagnated in the name of saving the people.
Re 190, Judith, you recommend the Economist article. Unfortunately, it is extremely long on dubious claims, and extremely short on citations.
It makes claims about the costs, for example, saying:
Oh, really? Which economists? Which models? Who did the “most estimates”? Unfortunately, the editorial doesn’t say a word about that …
Then they go on to say:
Now, this is pure nonsense, undiluted bovine waste products. Canada will not meet its target, and is considering dropping out entirely. The EU, by and large, will not hit their targets. CNN reports:
And Japan, like Canada, has a Kyoto target to reduce its GHG emissions by 6% below 1990 levels. However, as of May 2006, Japan’s emissions were 13% above 1990 levels. Japan will have a lot of trouble meeting the targets. In addition, Japan, unlike other signatories, refused to sign unless they faced no consequences if they did not meet their targets, so they have little incentive to meet the targets.
With this much reality distortion, utter untruths, and lack of backup information, I wouldn’t trust a word that the editorial said.
w.
Judy: My concern is more with scientists actually allowing bias to creep into their work rather then being accused of it by partaking in policy discussions. I would much prefer a flaming liberal, neo-Luddite, who I knew that I could trust to tell me whatever story the data leads to (and the converse). I want the judge who doesn’t agree with the death penalty, but who will send a man to die if that’s what the law says.
Compounded with the issue of bias is such sloppy practices on stats (and it’s not so much lack of physicist level math knowledge as it is lack of critical thinking) that there is lots of room for getting bad studies out. When you add in the biases towards wanting to publish positive (in the sense of significance) rather then negative reports, it all builds towards poor work.
)broken record) Note: I’m not saying that people shouldn’t strive for whatever story they can get, shouldn’t publish with imperfect data. (Some of the skeptics here think that we need to correct every instrumental data point for growth of trees in the vicinity! That is obstructionism.) I think that unpublished work is wasted work. It’s just that you may need to step back from puffery and be more matter of fact about what you have. And Science/Nature are full of papers that are glorified press releases (I know of one from personal experience which had a falsification in it.) Those pubs really do attract some young Turks who are more interested in building empires then in being classical good scientists. Publish in the quality specialty journals. And not letters journals either (unless you really have a ground breaking result and follow up with a real paper and given the way things really work…just no damn letters journals. They suck.) (/broken record)
re: #192
You have pointed to the real problem when you note sudden flooding is currently a problem even without global warming and yet people continue to live in these regions because they have knowingly chosen to take the risk of dying and losing their possessions from, not the unknown steady increases in sea levels, but rather predictable occurrences of sudden flooding. One can note that some or even many have little choice in the matter because of their economic conditions, but than one has to ask what is being done currently to mitigate a rather predictable reoccurrence of human suffering.
I also have a very difficult time visualizing how people will, if necessary, react to gradual increases in sea levels and I suspect the experts do also. I think a lot of what passes for predictions of catastrophes in these cases does not (and probably cannot anyway because the experts are not sufficiently knowledgable to forecast the results of human ingenuity) take adaptions into account. I do know that if we subsidize people to remain where they are and continue doing what they are that the resulting lack of adaption could well lead to catastrophes. If I were to project all the rise in sea levels over a given time occurring instantaneuosly than I would agree that predicting the consequence becomes much less difficult.
I would also agree with the essence of Dave Dardinger’s post in # 193.
Re #192, Judith, thank you for your response. You say:
Certainly, flooding is a problem for Banladesh, as it always has been. However, I have just presented evidence from the PSMSL that Bangladesh has experienced a rapid two foot rise in sea level since ~1940 without resulting in your “hundreds of thousands of environmental refugees”. It seems to me that the onus is now on you to present some counter evidence to support your belief regarding the hundreds of thousands of refugees.
Saying “the projected impacts have been documented ad nauseum elsewhere” does not provide such evidence. Saying, in effect, that ‘lots of scientists are worried about it’, I fear, means nothing, particularly on this site … we’ve all seen that scientists can be wrong in wholesale lots, from the time of Isaac Newton onwards.
Let me break it down to the bare bones:
1) You said that a fast two foot sea level rise will result in “hundreds of thousands of environmental refugees” from Bangladesh.
2) I documented the fact that we’ve seen a fast two foot rise in Bangladesh in the immediate past, without a single environmental refugee.
3) You say, in effect, “lots of scientists say it’s going to happen, they’re very worried about it” … well, yes, I agree, there is currently an epidemic of worried scientists.
But we’re not talking about whether scientists are worried. We’re talking about whether a 2 foot sea level rise will result in hundreds of thousands of environmental refugees. I have presented evidence that it has not done so in Bangladesh, or in Calcutta.
What evidence can you present, not appeals to authority like Peter or USAID, but evidence that convinces you that, although it didn’t happen with the last rapid two foot sea level rise, it will happen this time?
w.
PS “¢’¬? You say “Believe it or not, I don’t shoot off enthusiastically about things I know nothing about.”, and I’m sure that is true.
However, as Artemus Ward commented, “”It ain’t so much the things we don’t know that get us into trouble. It’s the things we do know that just ain’t so” … and he assuredly wasn’t just talking about me …
The idea that a bunch of central planners can direct the world’s economies to switch from cheap energy to more expensive energy at little or no cost should have gone out the window with the USSR’s first five year plan. Does anyone really believe that? If so I’m astonished.
Of course they tell us it will be cheap. When someone wants us to do something we don’t want to do, do they ever tell us anything else? And it’s not the American lifestyle that concerns me nearly as much as the lifestyles of those unfortunates who are living on the edge of survival already.
Re #173,
A similar thought experiment might be one concerning DDT. Lets say we have a very effective pesticide which some studies seem to show may have adverse effects on wildlife. Instead of studying further and considering intermediary steps such as limited applications, lets assume that we have to act now and aggressively and just ban it. Forty years later after a million or more people, mostly poor children, have died every year because of the ban, all we can say to them is “oops guess we should have been using it all this time”. But of course that isn’t a thought experiment, it’s history. Do we have to repeat it?
Re #177 – **To decrease the “likelihood” below 50% for AGW, given all of the supporting research, I would argue that a credible competing hypothesis is needed to explain what observations we do have. Solar variability (probably the most viable alternative) does not have a credible case . AGW, with whatever uncertainties we put on it, remains the best explanation that we presently have.**
Why not spend more time on Solar variability research than “thought experiments”? If your AGW remains the best explanation that you presently have, then you need to do much more work on other items than CO2. Because CO2 is a statistical association that has been trumpeted by too many. Maybe too many have been ignoring the Solar effect?
Hey Gerald, please be polite. It’s an interesting discussion. Let’s keep it civil.
Judith,
The problem I have with that argument is that is that if the uncertainty is high, then the “best explanation” can still be a poor explanation. So the “whatever uncertainties we put on it” part matters.
Re #198 t[snip]
A recent Washington Monthly article covers the current situation thoroughly, although it spends little time on the history. From the article:
‘This preoccupation with DDT, however, is largely a distraction. Environmental leaders now agree that the pesticide should be used to combat malaria; few nations in Africa ban it; and USAID has agreed to spray DDT in countries like Ethiopia and Mozambique. What’s more, DDT is no silver bullet. Malaria experts agree that it reduces transmission, but emphasize that it must be combined with other interventions, including ACT. The furor over DDT has undoubtedly hampered efforts to provide better access to antimalarial drugs. When another malaria expert met with Senate staffers to discuss malaria in 2004 and 2005, they badgered him about DDT. "I tried to explain the reality," he says, "and people in the U.S. say ‘That’s not what I was told.’" "DDT has become a fetish," adds Allan Schapira of WHO. "You have people advocating DDT as if it’s the only insecticide that works against malaria, as if DDT would solve all problems, which is obviously absolutely unrealistic."’
Re 177, Judith, you raise an interesting point when you say:
However, this seems to be science in reverse. You say AGW is “the best explanation that we presently have”, but what is AGW “the best explanation” for? What is it that we are looking for a “credible competing hypothesis” to explain? What “observations” are we trying to find reasons for?
In order to require an “explanation”, we first need some kind of anomalous phenomenon to explain. We don’t look for “explanations” when the day is warmer than the night, that is just natural variation. We look for explanations when something out of the ordinary occurs, some anomalous happening that is not in the natural order. So just exactly what is this anomalous phenomenon that you are talking about?
We know from the ice cores that the current temperature is by no means the warmest in the Holocene. In addition, there is good evidence that both the Medieval and Roman warm periods were warmer than today. We know that the Arctic Ocean has been ice-free in the summer several times during the Holocene. We know that the temperature increase from 1910 to 1945 is statistically indistinguishable, in both length and trend slope, from the temperature increase from 1970 to 2005. We know that the Arctic was warmer in the 1930s than it is today. We know that Alaska warmed up about 2°C from the PDO shift in 1976-78, and hasn’t warmed significantly since then. We know that the world cooled from 1945 to 1970, while CO2 levels were skyrocketing. We know that the world has been warming for the last 300 years … so tell me, just what is the anomalous phenomenon for which we need a “best explanation”?
I would argue quite the opposite. I would say that the null hypothesis is that the current climate is the result of natural variation in the climate system, and that it is up to the AGW folks to provide evidence, not computer models but evidence, to disprove the null hypothesis and show that it is not natural variation. I have seen no such evidence to date.
Once it has been shown that we are looking, not at natural variation, but at something out of the ordinary, at that point we can start to discuss competing hypotheses to explain that phenomenon … but until then, I don’t see that there’s anything to discuss, because we don’t know what it is that we’re trying to explain.
w.
PS “¢’¬? There is a regrettable tendency among AGW advocates to mistake “we don’t know” for “humans did it”.
Much about the climate system is unknown, much remains to be discovered. However, to say “our computer model has added up all the known forcings, and the model still doesn’t explain the current temperature” merely means “we don’t know” “¢’¬? the fact that we don’t know the cause is not evidence that humans are the cause.
#202
Yes, the nil hypothesis states that there is no phenomenon.
MBH9X. But if they applied a dynamical model that assumes ‘nil hypothesis is false’, then its all wrong. Hard to tell, in [1] it is said that
(not my emphasis)
[1] Mann, M. E. & Lees, J. Robust estimation of background noise and signal detection in climatic time series. Clim. Change 33, 409–445(1996)
Re 198/201
I don’t think Steve M would be keen on a DDT discussion here.
Well, Dr. Emanuel kindly and quickly answered my question about how he chose the times and areas, saying:
Unfortunately, this does not begin to explain why he used only September for the Atlantic, while using July-November in the Pacific. In the Atlantic, only a third of the hurricanes are in September. This leaves two thirds of the data points outside of the time when the temperatures were taken.
In addition, although September is the month used for the temperatures, August to October is the time period used to determine the “genesis points”, which adds another layer of inaccuracy to the equation. And that’s not the end of the questions … here’s the August – October genesis points which Dr. Emanuel says he used to determine the appropriate area of the ocean from which to take the SST.
As you can see … there’s no evident reason for the choice of area to compare.
w.
sorry, i don’t have time to argue all the entire greenhouse warming thing on the blog. i will tune in tho for anything on hurricanes or general posts on insuring the integrity of science
#204
Agreed. I’m still interested in the original topic: Is there an AGW signal in the hurricane record or not? How do we tell? Also, will we be having the same debate in 20 years, or will it somehow have been resolved?
This is just a specific case of a more general question. Assuming the world has at least a few decades (ignore “tipping points” for the moment) before needing to make any final decisions about hypothetical AGW, what should we be doing today both to reduce uncertainties (increasing the likelihood that the decisions we ultimately make will be “efficient”) and to help relax the polarization of this debate (which may not be universally desired, either)?
A number people at this site (Ross?) have already remarked on the similarities between the situation of Economics in the early 1970s and Climate Science today. There was enormous polarization back then, and — much like today with respect to Climate Science — a lot of it was connected with models. Keynesians claimed to be “the consensus” (Richard Nixon, famously and inexplicably, had remarked that “we are all Keynesians now”). Yet there was that little group in Chicago, led by Milton Friedman, constantly finding flaws in the Keynesian view.
Also, at the time the “positive” debate was horribly tangled up with “normative” issues (dealing with poverty, e.g). Serious discussions about the “science” usually devolved into debates about the merits of denying children food and clothing.
I’m not sure how it all got resolved — there was certainly some truth in most of the positions — but IMHO the debate did ultimately lead to a way forward. A couple of things are obvious: First, a lot of effort went into improving (consistency and accuracy) measurement of economic variables, so we all (pretty much) can now agree on the data. Second, as far as I can tell, I think most people now understand that our 1960s-era confidence in the econometric models was misplaced (or at least we now recognize the huge uncertainties), whether it’s the Laffer curve, the large econometric models, or whatever.
In part this may be due to advances in understanding how complex systems behave — that system behavior may not be derivable from knowlege about the behavior of all the system components. Coming to terms with the fundamental difficulties of modeling (nearly) chaotic systems brought a recognition that the debate about whose model was “right” represented something of a false conflict.
Obviously, huge issues remain related to social justice, efficiency, fairness, etc. These are real, but can often be easily separated from the factual questions (the “normative” versus the “positive”).
Which gets back to the original question: What should we be doing now so that in 10 or 20 years we will be able to provide convincing evidence about the relationship between hurricanes and, say, CO2 concentrations?
If that is not a reasonable question to ask, perhaps someone can enlighten me as to why.
Re #205
Wherever there is data framing (dataset subsampling in space or time) there is potential for bias and thus for cherry-picking. In such cases it is necessary to do a sensitivity analysis to examine the influence of framing on the relationships of interest. In the mundane (& hoped-for) case that the relationship is insensitive to changes in framing, the analysis should not be presented with the main paper, but be made part of the supplementary diligence submission. This should be standard protocol for the earth sciences.
Judith, I have two hurricane questions. If you can comment (brief is fine, I know you’re busy), that will be much appreciated:
1. I’ve read that stronger surface winds (trade winds) in the genesis region mean more mixing of surface water with cooler subsurface water. This leads to cooler surface temperatures. Have there been any studies of SST versus trade wind strength? I’d love to see a long-term plot.
2. I saw an atmospheric cross-section showing the future tropical atmosphere in an AGW world. This showed more warming at the upper levels (200mb) and especially in the mid levels (circa 500 mb) than at the surface. To me, it seems like that would be a more stable atmosphere compared to today, and would tend to decrease storm strength. It would also tend to reduce the amount of thunderstorms in the tropics, which would tend to reduce the mid-level humidity, which would also tend to decrease storm strength. Are there any articles that talk about the various storm factors in a warmer world?
Thanks
Willis (205),
It looks like KE chose to use genesis in the open ocean and not the Caribbean or Gulf of Mexico. In those latter two sub-basins, landfall (or passing over an island) could occur shortly after genesis, which will alter the storm’s energy budget, often dramatically. The storms in the open waters have a better chance for a long enough life to make his analysis suitable.
In a week or so, I will read his paper again and see what he says.
This idiotic Economist editorial asserts that ice core studies show places where temperatures rose by “as much as 20 degree C in a decade”. Does anyone know of any ice core showing that big a movement ?
Re #210
Seems reasonable, but then why not use the slightly larger “box” (18°W-63°W, 5°N-20°N) – which excludes fewer data points and divides them up a little more naturally?
#204
I don’t think Steve M would be keen on a DDT discussion here.
Wasn’t trying to start one.
I was using it as an example of the futility of the kind of thought experiment another poster had used and the possible consequences of applying thought experiments to policy. Thought experiments to come up with a hypothesis are one thing. Thought experiments to justify particular policies are quite another.
That thought experiment (refer back to #173) is useful if you want to understand the origins of the idea of a “no regrets” policy. My problem with it is the way it was formulated: it assumes the consequence. If the current warming trend continues for another 50 years, as forecast by some computer model, that does not imply the model that produced the forecast is correct. Suppose some factor other than CO2 is driving the current warming trend. If that factor were to continue its effect for another 50 years, then you’d get the right forecast for entirely the wrong reason. The point is, as soon as that other factor becomes uncorrelated with CO2 then the CO2-driven model would start, mysteriously, producing bad forecasts. All of a sudden your “no regrets” policy would be shown to be based on a flawed model, causing much regret over lost opportunities.
i.e. That you decide to wait 50 years for additional data does not guarantee you are getting independent sample (out-of-sample verification test). If the unknown drivers of the past continue their trend into the future, then the sample is not independent and the verification test is invalid.
Re #205: Willis, are you quite sure you’re using the same criteria? “Hurricane start point” needs careful defining. Is it exactly the same thing as Emanuel’s “genesis point”? One would get rather different results with the starting points for “invests” vs. TDs vs. TSs vs. hurricanes, even just looking at the storms that ultimately became hurricanes.
Spoken like my preferred kind of scientist.
re: #213
Barney, I thought the example was a good one and to the point.
Re # 214,
That was my point. In the DDT debate the consequences were assumed to be one thing with little thought given to what price would be paid were those assumptions wrong. An environmental catastrophe was envisioned based on very little or very equivocal actual evidence and a short-sighted policy was rammed down everyone’s throat because a ‘consensus’ had supposedly formed. And now we get comments that because DDT wouldn’t have saved every single life lost that it wasn’t a very big deal anyway and besides organizations are starting to allow its use again so what’s the problem. Its a pretty big deal to the millions of people who are dead because of bad policy based on ‘crisis’ driven policy.
Again this isn’t about DDT. Its about the process of ‘consensus’ and stifled debate that leads to faulty ‘thought experiments’ where the supposed ‘crisis’ drives the assumptions and the people on the margin can end up quite dead.
Re #214: As Carl Sagan used to say, well, maybe. My advice? Get thee to a priory. 🙂
I think you’re missing the main point about “no regrets.” This refers to policies that work to mitigate AGW (generally linked with air quality), foreign oil dependence and peak oil. The idea is that a given policy change will be valuable even if it turns out to be helpful for just two or even just one. A good example is improving vehicle fuel economy, which has the added bonus (if current headlines are any indication) of allowing for the survival of a domestic auto industry with U.S. ownership.
#219,
A good example is improving vehicle fuel economy, which has the added bonus (if current headlines are any indication) of allowing for the survival of a domestic auto industry with U.S. ownership.
I’m not sure how mandating that mileage be increased would allow for the survival of a domestic auto industry when those are the very vehicles which foreign producers excel at. Every period of high fuel prices in the past (which after all is merely a market mandate of increased fuel economy) has accelerated foreign penetration of the US market.
This is a perfect, and I mean perfect example, of the kind of unintended consequence that comes from policies based on unwarranted assumptions.
Steve, you can quote Carl Sagan, I’ll stick to Milton Friedman; “There’s no such thing as a free lunch”.
Re #219
Not missing any point. Get thyself to a … [Ignore On]
Re #218: Barney, it’s very sad that you’re just repeating disinformation about the history of DDT use. The problem with the environmental effects of DDT is primarily related to its large-scale use for agricultural purposes rather than to its small-scale use for malaria control and eradication. It is certainly true that in the early days of large-scale indiscriminate use of DDT it was effective for both purposes, but around the same time the environmental effects (e.g., shell thinning in bird eggs, reduction of beneficial insect populations) were noticed it was also becoming clear that mosquitos were becoming resistant to DDT, and that long-term agricultural use would ultimately just result in substantially resistant mosquito strains that would render DDT useless. There has been and continues to be plenty of debate in the field of malaria epidemiology, but not on these points (despite the efforts of Crichton, Lomborg, junkscience.com etc. to recast reality to the contrary). See, e.g., this comment from 25 years ago (letter exchange in Nature Vol 294, 26 November 1981, pages 302,388):
“It is generally agreed among malariologists that agricultural insecticides have made a contribution to selection for insecticide resistance in mosquitoes and that such resistance has made a contribution to the resurgence of malaria in Central America and South Asia.”
RE: #215 – looks like he might have simply picked two longitudes which would encompass the more eastern genesis areas, filtered the entire coordinates set with that, then, selected bounding latitudes to encompass most of the filtered data.
Whoever said that I probably wouldn’t want to host a discussion on DDT is right. No more DDT please. Lots of other places that it can be discussed.
Re #220: It seems we don’t disagree on the market dynamic at work here: High enough fuel prices + a continuing refusal by the native auto industry to accept high mileage standards + sufficient time = no more native auto industry.
But could you explain what you meant by this?:
“Every period of high fuel prices in the past (which after all is merely a market mandate of increased fuel economy) has accelerated foreign penetration of the US market.”
I agree with the main thought, but the parenthetical phrase seems to say that increased fuel economy mandated high fuel prices. Interesting if so!
Re #224 and 225,
To both Steves,
As I said I was only illustrating the problems with what I consider poorly designed thought experiments. I’m not interested in a DDT debate here either.
Steve B,
You have it backwards. I’m saying that the market mandated better fuel economy through higher fuel prices.
re 219 & 220
Improving domestic fuel economy standards is a perfect example of a no-regrets strategy from a national (balance of payments perspective) and energy independence/security, but I would agree that it is not necessarily in the short term interest of the big 3 automakers, who for several years have relied on a product differentiation strategy focusing on horsepower, size, and comfort. While this may be changing slowly because of sustained higher gasoline prices, the fact is that they have no one to blame but themselves for this situation; they could easily make vehicles using available off-the shelf technology 25% more fuel efficient. Over the last 25 years fuel efficiency improvements have all been used to increase horsepower and/or vehicle weight.
The problem of course is that automakers have spent billions of dollars conditioning consumer preferences so that all that matters is the 0 to 60 factor and the supposed safety benefits of heavier vehicles (soon we’ll all be driving tanks).
So what’s the downside of higher fuel efficiency standards — about 2 seconds acceleration and a little less leg room. One wonders how much more quickly we could solve this particular problem if Ohio and Michigan weren’t swing states….
Since my point (#214) on the thought experiment (#173) appears subject to misinterpretation (#214), allow me to clarify. The assumption in the thought experiment is that at some point down the road (say 2050) we have enough data to re-evaluate the question, and at that point it may become clear that the “no regrets” policy was indeed necessary to avoid disaster. I want to point out that the time-frame required to reach this stage may be quite a bit longer than that. Suppose it is not CO2 causing the current temperature rise, but something else we (including Carl Sagan) don’t yet have a handle on. If the causative agent continues to be correlated with CO2 trend, then a 100-year long shared trend will be no more convicing than a 50-year long shared trend. Confounding is confounding, regardless of the time scale.
I was not arguing against “no regrets” strategies. I was arguing that your time frame for evaluating the wisdom of a particular strategy may be a lot longer than you think.
And may I point out that discussion of energy policy, however interesting, is way off thread? This is primarily about the statistics of trend analysis, and secondarily about ocean-atmosphere processes underlying storm dynamics.
Re 210, Kenneth, you raise an interesting point when you say:
In addition to benders response in 212, wondering why not use a larger box in the open ocean, there’s a logical fault in your comment. This is that Dr. Emanuel was not using his box to select hurricanes to analyse and thus wanting to exclude, say, hurricanes that would pass over land. He was not selecting hurricanes, he used all of the North Atlantic hurricanes in his analysis.
Instead, he was just using the box to determine the SST to which he would compare the hurricanes. Here is where things start to look wonky. This is especially true when we remember that a) he didn’t look at where all of the hurricanes started, just the August – October hurricanes, and b) he didn’t use the August – October SST in the box for his analysis, just the September temperature.
Is this a difference that makes a difference? Very much so. Here’s the start points for the whole season, rather than just the August – September hurricanes used by Dr. Emanuel:
A couple of things are worth noting. Of the early season hurricanes (black triangles), only 16 of 101 (16%) started in Dr. Emanuels box. Of the late season hurricanes (blue squares), not a single one started in the box. And finally, overall only a third (32%) of the hurricanes started in the box defined by Dr. Emanuel (red rectangle).
Since a majority of the remaining hurricanes started in the Gulf of Mexico or the Caribbean Sea, where sea surface temperatures are very different from those in Dr. Emanuel’s box, it seems clear that any correlations found in the North Atlantic portion of Dr. Emanuel’s study should be taken with a very large grain of sea salt …
w.
PS – seems to me the correct way to compare the PDI to the SST for Atlantic hurricanes is
1) Define a box and a time frame, say Dr. Emanuel’s box and August – October as he has done.
2) Compare the PDI of hurricanes that started in that box and in that time frame to the SST in that box and in that time frame.
and the wrong way to do it is
1) Define a box and a time frame, say Dr. Emanuel’s box and August – October as he has done.
2) Compare the PDI of hurricanes that started anywhere in the North Atlantic to the SST in that box during some other time frame..
Re #228: *Very* briefly, I think there’s a definitional confusion here. A major point of “no regrets” is that there needs to be a very short-term if not immediate benefit from one of the non-AGW aspects (i.e., oil imports or peak oil) such that adoption of the policy is desirable regardless of any postulated longer-term AGW benefit. Put another way, the idea is to be able to avoid the discussion about the 50-100 year time frame.
I should mention that anyone interested in “no regrets” policy can go here or here, or for peak/imported oil discussion here.
Re #148: I was unable to locate an on-line copy of the paper Doug mentioned and am unwilling to pay Nature’s highway robbery charge above and beyond the subscription price I already paid, but I did notice that it got a mention and a one-sentence review in an Elsner et al paper that seems to cover the same ground much more rigorously. As best I can see from a quick scan it finds a solar cycle influence on Atlantic hurricane frequency, but only a small one. Bear in mind that this paper is nine years old.
Also, note that Elsner’s pub page contains a raft of papers (most of them more recent) on hurricanes that I haven’t read since only a couple of very recent ones pertain to intensity rather then frequency.
Oh yes…
Good news for bender: Elsner’s a *serious* statistics wonk.
Bad news for bender: He’s a Bayesian! 🙂
I feel a little out of place with this comment since reply #230 looks like breaking news, but I have been thinking about it for awhile and I am not sure my thinking is correct so I’ll go ahead and post it.
re: #228
Bender, you have brought up some points about out-of-sample results for testing an AGW hypothesis that I would like to see discussed further in perhaps another thread (or describe the problem as determining out-of-sample trends to get around the complaint in #229). You are obviously correct in your comments but I would like to see those thoughts expanded to consider lengths of times and concentration level changes, up or down, of GHGs that would be required to test AGW hypothesis out-of-sample. Maybe gaining a complete or nearly complete understanding of the physics of GHG effects on climate, sans the fudge factors, is the most efficient or only way of testing the AGW hypothesis, but that should only properly be used to explain past data without data snooping.
If human-originated GHGs and temperatures are tested out-of-sample for a given climate prediction we can do the statistics to determine the significance of the correlation after we have obtained enough data points. We cannot obviously have generated multiple model predictions and then pick and chose amongst them without making the necessary adjustments to the statistics.
Cause and effect is, of course, something that the statistical relationship cannot prove, but only not contradict. Confounding factors could work, as you noted, in concert with the predicted temperature versus GHG relationship and thus we could statistically out-of-sample confirm a relationship that is not related by cause and effect or the confounding could work counter to a true cause and effect relationship that would have been rejected out-of-sample because of some poorly understood or recognized aerosol-like effect is operating. But without understanding the physics of the climate sufficiently to account for past temperatures without fudge factors and data snooping isn’t out-of-sample with all its potential for confounding all we really have.
Oh, yeah we have far past temperature anomalies to which we can look for comparison to the current anomaly that might give us comfort or unease, depending on what they are, but they could have confounding problems also. We have the other obvious problem, dear and near to this blog, of accurately measuring temperature anomalies with proxies.
If I can argue that we may have to settle for out-of-sample testing with all its problems then the next question I would ask would be what times and temperatures do we need to show statistical significance.
Re #230
Good chart. To me, what Emanuel is displaying is a genesis correlation rather than a thermodynamic correlation.
Now, at the end of the day, does it really matter if stronger storms come from SST in the genesis region rather than a SST thermo effect? After all, a bad storm is a bad storm. It indeed may matter, because it is not clear (to me at least) that SST in the genesis region is driven by AGW rather than by old-fashioned things like trade wind strength or ocean circulation.
Willis or Steve B, any idea why Emanuel’s Figure 3 uses Southern Hemisphere SST in a correlation plot that uses only Northern Hemisphere storms? I wish he’d stayed with apples-to-apples and simply used Northern Hemisphere tropical temperatures from 0 to 30N to compare with Northern Hemisphere storms, (or use 6N to 15N or 18N,similar to his first two plots).
And, in Figure 3, how does one get a combined Atlantic/Pacific PDI for 1950-55 when the Pacific curve begins in 1955?
Perhaps all this is explained in footnotes and I’ve overlooked them.
No matter what policy is chosen, there will always be a need to revisit the policy and to revisit the science underpinning it.
Labeling policy X as a “no regrets” policy doesn’t mean you are obliged to pursue it forever. Even if there is a consensus on the definition, some “no regrets” policies may be better than others. If the opportunity costs of a suboptimal “no regrets” policy start piling up, then policy-makers, after a certain amount of time, may want to switch to a different “no regrets” policy. Periodic review is thus inevitable, as is a discussion about the amount of data required before embarking on a new policy direction.
If part of the “no regrets” policy is to never review the policy or the science on which it is based, I think that would be regrettably pathological.
Re: #232
1. You meant good news, I’m sure, as I look forward to reading something sensible on the topic.
2. If Elsner’s work is so valuable, then this is great news for the insurance industry, who aren’t interested in academic fluff, just models that actually offer dollars-and-cents predictability.
Thanks for the links.
Hmmm, nothing “serious”, nothing Bayesian in the first Elsner paper. Pretty standard pattern analysis stuff. Hopefully the other papers live up to your billing, Bloom.
Re 234, David Smith, thanks for your comments and interesting questions. You say:
Not sure what you mean by this. He appears to have shown that the strength of hurricanes in the Caribbean in May is correlated with the temperature of the southern North Atlantic in September. Is this:
a) A genesis correlation?
b) A thermodynamic correlation?
c) A spurious correlation?
We don’t know yet if stronger storms in April come from higher SST in September in Emanuel’s “genesis region”, but the more I look at it, the less likely it seems. If it is the case, it certainly hasn’t been demonstrated yet.
Dang, bro’, good call, I missed that one entirely, he does use Southern Hemisphere SST … in any case, his explanation is:
Finally, you ask:
Another excellent question, but I think it’s reversed. He seems to have Pacific data starting in 1949, which he refers to in the text, so the question should be, why didn’t he use it in the Pacific curve?
w.
Hmmm, those other papers at Elsner’s website on Bayesian approaches to hurricane climatology are, unfortunately, unpublished.
All the same, there’s nothing to them. Bayesian approaches are bunk because they are about updating probabilities given new information, conditional on some prior probability. But it’s the prior probability and the inability to get new (independent, out-of-sample) information that’s the problem. GIGO.
Thanks for the effort, though.
It would seem to me that Economist editorial here deals with the AGW subject and mitigation with some rather generalized language, not unlike that that I read from other accounts of AGW. I was particularly interested in the comment that indicates Kyoto is proceeding smoothly in the EU.
Which seems to contradict the status reported by the BBC on Nov. 29 2005 reported here and excerpted below:
From later in that editorial :
Which is completely ridiculous.
It appears that the Economist newspaper has surrendered in their “severe contest”.
Underground carbon sequestration. Costly, yes. Ridiculous, no.
But this is not the place to discuss energy policy. Maybe someone wants to write an essay in response to the Economist article and post it up as a separate thread?
# 235,
Labeling policy X as a “no regrets” policy doesn’t mean you are obliged to pursue it forever.
True, but history tells us most policies, once put in motion, are rather like a glacier; it takes a tremendous amount of hot air just to stem their advance. Making them actually reverse course requires an ‘unprecedented’ amount.
#230,
Willis, have you asked Dr Emmanuel to explain the issues you raise in this post?
Re #243
I’ve made the same point once before, so I’m certainly not disagreeing. But put my statement back in context. The point made was:
My counterpoint is that, from a data analysis perspective, “no regrets” does not take the time-frame out of discussion. Although policy people may not want to periodically reanalyze the data underpinning a policy, science people will.
Re 209: Dave, I have a paper that (sort of ) addresses your SST/wind question, unfortunately with data only from 1989-2000. punch line is that there is a trend in tropical wind speed (statistically significant at 95%), also a pos trend in SST (not stat significant at 95%). Yes high wind speeds cool off the ocean through surface latent heat flux (the main point of my paper) and also through entrainment mixing (this is mainly relevant for very high wind speeds from big storms). Here is the reference for the paper (i am trying to get my papers posted on my web site, i know it is awkward to refer to things that most people don’t have easy access to):
Liu JP, Curry JA: Variability of the tropical and subtropical ocean surface latent heat flux during 1989-2000
GEOPHYSICAL RESEARCH LETTERS 33 (5): Art. No. L05706 MAR 7 2006
Re question #2, the static stability of the tropics is really determined by the moist conditional instability associated with the moist (saturated) adiabat, the slope of which decreases as temperture increases. So if the atmosphere is warming more than the surface, this would not necessarily make it more stable (depends on the slope of the temperature profile compared with the slope of the saturated adiabat). A reference for all this is the Curry/Webster text Thermodynamics of Atmospheres and oceans (chapter 6 for the moist adiabat stuff, chapter 7 for static stability stuff, and chapter 13 for feedback stuff how all this changes with warming). and of course I’m sure no one has access to this book, if anyone is interested i will try to get some chapters posted on my web site.
re #195, TCO, I am definitely in your corner re the uncertainty. A few years ago I prepared a writeup for the NAS Climate Research Committee on the topic uncertainty with regards to the CCSP program. We did end up having a workshop on uncertainty, but it got hijacked by the “experts” (likelihood and all that). I will dig up a copy tomorrow and post it
Sounds like the proceedings here would make for some interesting reading.
Judith, and others: don’t you think this information has any bearing on the issue?
Re #245 Judith, thank you. I’m certainly interested in Chapter 13. On the other topics I have older references that pretty well cover those. You’re on my Christmas list for the help!
Re #238 Willis, if you want to have a head-scratcher, look at Emanuel’s Figures 1,2 and 3 and try to correlate the PDI wiggles.
For instance, look at 1959-1965. In Figure 3 (which combines Pacific and Atlantic) the PDI wiggle drops sharply. Which basin (Atlantic, Pacific, or both) drove that drop?
Well, in Figure 1, the Atlantic wiggle rises then falls from 1959-65, ending at about the same place. The Pacific wiggle (Figure 2) is more or less flat. So, what caused the 25% PDI drop shown in Figure 3? There are other head-scratchers in there, too.
I must be missing something fundamental about the construction of the graphs. Anyway, I am worn out trying to figure out Emanuel’s graphs. I give up and will “move on”.
Quick follow-up found here that gives a better picture of how non-EU nations are doing with Kyoto emission targets and the very diffrent view that this Feb 2006 article gives for the status of Japan and the EU compared with that portrayed in the Economist editorial.
Re #248 Jae, thanks for pointing this out, i hadn’t seen this before. It is a typical (but very thorough) example of what advocacy groups on both sides do: they behave like lawyers who are paid to start with either the innocence or guilt of their client, then proceed to present evidence that supports the verdict they have already decided they want. Unfortunately this isn’t science. I could rebut each of their arguments, but i think it is far more interesting (and potentially rewarding) to move forward in the analyses as many people posting on this thread are attempting to do
I don’t have any insight on what actually went into Emanuel’s plots. I agree that they should be reproducible. But before spending an inordinate amount of time on this, do the over results of the analysis depend substantially on the nuances of methodology etc that you are trying to figure out?
Here is the web site for the NAC Climate Research Committe Uncertainty Workshop. No proceedings, but most of the ppt files are available from the site
http://dels.nas.edu/basc/ crc_10-26-04_agenda.shtml
(my usual caution re take out the space before you try to use this link)
#251 Judith Curry,
Let me first say that I really do appreciate you participating here and please keep on doing it. It’s very good and very important.
Please don’t take this the wrong way but your reply to jae #248 bothers me. It sounds to me, like you looked at who owned the site first because you couldn’t have read all the papers, written and linked on that page. I think your reply is brushing off of information because of who provided it. That’s not science either. (My husband is a scientist, an environmental geologists with a masters in environmental geology he’s following the board with me and he agrees here with me, I asked his opinion, and he looked at the web page. He also points out there’s probably alot of factual information or evidence about the nature of C02 (or hurricanes) on that site and in those links that no one is arguing over and everyone agrees on. You can’t possibly know you can rebut every argument. And ALL evidence matters and is added to the record, whomever’s presenting it in a court case.
I agree it’s far more rewarding to look at things together and move forward like on this site, and that’s why I said something about your comment, so we can move forward and stop polarizing because of politics and advocacy group think. Let’s add all evidence to the record, no matter who presents it. That would really be true science to me.
Cheers! 🙂
to welikerocks: actually, i still don’t know who owns the site (i never even looked), i saw CO2 and initially assumed it was a pro AGW site. I formed my opinion after cruising through 3/4 of the links. I am happy to look at any publication or other argument (and I have nearly all of the publications referred to and referenced many in my BAMS article). But to me, that site was pure spin
251: Judith:
1. Since when is a literature review unscientific?
2. You seem to be playing an advocacy role here, also.
3. You say you can refute EACH of the claims on the review. Amazing. I keep hearing from the denialists 😉 that the Idsos are “slanting” the truth, and I keep being promised that someone will demonstrate that; but nobody has followed through. Perhaps you would pick one of the studies mentioned and tell us what is wrong with Idsos’ analyis?
Steve M or John A, can we have a blog for the Battle of Catastrophists vs Denialists, and leave this thread for tropical discussions?
Lukewarmers like me would certainly appreciate that.
Judith, thank you for your continued participation. You say:
What do you mean by the “over results”? Overall results?
If you mean the overall results, certainly his claim that hurricane intensity in the Caribbean in May is correlated with temperatures in the southern North Atlantic in September depends on his methodology.
My question is, to study SST vs hurricane power, can you justify any method other than picking an area and a time frame, and comparing hurricanes born in that area and time frame with temperatures from that same area and time frame? I mean, that’s not a “nuance of methodology” … thats a no brainer.
Yes? No?
w.
[Strunk & White Rant Mode On] PS – despite its popular use, I must raise a likely useless protest against “methodology”. Methodology is the study of methods. We are discussing the nuances of his method, not his methodology. [/Strunk & White Rant Mode]
Re # 258 Perhaps a thread titled “General Forum”
Try it and see if it comes to life.
Judy : jae is like one of the weakest skeptics around. And the Idsos…well…there is something freaky with all their blather and no recent science pubs. I get worried that Steve is hiding down that nutter/crank road. Don’t pay attention to jae. Pay attention to Steve or maybe bender.
Dave, I agree, but JohnA is one of the worst offenders. He can’t follow the more abstract topics so will diver threads into general lowest common denominator skeptic stuff.
TCO, you say, in your ad hominem mode …
A search on Google Scholar for Idso from 2000 to the present brings up 45 hits (27 papers, 18 citations) … how many have you published in that time, TCO, during which you’ve been “blathering”? Do you find something “freaky” in your own blather?
But of course, the number of their publications is immaterial to their web site, or to whether they are right or wrong about any particular question. Their site is a very valuable resource for locating scientific studies in a particular area.
w.
They do have a GRL and some botany articles. More then I expected. (But nothing like the impressiveness of what you stated. When you actually go and look at the articles, several are in non-peer reviewed journals.) But ok, better then I expected. Still, don’t really see them getting much traction. Lot more sturm and drang and stuff that the lightweights like you or jae can go dig up off their sight and not that much in terms of real hard hitting pubs.
Re #253 Thanks. I especially enjoyed the U. Colorado paper on uncertainty in decision-making – the one that is not allowed to be quoted or cited. Especially the insights on the ‘bad loop’ of ‘seeking understanding’.
Re #254 A trained scientist reading in their area of specialization can speed read new papers 100 times faster than the average person, and often has pre-read 90% or more of the relevant literature. It is likely Dr. Curry is not boasting as to her familiarity with the papers on the CO2 site.
Re #261 I’m sure “Judy baby” needs no advice as to who to pay attention to.
TCO, you continuously push Steve to publish, then put on your ad hom spurs for the Idso’s publications – not critiquing the publications themselves, but where they’re published. Why don’t you a)describe the technical weaknesses in their sturm and drang and b)list your own pubs so that others can know whether your walk matches your talk.
72, 107, 126
Bayes procedures with good frequentist properties are objective 😉
72,
With the knowledge of underlying physics we can develop dynamic models. And without dynamic models there is no way to predict the future. I don’t think that statisticians object this. The same in equations (Bayes or not, no matter):
Let be the observation (e.g. measured temperature),
  the state we are interested of (e.g. global mean temperature), and i the time index. One problem is to compute
  , where p..q are the ‘instrumental years’. But mostly we are interested in computing
  (j smaller than p), and
  . The former is reconstruction (we can include very noisy
  ) and the latter is prediction (no
  at all). Without dynamic model there is no way to compute these distributions. One way to obtain a dynamic model is to assume stationary dynamic process (kind of crude frequentist approach). The other way is to study underlying physics, phenomenology and data constraints and use them to build the model.But the results (reconstruction/prediction) obtained from this model cannot alone be used to verify the model. For example, if somebody assumes a model ‘CO2 is the only forcing of Global Temp’ and uses this model to show that ‘CO2 is the only forcing of Global Temp’, I wouldn’t accept the result.
From The Houston Chronicle. It has received broad coverage this morning including a piece in Surfersvillage Global Surf News.
265:
A. listing my pubs has nothing to do with anything. Get over your silly, let’s get upset about TCO crap. If I annoy the hell out of you, tough. If I disturb the little “friendly dojo tough”. I’m not going to fall for making TCO the subject anymore.
B. Obviously the IDSO work might be incredibly good. The judgement of where it was published is a quick assessment. If I read something and get dissuaded the other way, fine. And just to educate you: I’m not kvetching about the ranking of the journals–I’m kvetching that they are not even peer reviewed. Google Scholar will return some hits that don’t really fit the definition of a solid publication. And if you read what I wrote: I actually threw them a bone. Said that there was more then I had realized. I only hope that their published papers are not as skewed and silly as their snippets at the Academy of CO2 Science or whatever glorified name they have given a website with 3 family members. Sheesh.
C. The one paper of theirs that I read in detail (was touted on this site) is an ok paper in terms of analysis–it was the CO2 paper. But it DID NOT justify some of the hype of people here who were saying that it proved CO2 fertilized growth in the bcps. For the simple reason that other confounding factors (like say…TEMP!) were not accounted for.
Re the CO2 site. I seem to have inadvertently stirred up a hornets nest on this one, apologies for previous flip posts but my “spin meter” on this particular topic is acutely sensitivity.
The post on the CO2 site is “high class” spin, where factual info is presented without obvious errors and the motives of scientists aren’t attacked (this is in contrast to low class spin).
Check out this site from the other side of the CO2 wars, from the Environmental Defense Fund.
http://www.environmentaldefense.org/ article.cfm?contentid=5315&campaign=486
(watch out for spaces)
This is another example of “high class” spin.
The EDF picks a better group of references, but CO2 worked harder to make its arguments. The people who did both sides clearly know their stuff, but they are also clearly involved in advocacy. Depending on which site you read, you get a totally different “spin” and are led to different conclusions. When i said i could refute the CO2 site, i was specifically referring to their faulty reasoning, not the data or anything else.
Now, enter the “spin free” zone. What are the symptoms of being spin free? It is acknowledged that there is a scientific debate, and nothing close to a consensus among scientists. Papers from both sides of the debate should be honestly cited. Words like uncertaintly should be used frequently. There should be no attacks on the motives of scientists.
In my BAMs article, tried to do exactly that. But anyone reading this (realclimate made this statement clearly) needs to understand that i come to this with the “priors” of a climate researcher. As an example of a spin free analysis from someone with the priors of a hurricane forecaster, check out jim masters at weatherunderground.
http://www.weatherunderground.com/ education/webster.asp
This is an excellent analysis (IMO better than anything Gray or Landsea has come up with).
If any of the climateauditors find any of the arguments on the CO2 site particularly convincing, i will tackle one or two of them (but not all). I have been asked by a number of advocacy groups to publicly debunk leaflets, websites, etc from the other side and i’ve refused to do it, since the lawyers have already decided on their verdict. I’m assuming that this is not the case with the climateauditors (who i judge to be bonafide skeptics). I can learn from skeptics and engage in interesting scientific debates (can’t do this with the lawyers).
#267 (1) As pointed out on Pielke Sr’s site, sea surface temperatures have taken a sudden large downturn in the last couple of years that wipes out much of the previous SST warming. Not in the models. (2) Santer et. al. ran 22 different climate models, which didn’t all agree with each other, to get this result. Let’s see now, if I’ve decided ahead of time I want to throw a six do I throw one die or twenty?
269:
Please don’t waste your time on the lower level debunking or Idso citing of some on this board. Save your time for dealing with things like bender’s crit of the hurricane analysis or burger and cubasch or things like that.
#255 Judith Thanks so much for addressing my comment. 🙂
I think 99% of the climate “science” being presented as the lastest and greatest to the public right now is also spin.
Bender: ” A trained scientist reading in their area of specialization can speed read new papers 100 times faster than the average person, and often has pre-read 90% or more of the relevant literature. It is likely Dr. Curry is not boasting as to her familiarity with the papers on the CO2 site”
Yep, understood and took that into consideration when I commented. However as my husband points out, there might be factual evidence on that site that no one disputes. He is a really fair and balanced observer. In the first link on jae’s page “Sea Surface Temperatures and Atlantic Hurricanes” it is referring to a paper Michaels, P.J., Knappenberger, P.C. and Davis, R.E. 2006. Sea-surface temperatures and tropical cyclones in the Atlantic basin. Geophysical Research Letters 33: 10.1029/2006GL025757. the page provided summarizes “Background” “what was done” “what was learned” ( we are also allowed to go read the actual paper) so I do not feel that’s spin in the true sense of the word unless “what was learned” is incorrect or misleading ( I have no idea right this moment) My impression is that the site tries to provide access to papers that don’t “make the news” or the “team” which to me is sort of opposite of “spin”.
if jae is one of the “weakest” skeptics on board, I am with you jae. Apologies to David Smith, who seems irratated at my concerns/comments.
Carry on!
Oops. Good morning everyone! We all are up and commenting at the same time. No hornets nest here from me. No worries, no problems, no bad feelings!
You are one of the weakest, too, rocks. But I love you. And I appreciate your tolerating my bluster.
Well, weak is in the eye of the beholder TCO. 😉
Re #272 Good morning, rocks, no problem with me. I’ve never been bothered by anything you’ve written. My only concern is that, if this thread gets too far off-topic, a solid contributor like Curry will vacate.
And I do think this site needs a general duke-it-out, yo-moma thread where the two poles can vent their frustration with one another.
David
re:#269,
I think I’ll take you up on your challenge but am busy today so it will probably be tomorrow before I post anything.
BTW, I think you’re really not thinking clearly in your challenge. What would be the result of my producing a convincing argument from CO2science? Surely you wouldn’t have to then concede that all their arguments were correct, would you? Nor, if you presented what you claim to be a logical debunking of what I produced, would I be required to assume that all arguments on their site must be invalid. In fact, I suspect that I’ll come up with a sound argument and you’ll retreat to a non-logical debunking (by which I mean a debunking based on some factual point rather than a line of faulty reasoning). Then we’ll have to argue over whether, in fact, you have debunked them on that point and/or succeeded in what you claimed you’d do and it’ll all be rather futile, but hey, it sounds like fun!
I actually hate this kind of distraction from examination of specific topics in the post (e.g. hurricane statistical analysis) to random warmer/skeptic arguments (some Idso stuff). Is this kind of generalization and rehashing of lower-level arguments, the direction that Steve wants for the blog?
You know that example I just used also cites a paper with J Curry in the references. 🙂 “References
Emanuel, K. 2005. Increasing destructiveness of tropical cyclones over the past 30 years. Nature 436: 686-688.
Webster, P.J., Holland, G.J., Curry, J.A. and Chang, H.-R. 2005. Changes in tropical cyclone number, duration, and intensity in a warming environment. Science 309: 1844-1846.
That seems well rounded eh? 😉
Please, I hope you don’t vacate like David Smith fears. Sincerely I do!
re #253 here is shortened version of my presentation at the climate research committee on uncertainty (apologies for the length, but i think this is important): Some Thoughts on Uncertainty: Applying Lessons to the CCSP Synthesis and Assessment Products, by Judith Curry, October 21, 2003
FUNDAMENTAL QUESTION #1: Is the assessment process and “science for policy” (as interpreted by climate scientists) torquing climate science in a direction that is fundamentally less useful for both science and policy? The answer to this question is probably “yes”, and both the root of the problem and its eventual solution lies in how scientists and decision makers deal with the issue of uncertainty.
For example: Why have scientists making observations and evaluating trends of atmospheric temperature not conducted a rigorous error analysis? Scientists and funding agencies are better rewarded for proposing and funding large new observational systems, rather than for careful analysis of existing data sets, and “preferred” data sets become a political issue as the stakes for publicity and funding is accelerated. Two proposals are on the table at NOAA to reduce errors in T profiles: 1) spend $1B/yr to have UAVs drop reference radiosondes; 2) use COSMIC plus ground based reference radiosondes (+$5M/yr). A rigorous uncertainty analysis will help NOAA assess these proposals: How much uncertainty is due to instrument accuracy and precision, T calculations/retrievals from measurements, and errors in sampling? Is there any value in reanalyzing the current data sets with improved methods for calculating temperature from the measurements?
Climate modelers (and the agencies that fund climate modelers) infer pressure from policy makers to reduce uncertainties in climate models implied by the spread among predictions made by different models. This “pressure” may be torquing climate science in the wrong direction: By adding new degrees of freedom to individual climate models (e.g. increasing the number of prognostic variables, model resolution, etc.), disagreement among model projections is likely to increase. Such disagreement is a sign that progress is being made in understanding the importance of previously neglected processes. Given that climate models cannot presently be evaluated using out-of-sample observations, focusing solely on reducing the range of model projections will mislead and there will be no motivation to uncover common flaws among the models.
Evaluation of model errors and prediction uncertainty is essential to establish the credibility of climate projections for decisionmaking. Model errors: errors in functional relationships, numerical errors (coding, model resolution), Errors in treatment of unresolved degrees of freedom (subgridscale), neglect of important processes (e.g aerosol processes). Prediction uncertainty: imperfect models, chaotic behavior of system, imperfect initial and boundary conditions. Ensemble simulations are a MUST, and frequentist distributions must be generated for each model, otherwise we are faced with a single unequivocal prediction from each model that may be very far from reality and no understanding of prediction uncertainty using that model.
Consider: “Science for policy must be recognized as a different enterprise than science itself, since science for policy must be responsive to policymakers’ need for expert judgment” (Moss and Schneider). “Science for science”: Publication of a paper in a scientific journal may or may not “require” a rigorous analysis of errors and uncertainty (but it should!). “Science for policy”: Credibility in the science for policy enterprise requires rigorous science with a rigorous analysis of uncertainty combined with expert judgment. Assessing/learning what the current uncertainties really are is even more relevant/valuable for policy than in the basic science. CCSP and IPCC are ruled by “a Bayesian or subjective characterization of probability will be the most appropriate” (Moss and Schneider). Simply because it is difficult to evaluate climate model predictions using observations does not imply that we cannot conduct rigorous error analysis on climate models and conduct a rigorous uncertainty analysis on climate model projections. Basic statistical good practice requires that we do the error analysis and Monte Carlo runs, before we revert to the use of subjective probabilities to combine the conflicting model distributions. By introducing subjectivity too early, “the hard work” is avoided but we significantly reduce the value of the uncertainty analysis to policy makers.
FUNDAMENTAL QUESTION #2: Is a projection useful for policy applications if the model is so complex that we “can’t” understand the model errors and the uncertainty of its predictions? Proposed communication of uncertainty in Assessment and Synthesis Reports:
Category 1 (audience: scientists and funding agencies): sources of uncertainty; magnitudes of uncertainties if they have been determined; actions required to conduct a rigorous uncertainty analysis
Category 2 (audience: adaptive managers): how to exploit the uncertainty in ensemble forecasts of decision-relevant variables in their decision making process, focusing first on weather and seasonal/interannual variability; how new policies (e.g. emission reductions) will impact them
Category 3 (audience: policy makers): Policy makers need “credible” observations and projections. Credibility = rigorous analysis of observation/model errors + uncertainty in projections from monte carlo simulations + expert judgment + common sense
Well, TCO,
Maybe now you understand why everyone here gets so angry with you when you hijack a thread away from the topic to how Steve should get published more!
And just how is hectoring him about his logic in some thread long ago and far away better than discussing the logic and reasoning of the Idsos?
What goes around, comes around.
Re: #44- Willis
I did some more digging on the wind speed versus SST results of Emanuel, including contacting by email. Emanuel points out that there is a very large temperature dependence in his parameter E, which is related to humidity levels and ocean surface/air interactions. In fact, the temperature dependence of E swamps out the Carnot cycle temperature ratios. However, this creates a situation where the predicted wind speed is solely dependent on how well you model the air/ocean interface. This is, of course, very poorly understood at present. Emanuel does indicate that other factors, such as humidity, upper atmosphere temperature and trade winds are at least as important as SST in determining hurricane activity, and that his model does not quantitatively support his recently published analysis of hurricane intensity over the past several decades that you already discussed.
So, the 0.5% change in wind speed per 1 degree increase in SST is not correct because Emanuel’s Physics Today article left out the largest source of temperature dependence that is buried in the parameter E. However, we are also left with the unsavory situation of trying to formulate an accurate model that involves water vapor. Ugh.
re: #280 Attention John A
This looks like the sort of post that Steve would pull out and make a separate thread from. Suggest you do so.
Re climate science and spin by scientists. The litmus test is looking for scientists that consider new evidence and actually change their mind. Three examples from the hurricane/global warming debate:
1) Kerry Emanuel was originally a coauthor on the Pielke et al. BAMS paper, but pulled out during the review process, since he had “changed his mind” based upon the analysis he had recently done.
2) Greg Holland (coauthor on webster paper) is a former student of Bill Gray and until about 15 months ago, he was firmly in the gray/landsea camp. The Webster data analysis, plus the thought process we went through for the Curry, Webster, Holland BAMS article changed Hollands mind (at this point his public statements re pro greenhouse warming seem stronger than Curry/Webster)
3) Pat Michaels. Michaels has gone from saying there is no warming, to there is warming but its not caused by humans, to some of the warming is caused by humans but it wont cause any harm. His 2006 paper is the most interesting one in the whole hurricane/global warming collection, not because it is particularly profound but it is used to support arguments on both sides of the debate.
Also, as I’ve stated in previous posts here and on realclimate, the media torques scientists into the appearance of spin and polarizes the debate so that some sort of spinning may seem necessary to a scientist.
You will see scientists changing their minds as new evidence is uncovered and presented. You wont see the advocacy groups change their mind. They will drop the hurricane issue if it no longer supports their agenda.
udith, good overview on all counts! I believe these matters are not settled and ever changing when more understanding comes in (which is how it should be) My problem with issues such as these is because a whole lot of it is being presented as settled in the form of taxes and propositions in the ballot box, and educational information in schools for my kids where I live. Like yak, I say ugh to all of that. 🙂
Thank you so much again for your time and energy, and willingness to participate.
#283 good idea.
Apologies if I contributed to the virtual hijacking of the topic (just skip my comments in the future if I do this, or say I am. I will not be offended in the least)
Judith: Please note that the Idsos are well-known climate scientists, not a public advocacy group. I don’t think there is any more “spin” on thier work than there is in the IPCC TARs. After all, their “bottom line” on hurricanes is that we just don’t know yet.
TCO: this is nacho blog. If Steve wants to ignore general things like the Idsos, so be it, but I need him to say it.
The fact is that any research that shows a linkage between AGW and hurricanes gets attention in the main stream media, further ramming the idea of catastrophe down the throat of the general public. At the same time 2 new items came out in Geophysical Research Letters showing that its the AMO that should be the focus on hurricane trends, not AGW. One was by Knight, J.R., et al and the other by Zhang, R., and T. Delworth.
If we could let the advocacy chips fall where they may and leave to the judgment of the mature adults who post here the evaluation of the veracity of articles, whether presented in strictly scientific and technical terms or as advocates, I think, as has been suggested in other posts, we could spend more time evaluating and less time posturing.
The presentations and discussions of facts in this thread have been most interesting, revealing and informative to me and, for my selfish interests in participating at this blog, I hope the blog can evolve in that direction.
#269,
I can learn from skeptics and engage in interesting scientific debates (can’t do this with the lawyers).
I respectfully suggest the ‘Dick the butcher’ solution.
#278
I actually hate this kind of distraction from examination of specific topics in the post (e.g. hurricane statistical analysis) to random warmer/skeptic arguments (some Idso stuff).
TCO, this is not an ad hom, but merely an observation and a sincere, well intentioned one. Random warmer/skeptic arguments are easier to bypass than the incessant, unsolicited policing of the site by a volunteer school marm. And as the lightest of lightweights (I virtually float) who is only here to learn what I can through some simpleton-like questions and observations (and poke a little good natured fun at Steve B and Dano occasionally), could you just kind of contribute some science or clam up?
Your saving grace is you are seldom if ever mean, although your accusation of ‘dishonesty’ against Steve M the other day on rather tenuous evidence came pretty close.
In any event your non-science forays are distracting as hell.
If I may, you folks aren’t listening to what TCO says. Sure, he is sorta like me in his approach and that’s bound to shake up your lil’ box, but you don’t want to hear what he has to say, IMHO.
HTH,
D
Re #285’s:
Researcher X “has gone from saying there is no warming, to there is warming but its not caused by humans, to some of the warming is caused by humans but it won’t cause any harm”
Aha – now I think I understand the role that faith in Bayesian logic is playing in propping up the AGW movement. You all think that because there is a “trend” in scientific opinion, that this will continue as a direct function of the Earth’s rising temperature – that the “new” data are serving to reverse “prior” opinion. Is that it?
1. I would appreciate it if Bloom would write us a little essay on the topic, correcting me where I’m wrong.
2. Because I’m here to tell you: that ain’t how it works.
Scientific opinion and public opinion do not function in the same way, and Bayesian methods are ill-suited to the nonlinearities of scientific reasoning in climatology. That, I admit, is very vague, and perhaps not even tantalizing. But I would happy to explain in greater detail, if I could get a warmer to post up a proper target to use as the seed for a new thread.
Oh, great, Dano’s here. He’ll draw it out of them. Dano, talk to me about Bayes.
Dano, we can repeat what TCO says by heart. And nobody disagrees that if Steve could publish more it’d be nice, but he does have lots on his plate and how he allocates his time is his business, not TCOs. As to TCO’s disagreement over the Hubers? paper, we’ve asked him time after time to be more clear about what his problem is. Nobody here can figure out what his problem is. If you know it, maybe you can let us know what it is.
As to the general statement that Steve fails to disaggregate, I plain disagree.
TCO, you say:
So, listing the Idso pubs has nothing to do with anything either? I don’t understand the difference. If, as you suggest, we don’t pay attention to the Idsos because of their pubs, why should we pay attention to you?
w.
I have just received a very interesting and complete reply from Dr. Emanuel. As I remarked before, he has been consistently quick and genteel in his replies, and free with his information. Would that all researchers were so ethical and supportive … but I digress. His reply was as follows:
Here is his referenced graphic:
I’ll have to think some about this reply, but I wanted to post it here as soon as I got it.
w.
298:
Dear Mr. Eschenbach: I confess that my previous replies to you were a bit offhanded. Please understand that I get about ten requests likes your each day and have to brush most of them aside as a practical matter. But now that I see you are serious, I will try to do justice to your concerns.
Hence my concerns over the contents of the paper not written yet but an abstract contemplated for submission to the AGU here.
Anyway, well done willis.
Best,
D
Willis: My publication list has nothing to do with an examination of Idsos as scientists. My publication list would be helpful to an examination of me. If you don’t agree with the metric, fine argue that. But citing my record when we are talking about someone else makes no sense.
Imagine we are talking about Sean Taylor’s ability as a free safety in the NFL and refer to his 40 yard dash time. Citing my 40 yard dash time, has nothing to do with an evaluation of Taylor in light of his 40 yard dash. If we wanted to evaluate MY abilities to cover NFL recievers, it WOULD be relevant.
That’s all I meant with the not relevant comment.
TCO tends to give out what I think he believes is fatherly advice so questioning his publications (unless they all be about fatherly advice) is probably not to the point. On the other hand, if he were my father and handing out the kind of unsolicited advice he does and as often as he does, I might well have said “Dad, show me your papers on that or at least give me a reference” and suffered the consequences.
Hmmm. One thing is obvious, that there’s not much variation per year given that we’re dealing with the cube of maximum wind speed and we know the maximum wind speed of a TS/H varies a lot. We’re talking only a 3% difference from the top to the bottom of the scale. Consider the difference between 90mph winds and 100mph 729,000 vs 1,000,000 or basically a tripling of the difference. But if we only have a percent or so difference in any two years, then the wind differences combined with the storm freq. + length, must be a tiny difference. So what can keep the differences so small? If this is real and well measured, then only something like the maximum entropy production theory or the equilivant will work, IMO. Otherwise there’s no reason why the numbers shouldn’t jump all over the place on a year to year basis.
Re #63
Dear Dr. Curry,
Sorry for the late drop-by in this thread, was away for a week without Internet access (which is quite nice for a while!).
About the 70-year cycle you mention, there is a similar cycle in central European and Arctic summer temperatures, see Fig.2 in Shabalova and Weber (1998). I wonder if the 70-year cycle in (Atlantic) tropical storms is in the same time frame (with or without some lag).
Re #113,
In addition, to the Santer ea. comparison of modelled and observed SST data, which are currently in discussion on RC, I posted the following comment:
May we disagree on the following quote from the Q&A of Santer:
Some of the main climate models (which includes the HadCM3 model!) don’t even predict the global variability (“climate noise”) of ocean heat content (as surrogate for SST…), let it be for regional changes, where the accuracy of any model is even worse. See figure S1 of Barnett ea.
The models significantly miss any cycle between 10 and 100 years, that includes the 11-22 year solar cycles or any form of AMO…
Further, there is a significant decrease of SO2 emissions in North America since the mid-seventies. This should have been noticed as an increase of the North Atlantic Ocean heat content, if there was a substantial effect of aerosols. But the North Atlantic shows a substantial cooling trend in the period 1980-1990. See Fig. S1 of Levitus ea.
This means that models still are far from able to match observed (natural) changes in global/regional ocean heat content/SST… But may capture the average century trend for the wrong reasons (different weights of attributions…).
Btw, how does the recent (still discussed) observed change [note: reduction] in ocean heat content/SST fit in this picture?
TCO, personal and professional experience indicates that advice that originates from someone who is all talk and no action – in other words one who cannot personally attest to the merits of a particular task being recommended – is almost always less than worthless.
For what it’s worth, over a dozen years of that professional experience was at a national laboratory, where publications are a primary business product. Non-peer reviewed activities (boring meetings and committee activities along with informal presentations) and personal interactions had much more significance at the end of the day in effecting changes in understanding and perspective.
The points are: 1) The experience of those offering advice – solicited or otherwise – is a quite important characteristic in evaluating the potential worth of said advice, and 2) It is possible to have a different point of view with respect to the merits of publishing, but hard to rationalize much sermonizing on the merits of publishing on the one hand and pooh-poohing it on the other.
BTW, we’re not upset… we are able to discuss this without use of four letter words. Are you?
Re #268C and #296, TCO (and Dano), I believe you were referring to Graybill & Idso 1993 paper “Detecting the Aerial Fertilization Effect”. If you would revisit that paper and look at the figure 5 on page 89. Figure 5 compares the full-bark and strip-bark Sheep Mountain Bristlecone pine tree-ring index chronologies. Kindly read the discussion about the differences between the full-bark and strip-bark also on page 89. In particular the statement “The two chronologies are almost indistinguishable until about 1870, when the one based on strip-bark trees begins a sustained, low-frquency trend of radial growth increase. A more limited low frequency upward trend is also present in the full-bark chronology since about 1890.” Please give us your thoughts on which tree-ring series or either you would use if you were doing a temp reconstruction, especially if your calibration period is during the 20th century.
Re #297
Willis, I don’t think one can attribute the sinusoidal oscillations in your figure as due to greenhouse warming. Rather, only the underlying trend could possibly be so attributed. From the figure, PDI goes from about 26.87 to 27.15 between 1972 and 2001 using MDR events. The corresponding increase in hurricane velocity then is only about 0.3% or a 0.3 mph increase in velocity for a 100 mph hurricane. And that is for about 18% of the way towards a doubling of CO2 forcing over that time period. Doesn’t seem like something to panic over.
304: Understand that you are making an argument against publication as a method of insight on a person’s scientific credability. It is a little garbled, so I can’t follow it all, but thanks for sharing the DOE experience. I don’t choose to respond to the “can TCO get by without 4 letter words”–am avoiding TCO style discussion digressions. Feel free to start a new thread if you really care.
305: Repost it in the appropriate thread and we can drill down.
Re #307 & 305, I reposted on the 5 June 2006 thread on Bristlecones, Foxtails, and Temperature. It is a more appropriate thread for these comments.
Dr. Curry — thank you. You make sense; you’re drawing out the best from the others here, which helps the conversation thrive. Your links and cites clarify the issues you mention each time I read one. I can invite my libertarian scientist friends into the threads where you’re participating — it’s great to see the science addressed rather than spun. Most enlightening.
Re #302: Ferdinand, the decadal to century scale natural internal oscillations are challenging to document in the observational record and climate models don’t do a great job with them (refer to controversy surrounding the recent Santer article). I am personally very interested particularly in what is going on in the Arctic, the natural oscillations there longer than a decade seem poorly characterized and understood. I am especially intrigued in the arctic by the following paper
Wang XJ, Key JR
Arctic surface, cloud, and radiation properties based on the AVHRR Polar Pathfinder dataset. Part II: Recent trends
JOURNAL OF CLIMATE 18 (14): 2575-2593 JUL 15 2005
that finds that the arctic winter surface temperature has been cooling (1982-1999, with a decrease in water vapor and clouds becoming more crystalline. I infer that this is accompanied by more snowfall on the sea ice, which would then slow down wintertime ice growth and hence this cooling is not inconsistent with observations of thinning sea ice. the two possibilities for causing this wintertime cooling seem to be some sort of internal oscillation, or aerosol forcing. So we are back to the same debate (internal oscillations vs aerosol forcing) as over the global cooling ca 1940-1970. I hope to focus on this issue as part of my activities re the International Polar Year (www.ipy.org)
So there is much to do in terms of sorting out the natural internal variability vs the externally forced climate variability. The Santer paper had a good experimental design in terms of using ensembles of multiple climate models and in designing the experiments the way the did, but arguably didn’t deal adequately with the uncertainty of each model in being able to reproduce the known modes of natural internal variability. So this was an interesting paper with a laudable experimental design, but the press release went way further than the paper itself did. At the moment, the media seems to prefer highlighting the global warming papers (and not the natural variability papers), and then asking the likes of Bill Gray et al. to tear them apart. The blogosphere is doing a much better job of examining this paper (see also realclimate and prometheus).
Re #297: Willis, I am relieved but not surprised that Kerry Emanuel addressed your query in a satisfactory way. Kerry is one of the good guys; an excellent scientist in terms of the quality of his contributions and his integrity. He is a scientist that I trust; not always to be right, but to be honest in his pursuit of scientific understanding.
#309 Hank, i appreciate your kind words. I tuned out from the likes of cato, reason et al. a few years ago, partly because their “position” on climate change was not “reasoned” but seemed to echo the likes of the Competitive Enterprise Institute. What we could really use from the libertarians is demands for accountability and assessment of the logic of our arguments
And again thanks to everyone for making this such a though provoking discussion
I’m will to accept that his choice for the region to measuring sea surface temperatures is legitimate. Now can we get into other issues like what algorithm did he use to smooth the data. What kind of distribution does the PDI have and what are the uncertainties. There appears to be a small trend but lets dig further.
I think if we are simply smoothing data to see a trend then we can define the true value as the value that would be obtained by time smoothing all the ensemble means. I think in that case it is suitable to treat the error as white and independent and we can use standard error analysis techniques (errors add in quadrature) to compute the error bars of the smoothed signal. We should see smaller error bars in the middle of the data set as the smoothing is done with past and future data and larger error bars at the ends of the data set. Can someone post the equation used for the smoothing. I am not sure what the original paper is called or where to find it.
Re #297 Willis, I’m delighted that Emanuel took valuable time to answer your e-mail. That is a class act. I, too, am taking some time to digest his comments, but will mention a couple of initial thoughts:
1. I’m glad that he uses August thru October in his additional analysis.
2. Emanuel states that SST are correlated across the tropical Atlantic on long term timeframes, and my check of SST charts agrees with that. But, what was not said is that they are not so correlated on smaller timescales (say, 5 to 10 years). The reason that 5 to 10-year correlations are important is that the up-and-down wiggles of his chart, which are critical to his SST/PDI correlation, are of that frequency. If one included the Caribbean, Gulf and Bahamas in the SST region, his charts’ wiggles would look differnt and not be so well correlated with PDI. (This is better shown with a graph, and I will work towards that if I can find a website with the right calculator.)
Re #306 I think that Emanuel’s left-hand scale is degrees C for the SST curve. He gives no scale for the PDI.
Without a scale, it is hard to evaluate his PDI curves, but I do wonder about something. I assume that “PDI from all events” = “PDI from MDR events” + “PDR from non MDR events”. Since the “PDI from all events” varies similarly to “PDI from MDR events”, then it follows that “PDI from non MDR events” was more or less constant across 35 years. So, the SST in non-MDR region rose, but the non-MDR PDI remained constant! That is remarkable. I have to digest that.
Re #310 Interesting NOAA website on Arctic weather, including their North Pole webcam. Puts a “face” on the deep North. The amount of cloud and fog cover is remarkable.
link
Re My #315
If Emanuel is using two separate scaling factors for the PDI plots, then I can make sense of that. I guess that is what he did. I do wish the plot was labeled or, better yet, the data was available.
Further to David Smith on the North Pole webcam,
Here is a link to Barrow Alaska’s polar ice webcam (1,200 miles from the North Pole.)
The harbor is completely frozen over today, September 12th, Barrow was only ice-free for 1 month. So much for the poles are melting stories and studies.
http://www.gi.alaska.edu/snowice/sea-lake-ice/barrow_webcam.html
TCO and Steve Bloom –
Bender has been using “sampling error” in the traditional sense.
Everyone –
Has Juduth Curry ever addressed the variance masking problem with the 5 year averages that Bender brought up?
Judith –
The “dependancy o foriegn oil” and “oil company PR” talk sounds like the script the perpetual motion machine promoters use. Maybe that’s a fair warning on your part of maybe it’s something you are better off not writing about.
John Creighton, you say in 313, “I’m will[ing] to accept that his choice for the region to measuring sea surface temperatures is legitimate.”
Well, I’m not, at least not yet. Having had a bit of time to consider Dr. Emanuel’s kind and complete response (see post #297), I find the following problems with it.
1) He says that:
However, this is not the case. For example, in The Recent Increase in Atlantic Hurricane Activity: Causes and Implications, Stanley B. Goldenberg, Christopher W. Landsea, Alberto M. Mestas-Nuñez, William M. Gray, defines the “Main Development Region” as going from 10° to 20°N across the entire width of the Atlantic Ocean. Dr. Emanuel’s region covers only a small part of this.
NOAA, on the other hand, use 90°W-20°W and 9.5°N-21.5°N. Again, the area used by Dr. Emanuel only covers a part of this. So his claim of historical precedent is unfounded. I find no one that uses the box that he is using to define the Main Development Region.
Indeed, it was the oddity of the endpoints of his band, from 6° to 18° N, that made me question it in the first place. I mean, why go from 6 to 18? Why not say 5 to 20?
2) There is a statistical curiosity. Dr. Emanuel says that:
Now, I don’t understand his claim about the r^2. There is no a priori reason that r^2 should drop simply because there is a smaller sample size. But regardless of that claim, consider:
If
a) the r^2 of the hurricanes that started inside the region is 0.80, and
b) the r^2 of all of the hurricanes that started anywhere is 0.88, then
… what is the r^2 of the hurricanes that started outside the region?
Well, I can’t calculate it exactly from the data that I’ve been given, but a weighted average will give a very close answer. In this case, the weighted average says that the r^2 of the hurricanes outside the region is about 0.92.
Which means that, unless he or I have made a mathematical error, we’re looking at a spurious correlation “¢’¬? the hurricanes that formed outside the region have a higher correlation with the region’s SST than the hurricanes that formed inside the region …
3) Dr. Emanuel says:
I don’t understand this one. I thought the purpose of the exercise was to see what effect the SSTs have on the strength of the storms “¢’¬? that’s why he is plotting SST vs PDI.
But to do that we need to look at the SST under the hurricane, not the SST a thousand miles away. What difference does it make if that masks an overall change in the SST? We can calculate that easily. The hard question is not whether there is “a climatological shift in the SST”, it is what effect such a shift might have on the power dissipation.
So overall, no, I’m still not satisfied with the explanation about the selection of the region.
w.
Wait, I thought the North Pole was melting at an “unprecedented” rate, we’re all going to die, flooding in Denver, blah, blah, blah.
“Contrary to that expectation, the web cams show that it was not until late July 2002”
“For the rest of the summer, the web cam pictures show only insignificant melt pond coverage until the deposition of new snow in late August.”
“the subsequent summer of 2003 also shows a somewhat belated (end of June) appearance of melt ponds”
319: I don’t follow that. None of the definitions that I linked to specified that it only (or even preferentially) or even at all, meant his imaginary thought experiment of some sort of perturbation experiment. They all taked about error to the mean or about biased sampling. Furthermore, we discussed missed storms and bias of landfalling versus non landfalling storms on this thread. I’m fine if bender wants to use the term for some sort of ensemble of imaginary universes. But I’m not fine that that is the only or the vanilla use of the term sample error. I would say the same if we were discussing stochastic finance issues.
TCO, sampling bias and sampling error are not the same. Sampling error is always with us. That’s related to the variance masking with the 5 year averages. Your “imaginary universes” is what is conventionally called the universe. Really, Bender is quite conventional. Try to get used to that terminology.
Sampling bias is something else, really, a much more difficult and fun topic. Yes, the the landfall issue is all about trying to correct for truncated or biased samples. William’s done some good work though the problem is hardly solved.
Sorry. Willis, not William. Great charts.
#177 — “To decrease the “likelihood” below 50% for AGW, given all of the supporting research, I would argue that a credible competing hypothesis is needed to explain what observations we do have. Solar variability (probably the most viable alternative) does not have a credible case . AGW, with whatever uncertainties we put on it, remains the best explanation that we presently have.”
This post has been answered by others in some detail, but I’d like to add that papers such as G. Bond, et al. (2001) “Persistent Solar Influence on North Atlantic Climate During the Holocene” Science 294, 2130-2136 show that solar variability has a very credible case. Based on 10-Be and 14-C data, and drift-ice, among others, Bond, et al., conclude that, “Earth’s climate system is highly sensitive to extremely weak perturbations in the Sun’s energy output, not just on the decadal scales that have been investigated previously, but also on the centennial to millennial time scales documented here. The apparent solar response was robust in the North Atlantic even as early Holocene vestiges of the ice sheets continued to exert a climate influence and as the orbital configuration shifted from that of the Holocene optimum to the quite different regime of the last few thousand years. Our findings support the presumption that solar variability will continue to influence climate in the future,…”
It’s not that solar influences have been eliminated as causal to current climate change, it’s that no mechanism is known despite the good empirical data in hand that the effect exists, and so GCMs can’t model it. So, it’s ignored in climate projections. On the other hand, AGW is not the best explanation we have, it’s the only explanation that’s allowed. And it’s not an explanation. It’s a rationalization (of the data).
These AGW “smoking guns” including Santer’s recent Hurricane pronouncement (‘we can’t explain it without adding enhanced CO2’) amount to one fudged model projection after another. We can know they’re fudged because the cumulated parameter uncertainty must be easily an order of magnitude larger than the CO2 effect they claim the GCMs detect.
Can I ask why the positive feedbacks that amplify the warming from CO2 do not apply to equivalent warming from solar influence?
#320 — Willis, really, isn’t it about time you published something? I’ve been admiring your analyses for a long time now, and they seem very strong to me. Why not write a critical review?
John:
1. Prove it. Google me up a definition that supports your point of view. Or cite some authoritative source. Textbook or such. I did that and found a bunch that I referred you to (have you examined them)?
2. “What might have happened if things were slightly different” is a thought experiment. It’s a perturbation experiment. It’s not the real universe. The real universe is what did happen.
3. The defintions that I googled included biased sampling as a type of sampling error.
http://www.google.com/search?hl=en&q=%22sampling+error%22+definition&btnG=Google+Search
Note that if Bender specifies that he is talking about a set of perturbation experiments, then sampling error, can be used to express the differences between observed examples and the set of “what might have happened”. but the term “sampling error” on it’s own does not mean that. A much simpler concept would be what is the difference between observed hurricanes and actual hurricanes. This is especially relevant pre-1950.
Actually most of the definitions differentiate between bias and “error of the mean” type random sampling error. I did find one on the first page that includes both errors within the use of the term: http://www.marketing.org.au/glossary/DICS.htm But, most do not.
That said, the sampling error of “observed hurricanes” versus “hurricanes that actually occurred” is a reasonable use of the term within this discussion. There is no reason for bender to expect Bloom to read his mind and know that bender is restricting the term to an ensemble of “what might have happeneds”.
Pat # 327
He has, it was concerning Tuvalu and JH’s paper.
There may be others as well.
Okay Willis, I’ll hold off judgment on weather the area he chose to average sea surface temperatures makes sense or not. Anyway, to me it makes sense that you get a greater correlation statistic if you choose a wider area to average over because you are averaging over more hurricanes so you should get less noise. The fact that you get a similar value averaging over larger area’s makes me think that the area he averaged over might not be a big issue.
I think there is a methodological error though because we are comparing a filtered version of the PDI with respect to time to a filtered version of the sea surface temperature. It seems like we are throwing away many degrees of freedom unnecessarily. I think a better approach would be to do a scatter plot and throw away the time dimension completely. It might even make sense to divide the sea up into grids and take say either the average or the peak of the storm while it was in that grid vs the temperature in the grid and do a scatter plot on that. This way we get several pieces of data for just one storm.
Maybe you guys should invite him over here. I mean Judy is willing to talk to the hoi palloi…
Re 314, John Creighton, you asked for the smoothing equation. Can’t copy and paste it, but here it is from the paper:
w.
Re 301, Dave Dardinger, you comment that:
This is a very valid point, and I would point anyone who is interested in the question to the Constructal Law, which explains it very well.
w.
That filter looks pretty safe. I am surprised he got such a smooth value only averaging 5 points.
For safety though the graph should stop at the year 2000 so that all points plotted are equally smoothed. Either that or error bars that increase by about sqrt(5) at the end of the interval should be drawn. Interestingly enough if you cut off the graph at the year 2000 the graph doesn’t look as dramatic. You still might get good r^2 scores though.
Re 326, great Viscous one, good to hear from you. You ask:
The reason is that these positive feedbacks that have a net effect of amplifying warming only exist in one place on earth … inside the GCMs. Everywhere else, the world is ruled by the normal rules of physics. In that world, the Earth’s has remained remarkably stable for a billion years.
If there were net positive feedbacks, the earth would have spiraled into either boiling or freezing millions of years ago. The fact that it has not done so is very strong evidence that the net effect of the feedback must be negative.
This fits with our common experience. For example, suppose we turn up the input heat on any type of heat engine. If we increase the heat input by say 10%, do we get 12% more power out of the engine, or a 12% rise in the cylinder heat temperature?
Of course not, we all know that losses increase with ‘ˆ’€ T, there’s no way the cylinder head temperature will increase even 10% … only in the imaginary world of a GCM do these kinds of things occur.
w.
Thanks Wills, you just wrote down what I thought.
The more papers on global climate change I read, the more data, (statistical) evaluations and GCMs I try to follow, the more signs of classical pseudo-science (in Poppers definition) I realise.
Thanks Willis.
It was really a rhetorical question.
But that’s okay, I think you knew that and gave a pretty good rhetorical answer.
😉
TCO, measured vs actual storms is a sample truncation bias issue. That’s a deep topic.
Storms that happened vs what was the mean of the system that generated storms that year, that’s sample error. That’s a topic covered in the first month of an entry level stats class.
Re #163:
Dr. Curry (while I try to catch up with the speed of this thread!), about the tropical SST/global temperature trends paralleling each other (doesn’t the tropical SST dictate the global temperature trend?), this implies that there is something fundamentally wrong with the climate models.
The bulk of the warming, according to models, is by GHGs. But the effect is substantially reduced by aerosols (mainly by cooling aerosols, caused by human made SO2 emissions, according to the same models). But this is contradicted by the highly different regional distribution and trends of aerosols vs. the rather globally trends in GHG concentrations.
For SO2, there is little trend in global emissions since 1975, but there is a huge difference in regional trends: some 60% reduction in Europe and somewhat less reduction in North America, against an enormous increase in SE Asia emissions. This should be seen in extra warming of the North Atlantic vs. less warming in the tropical belt of the NH Pacific Ocean.
But the North Atlantic shows a cooling period 1980-1990… I have no specific figures for the tropical NH Pacific.
But if aerosols have not the influence which is included in current models, that has a huge impact on the overall effect (including feedbacks) of GHGs. Both work in tandem: less impact of aerosols implies less impact of GHGs, or the models can’t fit the 1945-1975 trend. This must be compensated by an increasing influence of solar. With a simple climate model (EBM model from Oxford) one can fit the 1900-2000 trend as good as with the “standard” assumptions by reducing the climate response for CO2 in halve (1.5 K for 2xCO2 instead of 3 K), the aerosol response to 1/4th and increasing solar influences with a factor 1.5. The latter may be even higher, as there is an observed inverse correlation between low cloud cover and solar radiation (TOA), not included in current models. See further…
Thus it is interesting to see what happens with clouds, and specifically in the tropical belt. All models I know include a neutral to positive feedback from cloud cover. But all cloud cover observations point to a negative feedback (against increased SSTs)! That is mainly in the tropics and also in part in the Arctic (as you referred to). As this is already discussed on another blog, I insert here my summary. I expect an answer to some cloud questions (on IR behaviour of different cloud types) in a few days… The impact on the radiation balance by the observed cloud cover changes over the past decades in the tropics are one order of magnitude higher than what can be expected from increased GHGs (including feedbacks) in the same period…
The observed low cloud – solar irradiation correlation is for the 22 years of satellite era only. But if the effect is also true for longer-term solar trends, this implies a larger influence of the increase in solar strength 1900-1945 than from straight forward insolation alone, and subsequent increase in ocean heat content, even if the solar irradiation didn’t change much after 1945…
The observed ocean heat content increase over the period 1955-2003 is highest in the subtropics, see fig.2 of Levitus ea. (2005). This again points to cloud cover changes and increased insolation, specifically strong in the subtropics, as found by Chen ea. and Wielicki ea. There is, to my knowledge, no evidence that this is caused by GHGs…
Re #310,
Judith, you wrote:
What I have read from Wang and Key in Science (2003), is that there are trends towards less clouds in winter and more clouds in summer. Which leads to extra loss of heat to space in winter and less heating due to more solar reflection in summer. The extra cooling in winter is that strong that almost all of the increasing loss of ice area in summer is refrozen in winter. That makes that the winter ice area trend is less negative than the summer ice area trend… In that article, they point to the influence of the AO. This seems to be confirmed in the summary of the recent JoC article. But there they point to a global climate change – Arctic climate change link through the AO. As far as I have read, there is a link between solar (and volcanic) influences and the AO, due to stratospheric processes. Do you know of any (modelled?) link between GHGs and the AO?
Btw. while talking about AGW models, there is a fresh paper on atlantic and pacific SST calculations and simulations in Applied Physical Sciences: B.D. Santer et al.: “Forced and unforced ocean temperature changes in Atlantic and Pacific tropical cyclogenesis regions.”
Does anyone have access to this article? I would like to know a little bit more on what they did in their simulations…
~ghw
Newspaper story on the hurricane/AGW controversy. The writer gives a fairly balanced view.
Houston TX Chronicle
340: Give me the quoted definition and list the source.
#343 I’ve come to the point where I can’t believe in any result obtained solely via modelling. This is a good example. The entire paper is based on the assumption that we know and understand ALL forcing mechanisms. There are plenty of indications that we don’t. For example, there are a number of recent climatological observations that cannot be reproduced by models (decadal radiation budget variation, snow falls in Antarctic, sea surface temperature). Furthermore, there is indication that we don’t fully understand the influence of the sun on climate. Given all this, we can’t reasonably make the assertion that the evolution of sea surface temperature can ONLY be explained by GHG. That this result is obtained by hypercomplex models won’t change anything if the models cannot be trusted at 100%. Santer et al’s result is, in my opinion, at best useless, and at worst illusory. As long as models cannot reproduce EXACTLY all the features of the past and present climate, they should not be trusted. Unfortunately, all modelling science now is just trying to prove a predetermined conclusion. Bad, bad science…
340. Observed hurricanes comprise a sample of the population of occuring hurricanes.
As such, it is subject to both biased and random error.
Cross posted from RealClimate Tropical SST comment. I hope they post it.
I am curious about something. You state here about the difficulties of separating an oscilation from a trend when the timescale of the observed record is not sufficiently long enough to capture the entire oscilation. How is it then, that with global temperatures (where the ‘observed’ temperature record is only 150 years) you can state in MBH 98 et cetera that there is an observed trend?
It is my understanding that global climate oscilations are on the order several hundred years. For example the MWP lasted approximately 400 years and the LIA was about 300 years. Our observatial data only goes back 150 years and the reconstucted data is only valid back about 400 years (per NAS review of MBH in June 06). So it would appear that we have a similar problem with climate reconstructions as you have identified with the AMO. Our reliable dataset for climate is approximately as long as the oscilation timescale.
How then are these cases so different that you can determine a trend in one (climate) when you can not in the other (AMO) when both suffer from the same problem of an observational record that is not sufficiently longer than the timescale of the oscilation?
Thanks.
Re #343,
The press release is here and the accompanying Q&A is here. The paper itself is published in the September 12 issue of the Proceedings of the National Academy of Sciences (PNAS). One need to be a subscriber, or buy the issue…
There are already comments on this item in #113, where it is clear that there is a factor 1.2 to 5.1 difference between observed and modelled temperature changes (thus the models by far underestimate any regional change in the areas of interest)… And see my own comment in #303. I fully agree with the comment of Francois in #346…
Re #350,
Sorry, misread what was said in the oversight of #113. As Willis pointed out, they divided the observed temperature trend by the standard deviation of the combined model runs. This indeed is pure nonsense. For a good view of how models capture reality, they should have compared each individual “unforced” model variability with the observed natural variability. As that even is significantly wrong for the global oceans heat content (see fig. S1 in Barnett e.a.) for a few of the “best” models, that can’t be right for regional variability, as all models perform worse on smaller scales…
Re #349
Let us know if you get a response.
RE: #316 – getting dark now … then, that long, long night!
Thought experiment. In say, 1900, would Gordon have been recorded as a hurricane, tropical storm, tropical depression or possibly missed entirely?
RE #354 Ships would see swells and (a) run away, (b) be sunk or (c) survived, with a story to tell the grandkids. There would be no land impact. The swells might be seen as Gordon, or might be confused with another storm like Florence that just passed Bermuda. The event may or may not be recorded in a ship log, and even then, who really cared to collect the records.
So, I would say a less than 50% chance of being recorded, with any intensity guess biased towards the low end. Certainly there would be nothing factual.
This thread seems to open the issue of SST versus PDI to as many additional questions as questions are answered.
The part where I entered the discussion (as a naàÆà⮶e layman) was the effort to determine the robustness of the SST versus PDI relationship with location. The curves presented by Willis Eschenbach in post #297 of Kerry Emanuel’s plot of PDI and SST over a 30 year period are to say the least impressive. The “wiggles”, if reproducible, could be as or more interesting than the SST/PDI relationship.
Could someone like David Smith give a review summary of what has been shown to this point about the SST/PDI relationship and the robustness demonstrated?
My layman’s questions are:
1. Does the relationship that Emanuel shows for SST/PDI on closer inspection seem to be limiting in effect (and particularly when considering wind velocity and not PDI) and significantly different than the impression one might obtain from a mainstream media account?
2. Can the robustness of the relationship with location be easily verified by taking other boxes of points in the tropical Atlantic? (My understanding from post #297 is that another specific box SST and corresponding PDI has not been studied).
3. Would not the repetition of cyclic nature of SST (and PDI) from box to box be of considerable interest in better understanding this phenomenon?
4. Are or have any researchers looked to typhoons locations or other hurricane/typhoon generating areas for confirmation of the SST/PDI relationship?
5. Bender’s mentioning of insurance companies’ interest in these studies leads me to ask: What would be the metric to use that would best quantify potential damage to coastal regions? While PDI may be preferred when attempting to better explain the physics of the process, the damage potential would better be expressed, in my judgment, by the duration/frequency/wind velocity of the land falling part of hurricanes/tropical storms.
Re: 352 Here is the response.
[Response: First off, we are discussing attribution of observed trends, not the estimation of the trends themselves, so MBH98 or the other reconstructions are not really relevant. You are also confused about the validity of the proxy reconstructions: estimates prior to 400 years ago are just more uncertain than more recent data, not completely invalid. But on your main point, there are a number of differences between the global signal and any regional signal – the amplitude of the trend compared to the variability and the physical consistency of any natural component to that variability. At the global scale, the signal is much larger than the noise, but as you get to smaller regional signals, this is less and less true (so therefore it’s harder to attribute to any particular forcing). Secondly, at the regional scale natural osicllations produce warming in one part of the domain and cooling eleswhere – i.e. the energy is sloshing around the system. At the global scale this is much more limited. You could make an argument that atmospheric changes over the last 100 years are driven by energy coming out of the ocean, but the evidence is that the oceans are warming too. Instead, we have consistent theory and modelling that explain a large part of the changes as a response to known forcings with known physics and so the attribution is easier. In summary, the consensus on the driving of the global mean temperature is not a function of the mere existence of a trend, it is because we think we can explain the trend. – gavin]
And here is my response. I’ll quit hijacking this thread now.
If you include the uncertainties in the data prior to 1600 the current temperature is within that range of variability. Thus, the current temperature is within the natural variability and is not all that impressive, and you are left with a situation not unlike that which you described for interpreting the AMO.
So you are saying that in a larger system, with more variables, more complex interactions between the variables it is easier to spot a trend than in a small region with fewer interactions? In my experience with computer modelling, smaller systems are much easier to understand than large complex ones.
Again, this does not make sense. If the global system is an aggregate of all of the regional systems, then it should stand to reason that it too would show similar “sloshing” between regions. In fact, I have read here how periods such as the LIA and MWP were regional phenomena. Isn’t this a large scale example of the ‘sloshing’ you are saying doesn’t happen on a large scale?
Thanks.
re: #357
I suspect this is true, but does he really want to admit it? This is essentially what skeptics accuse warmers of; that they’ve accepted a theory and therefore try to shoehorn every observation into being compatable with the theory. When pushed they’ll agree that there are some problematic points but claim that the preponderence of evidence is on their side. In a sense this is ok, as long as they agree to defend their position against reasonable attack. But instead what we see is ad hominem counterattack, stonewalling and attempts to silence their opposition.
Off thread, but there’s an interesting new NAS study about the influence of the Sun on temperature. WARNING: I point to a summary by the Idsos, so those who don’t like them don’t have to look at it.
#358
Your response posted only to CA, or both CA and RC?
Re: 361
Posted to both.
Re: 359
Yeah I wanted to say something about the last line there that they “think” they have it figured out, but couldn’t really phrase it in a way that wouldn’t immediately get my post blasted.
On another note, do the points I rasied seem valid? Or am I off in left field somewhere? I have followed this debate for a while, but am not by any stretch an expert.
> 352, 357
Here’s how to find that, for those not familiar with the parallel discussions. It’s always best to post a reference so people can see for themselves what was said, if possible — akin to footnoting rather than just asserting something.
http://www.realclimate.org/index.php/archives/2006/09/tropical-ssts-natural-variations-or-global-warming/#comment-19001
Re 351, Ferdinand, you say:
The models are a joke. Here is a description of the GISS Model E III:
… and that’s just the problems with the model that are noted by the people who created and run the model …
w.
Re #356 Ken, I’ll take a shot at part of what you ask. I’ll try to condense things, at the risk of misstating something:
Emanuel’s belief’s seem to be:
* on average, higher tropical sea surface temperatures (SSTs) result in greater storm intensity and duration, which result in higher PDI.
* this increased PDI is due to the increased heat content of the sea. Other factors exist but are relatively minor players. Heat is King. Natural oscillations are minor, with the AMO probably not exisitng.
* the recent SST increases are due to CO2, with natural oscillations playing but a minor role.
My, and possibly others, beliefs are:
* on average, higher tropical SSTs, especially in the genesis region, result in greater storm intensity, duration and (probably) frequency, which result in higher PDI.
* but, SST is not the only factor that affects storm intensity, duration and frequency on a multi-year basis. Other factors include upper winds, humidity, temperature and pressure profiles, seedling strength when exiting Africa, etc. Heat is not king.
* there are natural multi-year oscillations in these factors.
* increases in CO2 contribute to the increased heat of the oceans, but the extent of the contribution is not at all clear. Natural oscillations may be dominant.
* basically, we don’t know if the last 30 years is a rocket to hell or just the upleg of a cycle.
* long-term data is limited and the quality is shaky. Educated guesses are often the best that can be done. Be cautious of people who speak with certainty.
Regarding data:
* My view of Emanuel’s Figure 1 is that it confirms that warmth in the genesis region tends to result in more, and longer-lasting (=more intense), storms and a higher PDI. But, the role of the higher SST is mainly to “get the seedlings growing” sooner and in somewhat greater numbers, which is not the same as “providing a richer fuel” proposed by Emanuel.
* I think that, if the Caribbean, Gulf and Bahamas SST are added to the genesis-region SST, his SST/PDI correlation weakens.
* I wonder if using only Northern Hemisphere SST data in his Figure 3 weakens that correlation.
* I have not thought about his Figure 2, other than to wonder why he did not extend his SST box farther west and northwest, and not so far to the east and south.
* I’m not entirely comfortable with smoothing the data. I’m not so sure that today’s (9/13/06) Hurricane Gordon is affected by last year’s SST, or by next year’s SST.
* I like to look at the wiggles in data and make sure I understand them, to the extent possible, and to see if they match up with other data. I see some things in Emanuel’s wiggles that I don’t understand and have been unable to match.
* I wish that reliable data existed for a long period, say 100 years, so that we could help answer the questions. But, it doesn’t.
* In all of this, I may be wrong! If I can find opposing data that is convincing, connected to a physical explanation that makes sense to me, then I will change my mind. But, not so far, not on this.
Bottom line: the key issue in all of this is whether Heat is King, or is nature more complicated than that. If it is shown that Heat is King then the urgency to do something about CO2 emissions grows. Thus, the political interest in the topic.
(My apology for the poor job of “condensing” this! I didn’t answer much of what you asked, but maybe this covers a portion.)
Re #357 Gavin’s response:
I think you learn a great deal in how the reply is couched and to me it is a very weak defense with the key word in “not completely invalid” being the “completely”. Of course, I do not speak the language and that could color my interpretation of it.
I think what he is saying here is something that describes the nature of things. One can have major differences from one local temperature to another but when they are all averaged together to obtain a global average that global average will necessarily be more limited. Since these are the definitions of local and global temperatures, I would not think that his reply, as given, could be argued. On the other hand, I do not think that he has answered your original question very well and I agree in essence with Dave Dardinger’s point “that they’ve accepted a theory and therefore try to shoehorn every observation into being compatible with the theory”. The answer to your question was very predictable given the views of the AGW consensus.
The subject does pose an interesting question for me. What fraction of all of the locally measured temperatures vary significantly more than the global average — say over the past 30 years — and by how much and why?
Re #326: I believe that the same feedbacks do apply and they are in fact present in the models. Do you have evidence that when the models are run with variations in solar forcing, the water vapor feedback and other such feedbacks are somehow “turned off”?
Re #337: Willis, positive feedbacks are in fact ubiquitous in physics (and in nature). If they are strong enough, they lead to well-understood instabilities that are very important in the field of pattern formation…which explains everything from the formation of snowflake crystals (and other dendrites) to ripple patterns in sand on the beach to (I believe) even the stripes on zebras to the formation of droplets (rather than a steady stream) of water coming out of a slowly running faucet to the turbulence in fluids. [Eventually once the system is driven far enough away from the original state, negative feedbacks tend to come in and stabilize things. After all, even Venus with its runaway greenhouse effect doesn’t have the temperature running off to infinity.]
Note, however, that a positive feedback does not have to lead to an instability. For example, one can get a convergent series: If each degree of warming due to some external forcing like CO2 produces an additional half a degree of warming due to feedback effects on the warming due to the original forcing (which then leads to feedback effects on the feedback and so on), then this doesn’t lead to an instability but rather to the situation where you have 1 + 1/2 + 1/4 + 1/8 + …, a convergent series. Thus, the net effect is a magnifying of the original external effect by a factor of 2.
Therefore, your statement about being able to argue from basic observation on the earth’s past history that the net feedback must be negative is not correct. In fact, one actually has to do the hard work of estimating the forcings and the climate change that was produced in order to see how the feedbacks operated. When James Hanson did this for the ice age — interglacial oscillations, he got good agreement with what the climate models are predicting (i.e., roughly 1.5 – 4.5 C temp increase with a doubling of CO2). Similar checks have been performed looking at the Mt. Pinatubo eruption and the cooling effect observed by that.
re: #365
Thanks, David for your review and comments. It would appear that Emanuel has left room for some skepticism.
You comment that the above is part of Emanuel’s belief, but you are not saying, are you, that his current work under discussion makes any inferences, direct or indirect, about the relationship of carbon dioxide to global warming.
Re #342 Ferdinand, here are some references re AO and greenhouse warming
Rind D, Perlwitz J, Lonergan P
AO/NAO response to climate change: 1. Respective influences of stratospheric and tropospheric climate changes JOURNAL OF GEOPHYSICAL RESEARCH-ATMOSPHERES 110 (D12): Art. No. D12107 JUN 21 2005
Rind D, Perlwitz J, Lonergan P, et al.
AO/NAO response to climate change: 2. Relative importance of low- and high-latitude temperature changes JOURNAL OF GEOPHYSICAL RESEARCH-ATMOSPHERES 110 (D12): Art. No. D12108 JUN 21 2005
Bengtsson L, Semenov VA, Johannessen OM
The early twentieth-century warming in the Arctic – A possible mechanism JOURNAL OF CLIMATE 17 (20): 4045-4057 OCT 2004
Moritz RE, Bitz CM, Steig EJ
Dynamics of recent climate change in the Arctic SCIENCE 297 (5586): 1497-1502 AUG 30 2002
Fyfe JC, Boer GJ, Flato GM
The Arctic and Antarctic oscillations and their projected changes under global warming GEOPHYSICAL RESEARCH LETTERS 26 (11): 1601-1604 JUN 1 1999
Zorita E, Gonzalez-Rouco F
Disagreement between predictions of the future behavior of the Arctic Oscillation as simulated in two different climate models: Implications for global warming GEOPHYSICAL RESEARCH LETTERS 27 (12): 1755-1758 JUN 15 2000
Re #341 Ferdinand, here are a few comments
The tropical SST doesn’t force the global surface temp. the CO2 forcing is spread evenly over the globe, but other forcings have spatial variability. Even with the evenly spread forcing, this generates motions in the atmosphere and ocean that then result in a spatially varying temperature response. When you add forcings with spatial variability, then you get even more spatial variation in the temperature response. Re the importance of the tropics, i would say the two most important things are the deep atmospheric convection that transports heat and moisture into the atmosphere and then sets up the equatorward part of the pole-equator temperature gradient that drives the atmospheric circulation. The argument made by Emanuel where the tropical sst follows the global SST is to support the tropical SST being forced by the same mechanisms as the global surface temperature (external forcings) rather than internal variability
Re the interplay of sulfate pollution aerosols and CO2. Since they are coming from the same source, it seems they should influence climate in the same way (but with opposite sign). CO2 has a long lifetime in the atmosphere and so gets mixed globally in a pretty even way. SO2 aerosol has a much shorter lifetime and stays relatively close to its source, but it can be advected considerable distances. In the winter/early spring, the arctic is quite polluted owing to advection of aerosols from mid latitudes with little depletion from precipitation scavenging. But any warming/cooling from local forcing tends to get smeared out owing to atmospheric circulations.
Less impact of aerosols doesn’t imply less impact of GHG. greenhouse gases accumulate, and the rate of accumulation has been increasing. Aerosols, on the other hand, don’t accumulate. the aerosol that is emitted say in 1945 is all washed out before 1946, so there is no longterm accumulation of aerosol. When the aerosol emissions slowed down, the amount of aerosol in the atmosphere decreased quickly. If the CO2 emissions were to slow down, it would take some decades for the CO2 concentrations in the atmosphere to diminish. So there is no need to invoke solar variability to explain this. However, the amount and nature of the aerosol forcing back in 1945-1975 is not as certain as one would like.
Clouds are the most vexing aspect of climate models. It is extremely challenging to simulate phase boundaries in a nonlinear system. Cloud feedbacks are probably the single greatest reason for the discrepancies among different climate models. The way people calculate and determine cloud feedback tends to be rather naive, and it is not really clear how best to evaluate climate model simulations of cloud feedback using observations. In the first IPCC assessment report, they had a statement about clouds being the biggest uncertainty. clouds no longer loom very large in these assessments (aerosols seem to get the most attention), but in terms of W/m2, clouds definitely have the greatest impact and are associated with the greatest uncertainty.
there is a new blog called Head in a Cloud http://atoc.colorado.edu/headinacloud/ still early days, and the content seems a bit light, but it is a good topic for a blog, will be keeping my eye on it.
RE 284: Judith Curry writes:
I’ve read his climate material from the early 80’s (but not so much in the last 6-7 yrs), and I’m quite sure made it clear he believed “some of the warming is caused by humans but it wont cause any harm.” quite early on, perhaps by the late 80’s/early 90’s.
Beng is indeed correct. Pat Michaels put an estimate on the warming for doubling of CO2 in the late 80’s. From a congressional testimony:
I heard Pat Michaels speak in the late 80s/early 90s and his message at that time was certainly “some of the warming is caused by humans but it wont cause any harm.” I have heard him speak at other times since then too and on no occasion have I heard him say that “there is no warming” or “there is warming but its not caused by humans.” Does Judith have a quote from his writings supporting her claims?
#370 — “the CO2 forcing is spread evenly over the globe.” CO2 is spread evenly over the globe, but why wouldn’t one expect the forcing to dominate where insolation is strongest, namely in the tropics?
Further, given this observation: “It is extremely challenging to simulate phase boundaries in a nonlinear system. Cloud feedbacks are probably the single greatest reason for the discrepancies among different climate models. The way people calculate and determine cloud feedback tends to be rather naive, and it is not really clear how best to evaluate climate model simulations of cloud feedback using observations.“, I fail to understand how anyone can credit GCMs to produce valid projections of future climate or to extract a 4 W/m^2 forcing from a ~40 W/m^2 uncertainty (from clouds alone).
“* I’m not entirely comfortable with smoothing the data. I’m not so sure that today’s (9/13/06) Hurricane Gordon is affected by last year’s SST, or by next year’s SST.”
That is an interesting point.
Re 367, Joel, thanks for your comments. You say:
I should have been more detailed in my description. Yes, there are positive feedbacks in nature (although they are hardly “ubiquitous”), and yes, you can have positive feedbacks without runaway feedbacks. And no, I wouldn’t believe a word that James Hansen said unless I did the math myself. I have shown several times on this web site how on different occasions he has played fast and loose with his numbers, and drawn totally unwarranted conclusions. And the fact that his calculations agree with the climate models makes me trust them even less “¢’¬? I have shown on this site, and others have done a better job of showing that the models are a long, long ways from reliable.
I still say that the stability of the Earths temperature, being on the order of +/- a few percent for the last few billion years while the sun’s strength has increased by 30%, and we have had meteor strikes, and volcanoes, and a host of other disturbances, strongly argues that the net feedbacks must be negative. Even the existence of the ice ages shows this stability “¢’¬? the earth goes from one stable state (glaciers) to another stable state (interglacials), and while in either state, the fluctuations in temperature are about one percent, a couple of degrees, despite all perturbations. This bi-stable behaviour strongly argues for net negative feedback.
There is a further issue, however. This involves losses to the system. For example, a fairly significant increase in insolation over the tropics leads to a much, much smaller increase in temperature than the forcing would imply. Why? Because the climate system is a heat engine, one running at optimal turbulence, and as a result, much of the increase in input only goes to increases parasitic losses, not to increased temperature.
These parasitic losses, in the form of evaporation, transpiration, conduction, convection, turbulence, and hydrometeors, have the effect of radically decreasing the temperature change from a given change in forcing. Before we can even get to the range of a positive feedback, we first need to overcome the net combined effect of all of these losses, which is huge. These losses are all proportional to temperature in some form, either absolute temperature or delta T, so they all increase as temperature increases.
Finally, any analysis of the feedbacks in the climate system must deal with the fact that the climate is a heat engine that is not running at full throttle. It is only running at about 70% throttle, with about 30% of the energy reflected out of the system, mostly by clouds. A 1% change in the throttle setting is about 3.5 w/m2, so it is a very sensitive throttle “¢’¬? a 1% change in the throttle has about the same effect as a 100% change in CO2.
Obviously, this is a dynamic control system. Given the stability of the earth’s climate, it is obvious that increasing temperatures must shut the throttle down, and vice versa. Fortunately, this is what we’d expect to happen, since increasing temperatures lead to increased evaporation, which leads to increased clouds, which reduces insolation. This is the main negative feedback system, the one that is badly misrepresented (as positive feedback) in the GCMs. See Judith’s post 370 for more excellent information on clouds.
w.
PS – the change expected from a doubling of CO2 is about 3.7 W/m2, according to the IPCC. Now that is about 0.7°C, based on thermodynamic principles. The models, on the other hand, claim a warming of 1.5 to 4.5°C. The upper end of this range implies a huge feedback, a feedback of almost one degree per degree (0.93°/°).
Besides being unlikely, this high a feedback is also highly unstable. If it changes by 5%, to 0.98, the upper range goes up to 6.2°. And of course, if it goes over 1, it runs away … all of which makes the upper end very doubtful.
There is also a logical problem in the claimed mechanism for this feedback, which is that it involves water vapor. The theory goes like this: as CO2 increases, temperature increases. As temperature increases, water vapor increases. As water vapor increases, the greenhouse effect of the water vapor increases, which drives the temperature up further, and presto! Positive feedback!
Do you see the logical problem? It’s not immediately obvious, in fact, I just thought of it myself.
The problem is, any given amount of additional forcing can either a) heat the planet or b) evaporate water. It can’t do both, it’s like a dollar, it can only be spent once. So if we’re getting increased evaporation, whatever energy went into evaporating that water didn’t go into increasing the temperature. Thus, we can’t add the heating from the CO2 plus the heating from the increased H20, we also have to subtract the cooling from the increased evaporation.
In any case, it doesn’t matter, since the increased cloudiness overshadows both … but it is an interesting logical point.
w.
Hmmm…….Interesting post Willis. So temperature is relatively stable because the earth sweats when it gets hot. Kind of like sitting next to a humidifier where the evaporating water cools the surrounding air. The earth must be warm blooded, lol.
Re David Smith 365 and John Creighton 375, you say:
Clearly, it’s not affected by next year’s SST, that’s for sure … also, smoothing artificially increases the r^2 of the correlation of two datasets, so the apparent high correlations (0.88, 0.80) of the SST and the two PDI datasets are exaggerated …
There is another problem with smoothing the data, which is that it greatly increases the autocorrelation. As a result, the effective number of data points is decreased, and the significance of the trends is exaggerated.
In fact, after adjusting for autocorrelation there is no significant trend in any of the three datasets in the Emanuel graph below:
How can that be, I mean, look at the curves going up? Well, three things. First is that there’s not a lot of data points in each series, only 34 points, because of the annual averaging. Second is that all three of the datasets are highly autocorrelated, in part because of the smoothing. After adjusting for the autocorrelation, the trends become meaningless.
The other is purely visual, because of the chart. Here is the chart again, but with the origin at zero …
See any great trends there?
So the crazy part of all of this is … we’ve been discussing trends in hurricanes that are not even statistically significant … go figure.
My best to everyone,
w.
In addition to the comment of Willis in #376:
Indeed there are positive and negative feedbacks in nature. But as Willis pointed out, the overall feedback must be negative (or at most slightly positive), or we should have had runaways in the turbulent past.
About the models: all models I am aware of only include positive feedbacks. Even for clouds (neutral to positive). Which is why they “project” such huge increase in temperature from CO2 emissions. But all available observed evidence points to a strong negative feedback by clouds to increased sea surface temperatures. See page 58 (and a lot of other interesting pages) of J. Norris
Further, about the models: in almost all cases the models use similar sensitivities for the four main forcings: solar, volcanic, GHGs and aerosols. That means that for every W/m2 change in forcing, the same change in temperature is expected (within margins: some models include an “efficacy” coefficient, like 1.4 for methane and 0.92 for solar). But that is certainly wrong for solar and volcanic, as they have important influences in the stratosphere, which are not seen for GHGs and aerosols, which have their main effect in the (lower) troposphere.
See e.g. the test with the HadCM3 model, where they tried to make a better attribution of the different sensitivities and concluded that solar maybe underestimated with a factor 2.
Even that may be an underestimate, as they did do the model runs with a fixed sensitivity for aerosols. Without that, the distribution of sensitivities might have been much more diverse…
Re #378: Just for starters, Willis, I do see a slight problem with a scale that postulates a tropical SST of zero. As for the rest, by all means email your results to KE.
Willis,
This is completely left field stuff but if a variable is intensive, ie temp, ppm, density, and so on, then summing them it preposterous.
Say you have 3 temperatures – 3C, 4C and 10C – adding them together does NOT mean 17C.
Or if you have ppm – and added them – 200 ppm + 350 ppm – does not yield a combined physical object with a composition of 550 ppm of say Au (gold)
So there is a distinct possibility that all the statistics done on intensive variables are essentially invalid.
The stats are valid in only one case – when the sample support for the measurements is constant – ie in geochemical prospecting we collect 50 grams of soil per sample and have it analysed. All samples are 50 grams hence any compositions so measured can be easily manipulated statistically.
The problem with temperatures is that it is a measurement of 2 physical objects in thermal equilibrium – the thermometer and the physical object it is in contact with, in this case and unspecified volume of ocean water if it is SST. What is the sample support in this case? If its different then that creates immense problems for any subsequent stats.
It’s a well understood problem in the mining business and mineral exploration but otherwise most scientists seem to be unaware of it.
Just a wee intellectual hand grenade for your use with the useful idiots that comment here.
Thanks Judy for the references in #369, will take a few days (and money – again) to digest it.
About #370: I am following the aerosol findings for some years now. In general, there are problems with the attribution of observations to natural and anthropogenic. In many cases the in-situ observations point to more natural aerosols (of which terpenes form similar drops as SO2) than currently implemented in chemistry/aerosols models which are used to calculate the anthropogenic forcing (see e.g. Heald ea.). See further my comment at RC about aerosols (without any response from the specialists…).
The basic forcing of GHGs is not the point in the aerosol/GHG combination. The problem is in the real impact of aerosols. If aerosols have a huge impact (forcing + feedbacks), that results in a huge impact (including feedbacks) for GHGs. If aerosols have a small impact, then GHGs have a weak impact too (or with other words, there is less positive feedback). This is what was discussed at RC which includes a nice graph, showing the influence of the sensitivity for aerosols. If anthropogenic aerosols have zero impact, the resulting sensitivity for 2xCO2 is 1.5 K (according to models…). For -1.5 W/m2 impact of aerosols, the result is 6 K at a double CO2 concentration. Both give the same fit for the 1900-2000 period for the instrumental record and are necessary to explain the observed 1945-1970 cooling.
Further, there is relative little impact of aerosols in the Atlantic storm genesis zone, most is going NW from North America in the direction of the North Atlantic/Greenland/Arctic, due to the prevailing wind direction. Even if the full reduction of aerosols in North America and increasing GHGs are accounted for, the results don’t match the observed increase in insolation of some 2 W/m2 (they are a factor 10 too low) in the past decade(s) over the full 30N/30S tropics. The real impact is from a small observed change in cirrus clouds, which follows (or leads?) the increased SST. According to Chen and Wielicki, this points to natural variation… In fact, this is equal to the theoretical impact of the total growth of GHGs since the start of the industrial revolution on halve the surface of the earth. Thus this may be the forcing (or feedback or natural cycle), which dictates global temperatures (and tropical storms…).
I have posted a few comments and questions on the “Head in the Cloud” blog already in the past and expect some reactions in a few days (received an email from the moderator)…
re 280: “Two proposals are on the table at NOAA to reduce errors in T profiles: 1) spend $1B/yr to have UAVs drop reference radiosondes; 2) use COSMIC plus ground based reference radiosondes (+$5M/yr).”
From NewScientistSpace:
RE: Slightly OT #360
I also think it’s the sun that is little understood in these computer models, and many publications are ignored by climate science “peers”.
http://tinyurl.com/f4695
“From Dimming to Brightening: Decadal Changes in Solar Radiation at Earth’s Surface”
Martin Wild,1* Hans Gilgen,1 Andreas Roesch,1 Atsumu Ohmura,1 Charles N. Long,2 Ellsworth G. Dutton,3 Bruce Forgan,4 Ain Kallis,5 Viivi Russak,6 Anatoly Tsvetkov7
Variations in solar radiation incident at Earth’s surface profoundly affect the human and terrestrial environment. A decline in solar radiation at land surfaces has become apparent in many observational records up to 1990, a phenomenon known as global dimming. Newly available surface observations from 1990 to the present, primarily from the Northern Hemisphere, show that the dimming did not persist into the 1990s. Instead, a widespread brightening has been observed since the late 1980s. This reversal is reconcilable with changes in cloudiness and atmospheric transmission and may substantially affect surface climate, the hydrological cycle, glaciers, and ecosystems.
Maybe there should be a whole Sun topic? there’s another paper Tom Brogle posted OT inside the Europe topic as well:
http://www.sciencemag.org/cgi/content/short/308/5723/850
RE 379: Ferdinand writes:
I think it has to be negative overall since the sun was significantly dimmer (25-30%?) several billion yrs ago & the climate relatively stable over this period. If not, the temps would have increased much more than they have since that epoch. That doesn’t mean the global net feedback is always negative at any given point in time, tho. Ex. The glacial ice sheet (expanding & contracting)/albedo feedback, which is obviously positive, dominates at times.
Quote from Solar Radiation and Climate Experiment SORCE, NASA pages:
“Despite all that scientists have learned about solar irradiance over the past few decades, they are still a long way from forecasting changes in the solar cycles or incorporating these changes into climate models. One of their biggest obstacles has been technology. Because even the smallest shifts in solar energy can affect climate drastically, measurements of solar radiation have to be extremely precise. Instruments in use today still are subject to a great deal of uncertainty”
re: #378
Willis E., to this layman, your comment in post #378 on the autocorrelation effects in Emanuels’ SST and PDI wiggles is well taken, but the reconfiguring of his wiggles graph by scaling from 0 to 30 degrees centigrade, while showing better the small magnitude of the temperature differences (PDI scale was not included), I would not think have any bearing on the case Emanuel is making. You could have shown the wiggles in degrees Kelvin from 0 to 303 degrees K.
I do have troubles intuitively thinking about these small degree changes in temperatures and the seemingly large effects that they are purported to have. I made a reference to temperatures in comment # 366 (referencing Gavin’s reply) where to be clearer I should have referred to differences in temperatures from some long term average, both locally and globally, or “anomalies” as I believe the term is used by climate scientists.
376, Willis:
Great observation. The reason that life exists on Earth, and the reason for the relative stability of the climate is because of the amazing unique nature of water.
RE: #379 – This may be a naive sounding question, but I fail to understand why the models are premised on positive feedbacks? Any physicist (or other hard sciences or engineering person) worth their salt already knows that you would model things like explosions or nuclear reactions with positive feedbacks, but not most natural processes. Am I missing something here?
Mark this moment in history. Mann has conceded (or at least allowed Gavin to concede) that the AMO likely does exist. For those not entirely familiar with the Atlantic Hurricane, East Arctic Sea Ice and other related debates, warmers tend to discredit the AMO. Some have stated it does not exist. The quote, from the current thread on SSTs:
“Does the AMO even exist as a climate phenomenon absent the complications in detecting the signal in actual observations? Here the answer is probably yes.”
Willis, re #376,
Starting from the premise that I don’t know what I’m talking about, I don’t see the logical flaw you speak of.
An increase in CO2 can raise the temp which in turn causes more evaporation which in turn causes more heating.
Its not the same as an individual spending a dollar bill once. Isn’t it more a case of following that dollar bill through the economy as it changes hands?
I do however agree that the point is merely a mootable one because the net effect in the real world is more clouds and less heat.
TCO, you appear to have an obsession with semantics and an aversion to logic. I do not ask Bloom to “read my mind” as to what I mean by sampling error of random variables (such as hurricane counts). I only ask that he, and you, look up in a proper time-series analysis text, such as Chatfield, how one goes about making inferences in the case of stochastic time-series. Some of you (but not john lichtenstein) continue to miss the mark on what it means to have only a single sample of output from the entire population of possible outputs from the terawatt heat engine planet Earth. Quit complaining about my choice of words, and start paying attention to the problem.
Consider a familiar dynamic system, such as your car, where the mechanic will perform 2-3 or more runs of a test to make sure he has correctly diagnosed a problem. This is because he knows intuitively that nonlinear dynamic systems are chaotic and will spit out some noise amidst the signal he’s looking for. In the case of cliamte change we are trying to figure out what the Earth is doing, and we’ve only got a single data stream to work from. It is a capital error, fatal, to assume this one sample IS the entire population of samples.
If you want to make inferences about trends in stochastic time-series, you better get your heads around this concept. GCMers & paleoclimatologists included.
r^2 is not “correlation”, by the way.
r^2 is a regression coefficient of determination.
r is Pearson’s correlation coefficient.
The two are obviously closely related, but not equivalent. Notably r is always higher than r^2 as r is in the range[0,1].
Re #378:
Exactly my point that started this thread. What do the correlation coefficients, r, drop to, Willis, when the raw data are used as opposed to the smoothed data?
Re #319
Somewhat. She explained that this was not her decision to make. She also pointed out that the paper was submitted well before Katrina and the AGW-hurricane debate became a political hot-button issue. Which means that they were not actively suppressing uncertainty for the purpose of influencing policy. (Although I hasten to point out: that was the unintended consequence.) My sense is that she understands the nature of the data analysis problem and will pay closer attention to this, and related statistical issues, in the future. She’s clearly not interested in deceiving anyone, including herself. Which is admirably Feynmanian.
“An increase in CO2 can raise the temp which in turn causes more evaporation which in turn causes more heating.”
Should be worded (If I understandad Willis correctly).
An increase in CO2 can raise the temp which in turn causes more evaporation which in turn cools the overall climate.
Evaporation of water has a cooling effect, and is the basic driver of the hurricanes that are moving heat energy from the Ocean to the atmosphere. At the end of the day the heat moves to the atmosphere, so the atmosphere is warmer, but the sea surface is cooler. And to retain the excess water in the atmosphere takes more heat, it does not create heat. Eventually that water is lost, cooling the atmosphere.
It’s all moving energy around, but energy is lost in each step, not gained. (this is just part of the cycle, there are obbviously other drivers)
Therefore while CO2 definitely has an effect on this cycle it cannot increase the total heat energy in the atmosphere without an additional energy input.
Willis please feel free to correct me if I got any of the above wrong.
#396,
Sid, I was referring to the theory that once the water is evaporated it then contributes to warming.
I am in agreemnet with willis that more water vapor is a net negative but that’s not the warmer’s theory and is, I think, seperate from the logical problem willis posed. Yes evaporation has a cooling effect but the argument is that once its evaporated its an overall net gain. A process not an event, in other words.
And I think Willis point is that it is not a net gain. That the warming added by the absorption characteristics of water vapor is offset by the work required to put it in place to absorb.
But I really think it is Willis that needs to address/clarify this point.
What a howler!
“NOAA ISSUES UNSCHEDULED EL NIàƒO ADVISORY”
http://www.noaanews.noaa.gov/stories2006/s2699.htm
“Unscheduled!” And just in time to “explain” the totally failed forecasts of a catastrophic 2007 Atlantic hurricane season.
Shades of Dr. Theodore Landscheidt! He must be smiling down on the warm Pacific and the calm Atlantic.
Doesn’t the theory go like this? CO2 absorbs IR from the surface and thereby increases warming. The warming increases evaporation of water (which of course also cools the water surface from which it came–so no net effect here). The added water vapor also absorbs IR from the surface, thereby providing a positive feedback loop.
re 389: Sadlov said:
“RE: #379 – This may be a naive sounding question, but I fail to understand why the models are premised on positive feedbacks? Any physicist (or other hard sciences or engineering person) worth their salt already knows that you would model things like explosions or nuclear reactions with positive feedbacks, but not most natural processes. Am I missing something here?”
Positive feedbacks with gains less than one are rampant in nature. And in engineering. For one example related to what you said, Sadlov, look at any nuclear power plant, which requires positive feedback to maintain the chain reaction, but with limited gain to keep it from continuing to an immediate massive energy release.
Another important example from biology is phosphorylation of Cam Kinase II, which regulates the efficacy of transmission at some neural synapses. There is a positive feedback, where partially phosphorylated enzyme auto-phosphorylates itself at additional sites and cross-phosphorylates other CamKII, amplifying the intiial week signal that led to the initial phosphorlylation. But there is gain less than one, AND there is a saturable response, so the positive feedback is not catastrophic to the signalling pathways in which it participates.
I’ve heard this called ‘amplifying feedback’ as distinct from ‘positive feedback’ butI dont know how general or correct that usage is.
jae
Yes that is 100% correct for how far you have gone.
You did include the loss at the evaporation point.
What you haven’t added in is the added energy required to keep the water vapor in its vapor state. Does that or does that not exceed the amount of warming that the vapor induces, and if it does exceed, how much.
Water vapor left to it’s own devices will condense out of the atmosphere, added energy must be constantly input to keep it in the atmosphere in it’s vapor state. What is the sign of the energy required to keep it in its vapor state in relation to the warming it induces.
PS.
“(which of course also cools the water surface from which it came–so no net effect here). ”
Actually there is a net effect and it is negative, not positive. Any work done requires energy.
Evaporating water simply MOVES heat from one place to another.
Unless the heat is moved out of the system (eventually beyond top of atmosphere) the local cooling is irelevant to global “temperature” (really, global heat, but temp is the best proxy and most immediate and relevant result we have to look at). The heat simply moves somewhere eelse, where eventually it ‘releases’ when the evaporated water rains out.
402/404: Yes, and when that water molecule is warmed by the IR from the surface, it rises and condenses, which releases the warmth to space. And the cloud it helps form blocks the Sun and causes MORE negative feedback. That’s why I think the models have it backwards.
Re: #405
Which is how clouds can be detected from space at night.
Barney, you say in #391,
No. A given quantum of energy can either raise the temperature, or it can evaporate water. It cannot do both. Your statement is missing the cooling, and should read:
In practice, however, this process is often short-cut, with a photon striking the ocean surface and knocking a water molecule into the air. This is evaporation without any corresponding heating. It is worth noting that this same process (change of state with no heating) takes place during the both the melting and the sublimation of huge quantities of ice and snow every year.
Lee pointed out that evaporation (and, although he didn’t mention it, sublimation and melting) only moves heat from one spot to another, and thus it does not matter because it does not affect the total heat content of the system.
However, this is not entirely accurate for several reasons. One is that the metric we are interested in is the surface temperature, because that’s where we live. Evaporation, melting, and sublimation all cool the surface.
Second, when water is evaporated, it is often moved up near the tropopause. There it is well above most of the CO2 in the atmosphere, so it is free to radiate directly into space. So while evaporation only moves heat, it moves it to a place where it can easily escape the system entirely, and thus it cools the entire system.
Finally, this water, with the heat content removed, is precipitated directly to earth in the form of hydrometeors, further cooling the surface, which as mentioned above is the metric of interest.
It is always worth remembering that all of these are parasitic losses that reduce the efficiency of the greenhouse system. The greenhouse system creates a temperature difference between the IR emitting atmosphere and the surface. If it worked perfectly, with no losses, the surface would be much, much warmer than it is now. (Assuming the 235 W/m2 current insolation, a perfect greenhouse would give a surface temperature on the order of 60°C.) However, all of these losses (evaporation, transpiration, conduction/convection, and hydrometeors) serve to cool the surface by reducing the efficiency of the system. Note that because they are losses, none of them heat the surface “¢’¬? they all have a cooling effect. Evaporation and wind and rain all make the surface cooler.
Because they are parasitic losses, proportional to either T, or to Delta T, or to W/m2, they all increase as the temperature goes up. Any assumed positive feedback would first have to overcome this increase in parasitic losses, which can be very large.
w.
One thing which complicates matters is that the greenhouse effect isn’t simply a pin-ball mechanism where CO2 in the atmosphere absorbs a passing IR photon and immediately re-radiates it. Instead, the odds are high that it will give up the energy to another sort of molecule via collision long before it would have radiated. This means that enhanced greenhouse effect will result in heating the atmosphere as a whole. This warmer atmosphere will then be more likely to emit CO2 radiation (and that of other GHGs)both becasue it’s easier for a given CO2 molecule to accumulate sufficient energy to do so and because there are more CO2 molecules. This means more IR will be sent to the surface to heat it. This additional surface heat will then send more IR than it would with the old amount of CO2 in the atmosphere in a positive feedback with a low gain. As has been pointed out, this will result in the surface becoming warmer by a degree or a degree and a half C with a doubling of CO2.
Now as Willis and others have pointed out, this additional IR going to the surface may simply evaporate water instead of warming the surface. And as the warmers like to point out, this additional water vapor will also act as a positive feedback on the greenhouse effect, again with a smallish gain. But what the warmers miss and Willis and others have pointed out, is that the earth’s temperature is moderated and has been for billions of years by water. There’s no particular reason to expect that the water content of the atmosphere is far out of balance in terms of what’s needed to maintain the present temperature. Therefore a warming of 1.0-1.5 deg C would probably result in a negative feedback from the total water system rather than a positive one. The temperature will go up, but it might well not go up the entire 1.5 deg C from a doubling of CO2. But that’s just speculation. Obviously the earth has a temperature spread at any given time of a couple of hundred deg F. (from whichever pole is in winter to a summer desert). This spread produces all sorts of weather and we can only look at a statistical snapshot and determine a few of the various things happening.
I’ve said for a long time that we’re foolish to imagine we know enough about the system to propose public policy based on what we know. Those proposing public policy to reduce CO2, like the Kyoto Accord either just want control of public policy for other reasons or have been brainwashed into believing we know far more than we do.
#408. I’m not sure your description is correct. Here’s how I think about it. The extra CO2 will trap a bit more radiation at 15 um, the lower edge of the CO2 absorption band, but this will become rapidly thermalized by a variety of collision and radiation mechanisms. That is, the radiation will be redistributed so that the atmosphere will have a new Planck distribution for a temperature of T + dT, where dT is the temperature increment due to the added energy. The energy’s origin as 15 um radiation trapped by CO2 will be lost.
Next , how could this create a water feedback cycle? Let’s give the warmers a 4C rise in 100 years. The current average global temperature is about 15C. So in one year’s time we’d get about 0.04C rise in atmospheric temperature. This is not going to do anything to evaporate much water into the atmosphere for the simple reason that heating of the ocean (or land) by a thermal bath at 15C or 15.04 C is exceedingly slow. Typical diffusion scales are a few meters per year for an effect that is exponentially damped. So after a year at 5m depth the temperature will have increased by 0.04/e C about 0.01 C. I don’t think it’s going to increase the vapor pressure of the water by enough to send enough extra vapor into the atmosphere to cause the famous feedback. I’d guess that they get it because they think in terms of a CO2 bomb that suddenly doubles its concentration.
Since this is a diffusion process, the surface is always going to be cooler than the atmosphere. The only way to get real heating of the surface is via the shortwave solar radiation in the visible and UV.
I read Patrick Michaels’ 5/10/06 AGU paper titled, “Sea Surface Temperatures and Tropcial Cyclones in the Atlantic Basin”.
Michaels looked at each storm from 1982 to 2005, with no double-smoothing of data or missing graph scales. He looked at the SST beneath individual storms, no data boxes, no missing regions. His work is good.
I recommend it over the Emanuel work we’ve been discussing for anyone interested in the details of SST versus storm intensities.
Bottom line is that he finds a relationship between SST and storm intensity, but not nearly to the extent suggested by Emanuel.
Folks (Willis and others): Yes, it takes energy to evaporate water but the energy is released when the water condenses to form clouds. Admittedly, since a warmer atmosphere will have a higher average amount of water vapor in it than a colder one, there will be some transient amount of energy required to re-equilibrate. However, this is sort of a one-time deal, whereas the additional water in the atmosphere continues to have the long-term effect of trapping more of the sun’s energy that reaches the earth (and is then re-radiated by the earth in the infrared).
As for Paul Lindsay’s comments, scientists know very well how the equilibrium vapor pressure of water varies with temperature. The GCMs don’t assume that the relative humidity remains constant in the atmosphere (and thus that the water vapor increases proportionally to the vapor pressure as the temperature increases); however, this does seem to be what the GCMs roughly predict. And, this prediction has now been tested and seems to be holding true. [See B.J. Soden et al., Science, Vol. 310, pp. 841-844 (October 8, 2005).]
Re #408: Dave, I just hope that you are consistent in your belief that you can’t take public policy action until you are sure of something. For example, I really hope you were one of those marching against the invasion of Iraq…which was a public policy decision made based on a lack of information if ever there was one.
Re #406: John A, I don’t believe that you are correct regarding the detection of clouds. I don’t think it is the heat energy due to the condensation that you are detecting (which I would assume is largely transferred by conduction and convection processes rather than radiation). I think you are merely looking at the radiative energy that is released by all objects. In the case of clouds, they show up as being colder when the clouds are higher in the atmosphere (where it is colder) and warmer when the clouds are lower in the atmosphere (where it is warmer)…and warmest where it is clear and the radiation you see is coming from the ground.
411.
No one is saying that heat isn’t being transfered upwards, that is in fact the entire point.
And energy is lost. When it translates from liquid to capor the energy required is more than it contains.
Same when it condenses out of the atmosphere.
IT also requires energy so long as it remains as water vapor in the atmosphere, If additional energy is not constantly input it will condense out.
Re #410 And if you were to abuse Michaels’ data by smoothing it or summing it over 5-year classes, would this exaggerate the relationshiop in the expected way?
Re #410: The Michaels paper has been ignored. I’m curious if you have any idea as to why.
410 (Michaels et al paper):
I saw Bob Davis present the findings from that paper at the AAG (American Association of Geographers…home to many climatologists) conference last spring. It seemed like a very good paper. Many of us were expecting something more controversial, but they really covered a lot of bases. In the paper (and presentation) they assert that the SSTs alone are not sufficient to explain the differences in hurricane and strong hurricane frequency between the two periods (1982-94, 1995-2005), since a) they found that hurricane intensities are positively correlated with SST up to 28.25 C (and not correlated above that threshold) and b) the average maximum SSTs encountered by major hurricanes in the two periods were not very different anyway (28.95 C vs 29.28 C). But yet the later period had a 50% increase in storms above the threshold that also became major hurricanes. So, they say, given the negligable effect of SSTs above the threshold on hurricane strength, SSTs are not sufficient to explain the increase…and by extension, either is AGW (stated somewhat differently at the end of their “potential implications” section).
The one good question asked by someone in attendance had to do with oceanic heat changes at depth. In other words, were things like the depth of isotherms different between the two periods (as in this map, showing the depth of the 26 C isotherm)? Anyway, it will be interesting to read the comments. The comment-reply exchange between and Michaels et al. (2005) and (Knutsen_Tuleya (2005) in the Journal of Climate (I think) was very entertaining.
re: #412
Sorry Sid, that’s just not true. Nor do I know where you get such an idea. As long as the humidity is below saturation, water vapor will stay in the atmosphere as long as it’s at a constant temperature. But since water vapor is less dense than other atmospheric gases, humid air will have a tendency to rise, other things being equal, and as it rises, it will cool (lapse rate and all that), and eventually the air will become saturated and water droplets or ice crystals will form.
Re 409, Paul Linsay, thank you for your contribution. You say:
While I basically agree with you, I would caution you about getting caught, as I have been caught many times, by what I call the “illusion of the average”.
By the “illusion of the average”, I mean two very different things.
The first is that temperature is an intensive rather than an extensive variable. An extensive variable, such as mass, changes with the volume of the subject in question. As an example of an extensive variable, if we take a pile of sand and we divide it in two, we get half the mass of the full pile in each half-pile. This dependence on volume allows us to come up with an average density, which is the mass divided by the volume. We can do this calculation on the full pile of sand, and each half pile, and get the same density.
An intensive variable, such as temperature, is not related to volume. If we divide the pile of sand in half, we don’t get half the temperature in each half-pile. One result of this is that we cannot use the common operations with temperature, such as addition or averaging, without making further specifications regarding other conditions such as density, volume, pressure, relative humidity, and the like. That is the illusion of the average with regards to temperature. We can’t do a simple T + ‘ˆ’€ T like we’d expect.
The other “illusion of the average” is contained in your statement that:
In the real world, however, nothing is at average. No one place is balanced. Nothing is stable. The equatorial areas absorb much more radiation than they emit. The water there is not at 15°C, but at 30°C or so. The poles, on the other hand, emit much more radiation than they receive.
We all love averages, they make things much more tractable. But a slight increase in an average may actually represent a slight reduction over a large area combined with a large increase over a small area. Since many of the climate effects are non-linear (evaporation, for example, is proportional not to T, but to T^4), we may come up with incorrect results unless we abandon the average and look at the bits and pieces.
w.
Dave if the water changes state, and returns to liquid form or solid form it has to give up energy, and it will cool. NO process happens without loss, so some energy has to be lost. Water in vapor state has to change state down to liquid, and liquid has to change down to solid absent outside influence.
What you say just doesn’t make sense to me from a physics perspective.
But I’ll concede to a reference that explicitly discusses it or a benderisim or Willisisim.
413:
Bender, the paper did not present year-by-year numbers. It was not really a look-at-this-here-trend sort of a paper. It actually took two clumps, 1982-94, 1995-2005 and compared them for their SST and SST-threshold-crossing characteristics (and that was only the second part of their results section). But if you smoothed the two clumps, or presented them on a graph of time-clump on the x-axis and major hurricane number/proportion/frequency on the y-axis, then, yes, it would exaggerate the relationship (although they actually set out to discuss the exaggerated relationship).
414:
When Davis presented at the AAG, there were a few of the hurricane middleweights there (like Liu, who organized the session). The reaction was mixed because on one hand there was a concession to the influence of rising SSTs (and Davis just came right out and called it global warming), but on the other hand the downplaying of the effects. If the paper has been ignored, it is probably because there wasn’t anything earth-shattering in it. As they state in the paper, the theoretical limit to intensity had been identified two decades earlier. They realy just did a confirmatory study that was pretty much in line with the “consensus,” except for the part where they brush off attribution to AGW. But maybe I, being not quite in that loop, am missing something. Is the paper being ignored? And why?
re: #418
Then it’s no longer water vapor and you said water vapor needed a constant energy imput to keep from condensing.
Does not compute! Just what is your chemistry or physics background?
I’m not talking any deep stuff. This is elementary. At a constant temperature and pressure a mixture of gases like the atmosphere will be stable. I think you’re confusing things like water droplets in a cloud which would need to have energy added (generally from upward moving thermals) to keep from falling. But you were talking water vapor and that’s a whole other thing.
Bender: I gave various definitions for the term. By the way, the term has validity in more then time series and in fact the non-term series are the ones found frequently. The reason for my semantics kick is not to show you in a minor flaw, but because YOU were unfairly tweaking Bloom and trying to bully him. And I know enough to call you on it.
OT, but people are talking about clouds in this topic, so
Nature News Feature (link):
I thought this project was put down in 2001..
Dave.
It’s -5 degrees outside. You heat up water till it boils. Then, remove the heat source. Will the water stay melted forever, or will it freeze?
“I’m not talking any deep stuff. This is elementary. At a constant temperature and pressure a mixture of gases like the atmosphere will be stable.”
I’m not talking deep stuff here. Without energy being input and keeping it at equilibrium the temperature will not be stable it will fall and the water will return to it’s liquid state.
You show me yours, and I’ll show you mine. Your the one that thinks all states of mater are constant and that entropy does not exist.
Sorry, missed a paste.
“Just what is your chemistry or physics background?”
You show me yours, and I’ll show you mine.
Re #419: Kenneth, I think it’s being ignored pretty much for the reasons you state: Fairly obvious results given the parameters of the study. That it found some SST influence isn’t even especally amazing for the Michaels team, who for many years have not argued with AGW as such but say that the likely scale of it isn’t much to worry about. Given the defects I describe below, my suspicion is that their study was designed to find a minimum of influence.
But just to summarize in no particular order some of the thoughts I had when I read it:
— SST in a hurricane’s path is only a proxy for water temps averaged over the depths where the heat content is actually available to the hurricane.
— Hurricane speed needs to be taken into account. For example, all else being equal a fast-moving hurricane moving over a limited area of very warm water will not be able to intensify as much as a slow-moving one.
— An SST metric needs to be selected that has some relation to the specific path and size of a hurricane. Michaels et al selected much larger areas that could only have had an approximate connection to the SSTs directly encountered by the hurricanes. Note that they provided no rationale for selecting the metric they used.
— It would be interesting in addition to looking at SST in the path of hurricanes to look at SST behind the hurricanes and examine the difference for significance.
I think there is sufficiently fine-grained SST data available to do much or all of what I suggest above. Temps at depth aren’t available at the same level of detail, although maybe using the 26C thermocline would have some value. A full-scale study along such lines would be very labor-intensive, but one could start by taking a small sample of hurricanes and comparing the results of using different metrics, then proceeding on to a larger-scale study using the metric found to be most appropriate.
BTW, I’m a climatology amateur and don’t claim any particular insight into the hurricane field, but I do read most of the literature.
Re #422:
The CLOUD project now has sufficient funding to be realized. But it will take several (at least 5-6) years before the first results will be available… The funding papers gives the idea that the experiment goes beyond GCR-cloud connections and will include other ionising radiation/electrical charges influences on cloud formation.
Pending a similar question of mine on other blogs, I pose it here too, maybe someone has a good idea?
– (low level) clouds are reflecting ocean emitted IR in such quantities, that they reduce the overnight cooling of the surface. But as clouds are mostly fine water droplets, that means that the IR is mostly immediately reflected or absorbed/re-emitted (to all sides, including – in part – through the cloud to space), and that little (if any) is permanently absorbed. If substantial amounts of heat would be absorbed, this should warm the cloud droplets and ultimately the cloud would disappear.
– If most of the cloud droplets re-emit (reflect) IR, shouldn’t that be the case for the skin of the ocean surface too. That means, immediate re-radiation (reflection) without much absorption, thus no/little heating of the ocean below the skin.
– What about the different wavelength spectra: ocean surface emitted IR has a temperature dependent spectrum. Does this change for CO2 (or other air molecules) re-emitted heat (after absorption) and/or cloud droplets, due to the colder temperatures at the altitude of re-emission?
Re #412 and following…
Sid, once water is evaporated (which needs a lot of energy) there is no reason at all that it requires energy to keep it in that state. The water molecules simply are travelling around surrounded by air molecules. As long as the air can bear them. That is where the (relative) humidity comes in. As long as the temperature of the air is high enough, water will not condense out. But when air is moving up, the temperature lowers until the point that the air becomes saturated (colder air can bear -much- less water) and the excess water will condense, releasing (more or less) the same amount of energy that was required to evaporate it. This slows the cooling, as there will be a dynamic equilibrium between further cooling and heat release due to water condensation.
#426
Thanks for the link! Interesting documents, and RC comment is interesting as well.
Re #421
1. Minor flaw!? Not.
2. People and institutions that make statistically indefensible claims (something about “unprecendented warming trends in 1000+ years” comes to mind) and then persist in their ignorance when they’ve been shown to be wrong deserve to be tweaked. That’s the way science works.
3. It was Bloom that started upping the ante, assuming he was right and I was wrong and then going all in with that silly, blustery post about counting the fingers on his hand. But he was so colossally wrong that now my attempts to teach him a lesson look in hindsight like bullying. Remember, no one knew I was an authority on time-series analysis before that exchange broke out. It wasn’t bullying. It was necessary to establish just how wrong he was. Because he was making the inferential mistake that a great many warmers and proxy recosntructionists are still making. I won’t bully anyone if they behave reasonably and admit when they are flat wrong.
4. I will continue to provoke all charlatans on Bayes, who is now being invoked as a viable alternative to classical time-series methods. Bayes is a dodge. Bloom’s kind of dodge.
5. YOU are the bully of the town! Are you going to reprimand yourself when you get unruly? Which is frequently.
RE #414 Steve B, please enlighten me. His approach sure looks solid to me. If it is the NYT, not a surprise. If it is for scientific reasons, I will be surprised.
David
Re #430 Sorry, Steve B, I had not seen your #425 reply when I wrote #430. I certainly support using even finer-grained data, if available.
Question: would your points also apply to the Emanuel peper?
re:224,
Ok, though you know that was a rhetorical question.
High School Chemistry 8th in Ohio in state scholarship tests among small schools. Physics 2nd in state among small schools (Hon. Mention overall) SAT science results 99+%ile
BS Chemistry (ACS with 4 sem calc. +2yr German & 42 Sem. hr Chemistry) Minor in math (1 hr short of hrs needed for major) Physics 1 hr short of minor, only missed because I had a combined honors Chemistry – Physics class as a freshman and it only counted for 14 hr rather than 16 hr.
Some additional physics in grad school (Quantum Mechanics) MS biochemistry.
re: #423,
Don’t be a fool, ET, the same would be true of CO2 or even O2. Remove heat from the sun and the entire atmosphere would eventually condense. You were singling out H2O. But as a gas it’s no different than any other gas. If you’re saying you merely meant that water vapor has to have a constant heat flow through the system (from sun to surface to atmosphere to space) then it’s trivially true but unexeptional and misleading by design.
#417, Willis, thanks for the reply. The point of my comment, not clearly expressed, was that the only physical way to model the addition of CO2 is incrementally. The result is that yearly changes, even in a “static” atmosphere, are miniscule. Throw in all the other complexities of the earth’s atmosphere/ocean system and the additional trapped energy probably gets lost or attenuated so that it’s doubtful that the additional energy will make much difference in the climate, or even accumulate over 100 years. I think we agree.
re: #410
I would be interested in a discussion contrasting the work of Emanuel’s with that of Michael’s –which in the intervening posts appears to be underway. How is the limited correlation of storm intensities with SST up to a given temperature explained?
#428
Ferdinand,
Many of the processes you described can be graphically computed on Skew-T log P charts. Years ago this was the standard way forecasters and scientists computed things like vapor pressure, equilibrium levels, mixing ratios, convective and lifted condensation levels, etc… I think the Skew-T has gone the way of the slide rule. While computer automation is more effiecient, sometimes seeing the basic processes at work visually helps.
Ferdinand.
“As long as the temperature of the air is high enough, water will not condense out.”
And how does the temperature of the air stay high enough without an input of energy.
“the same would be true of CO2 or even O2.”
So Dan Darlington, now we move onto insults, You agree with Ad hominem attacks do you.
Yes of course it would be the same for CO2 or O2 or any gas. Heat is transferred to water, it evaporates into water vapor. Without an additional influx of energy it will cool down and condense out (And yes this is true for every gas, when exactly Dan did I not say it was true for every gas Dan?) I did not single out H2O We were discussing the water cycle and it’s impact, I never said that this was not true for anything else. I also didn’t discuss the molar weight of the noble gasses, because they were irrelevant to the discussion at hand. I guess we can add fallacious arguments to Ad Hominem attacks.
As with your last statement.
Water vapor is in the air, without constant heating (very small amount per molecule ) it will return to it’s liquid state. It receives this (Small amount of heat) from the atmosphere, the atmosphere receives it from the sun. But to quote Willis’ point. That heat is either warming the H20 to keep it in its state, or it is warming the atmosphere, not both.
So again Dan, Dave whatever. You seem to want to pick an argument with me on something that you actually agree with, but you seem to want to spin it so you can make me look wrong. Why do you feel the need to do this on a regular basis, why do you feel the need to comment to me for any reason.
Water vapor will not stay in its vapor state without constant warming/energy influx this warming/energy influx comes from the atmosphere around it. Don’t say so long as the atmosphere is the same temperature, because this is what we are talking about, water vapor is part of the atmosphere. Without constant energy input it will cool.
And yes this holds true for Oxygen, carbon dioxide, Nitrogen etc. Please point out where I said it was not true for those. The atmosphere is in a constant state of trying to cool towards absolute zero, as is most everything in the universe, without the energy from the Sun it would do so. To keep the atmosphere at the same temperature requires a constant input of energy.
How exactly am I wrong again, and why do you feel the need to go through this every few months.
“Ok, though you know that was a rhetorical question. ”
If by rhetorical question you mean thinly veiled insult to my abilities, then yes I will agree with you.
I have no formal physics education beyond high school, I read physics books for pleasure.
I did however spend ten years working in the Optics industry, with very little training in theory.
RE: #409 – general ping to a great example of REAL SCIENCE. Anyone have a problem with that?
428,
and I would add that it is essentially energy that gets the air moving up. Buoyant “parcels” require a sufficeint input (or throughput) of energy to create the unstable relationship that gets them moving up (and then expanding, cooling, condensing) in the first place.
437 (Sid),
If you and Dave are saying the same things, you are doing it in very different ways. :0
Anyway, your post in 412 may have been shorthand for what you meant. In any case, if you are talking about the hydro cycle, you need to account for the energy that is required for convective precipitation: energy (we call it Convective Available Potential Energy, CAPE, before it is utilized) is required to the heat the surface (or midlevel/mixed layer) sufficiently for to give allow for the vertical motions which then lead to cooling and condensation of the same air parcel. Energy is spent to get it to the point of condensation. Without that energy input, convective precipitation would be impossible. So it adds a layer of complexity to what you and Dave are arguing, and I think is the difference wetween what you are saying and he is saying, though I can’t quite tell.
437,
JP, meteorologists still use skew-Ts extensively, and they are essential for severe weather forecasts. In the classroom, we have our intro meteorology students (non-majors) hand-plot with the step-cousin of skew-Ts: the dreaded “stuve” diagram. For anyone interested, skew-Ts (or stuves) are great tools for understanding the water vapor/temperature/pressure/height relationship…and you can derive a tremendous amount of information from one sounding plot.
If anyone cares at all about this diversion, I’ll post some links. But only if asked. We’re far enough OT that I will save the bandwidth unless asked.
“If you and Dave are saying the same things, you are doing it in very different ways. :0 ”
Ken I know this. I’ve said it at least twice. Dave is the one telling me that I am wrong. I agree with Dave’s statements as far as they go. Please let Dave know that he is agreeing with me in his examples, but then says that I am wrong. You don’t have to tell me I have already conceeded this and pointed it out myself.
HE states “vapor will stay in the atmosphere as long as it’s at a constant temperature.”
What he ignores is that to stay at a constant temperature requires an input of energy. Which is what I stated, though not in those precise terms, I assume a certain level of knowledge on the readers part.
Typo clarifications in my response to Sid (my last comment):
This beauty, “is required to the heat the surface (or midlevel/mixed layer) sufficiently for to give allow for the vertical motions,” should be the same except with just one coherent prepositional phrase or split infinitive, rather than 3.5 incoherent ones!
Sid,
But also, adiabatic cooling is dependent on an input of energy. So, interstingly, if you consider the vertical profile of the troposphere, more energy is required to initiate the adiabatic cooling process than to maintain a constant temperature…which is why the argument should probably be framed differently. If one of you is talking about convective processes and the other is not, then you are talking about two different things altogether. It is unclear if you are talking about one, the other, or both. That’s all I’m saying.
RE #436 Ken, here is a comparison:
Emanuel uses SST in a box (6-18N, 20-60W). It is an average of the monthly means for August-October in the box.
Michaels looks at each storms’ actual track. He looks at the time the storm passed over each 1 degree by 1 degree grid of the ocean. He uses the SST of that 1×1 grid the week before the storm (to avoid data contamination from the storm passage). This is to approximate the SST that each storm actually experienced. This is done for all storms, June thru November.
To expand a bit, here’s some data: for 1990 through 2005, there were 212 named storms in the Atlantic. (I picked these 15 years for convenience, and can do others, if someone wishes.)
Of the 212, only 76(35%) spent any time whatsoever in Emanuel’s box. Only 15 storms (7%) reached their maximum wind speed inside Emanuel’s box.
That includes all Atlantic storms. In his reply to Willis, Emanuel shows a double-smoothed plot of “PDI – MDR events”, to narrow the focus to “box” storms. Of the 76 “box” storms, only 15 (20%) of the MDR storms reached peak wind speed inside Emanuel’s box. Let me say that again: 80% of the Emanuel’s “box” storms reached peak wind speed outside the box.
And again. Peak wind speed is the key factor in Emanuel’s PDI. But, only 20% of the “box” storms reached peak wind speed while experiencing “box” SST.
By contrast, 100% of the storms used by Michaels passed over the individual temperature (1×1) grids used by Michaels.
As a side note, not a single “MDR storm” passed through the 6N – 9N portion of Emanuel’s box, which constitutes 25% of his box.
You decide!
Bottom line: We shouldn’t need to do this kind of A vs B comparison shopping. If these guys produced turnkey scripts and performed sensitivity analysis to check the robustness of their assumptions – two things I think all reviewers and journals should insist upon as part of an accountability & due diligence supplementary data package – then we wouldn’t be having this discussion. The scripts, data sets, and conclusions would be directly comparable.
Ken
I was only talking about one particuarly “energy sink” if you will. What is a negative feedback, and that is the energy required to keep water vapor in the vapor state. In earlier posts I mentioned other things. I agree the convective proces also requires energy (though interestingly a very small amount compared to that required to evaporate water, that was covered here over a year ago between Dave and someone else I don’t recall).
THere is also the energy required to evaporate the water, there are many scavenger process that eat up water. This is Willis point that some have been arguing with. They (the warmers) say (paraphrased), “CO2 warms the surface, evaporates water, this water contributes to greenhouse warming”. As it goes this is true, the issue at hand is how much, there are scavenger process that take away from this. Just like a car looses power to turn the alternator, and AC pump, power steering, cooling etc. You just can’t say, the engine creates X horsepower, you have to account for losses. The same is true with the water warming feedback. The reality of this feedback is just like tree rings it is an inverted u. At some point losses are greater than gains, and vice versa. It is not a simple equation.
adiabatic cooling, is part of this, convection is part of this, and so is the energy required to sustain a specific condition. I was talking only about the latter. By mentioning one point does not automatically mean that I disagree on all others.
eat=heat
Re #445: “This is to approximate the SST that each storm actually experienced.” Exactly how well does their chosen metric do this compared to others they might have used?
Note that Michaels et al sought to draw some very precise conlusions about the relationship between their SST metric and hurricanes, and Emanuel did not. I suggest you carefully re-read the second through fourth to last paragraphs of KE’s paper in which he describes why it may not be a useful exercise to look for too precise of a relationship between SSTs and hurricanes.
In the same vein, recall Judy Curry’s comment from #63 above: “Patrick Michaels in a recent GRL paper attempted to track the SST underneath a tropical storm, but that turns out to be a not very useful thing to do since there are so many variables involved in the evolution of an individual storm, not to mention the fact that the storm itself modifies the SST.”
Re #448: Stay away from the spicy food, Sid. 🙂
Re: # 445
Thanks again David for an informative and insightful summary. Your comparison certainly directs to me to spend time looking at the Michaels’ paper.
Re #450: Something there is that really, really, really wishes the Michaels et al paper wasn’t mostly useless.
Re #449. What other metric might have been chosen? SST a thousand miles away?
Steve, can you help me understand something:
1. Look at the graph which Emanuel sent to Willis (post #297). It shows PDI versus SST in the “box” (MDR). (Thankfully, it has a scale for the SST). Looks like a 0.35C rise from circa 1973 to 1980, then a 0.25C drop to 1984, then a 0.35C rise to circa 1988 then a 0.35C drop to circa 1992.
2. Now, look at Emanuel’s Figure 2 in his 6/13/06 paper with Mann, which shows cyclone count versus the SST in the “box” (MDR). What I see is a 0.25C rise from 1973 to 1980, then a 0.05C drop to 1984, then a 0.1C rise to 1988 then a 0.05 drop to 1992.
Why aren’t all his SST “wiggles” the same in both papers? The magnitude of differences may sound small, but they are key to his correlations.
I read that one is “double-smoothed” and the other is “decadally smoothed”, whatever those are, but I don’t know why you’d use one technique in one case, and another technique in the second case, nor why there would be such significant differences between techniques. I thought Emanuel said that SST across the tropical Atlantic were closely correlated both geographically and time-wise. Why change smoothing “techniques”, especially if it affects the correlation?
Maybe you can spot the explanation in the body of the paper, but I have missed it.
I am also surprised that his graph with Mann includes tropical cyclone count data prior to 1900, when I thought that most parties (including Judith) agree the pre-1900 Atlantic storms were undercounted.
Help me understand.
Thanks,
David
A theoretical paper on hurricanes by Bengtsson et al., summarized here:
http://www.worldclimatereport.com/index.php/2006/09/15/more-stormy-weather-ahead-for-hurricane-doomsayers/
may create a few headaches for some people. Interesting reading in any case.
I acknowledge my unruliness. I’m still waiting for you to respond to an entire googled page of definitions of sample error which did not refer to time series. And for you to supply a specific definition and source which restrict or even define the term specicifally in terms of time series. [bully on] Mush.
re: #445- David,
I agree with your summary of the Emanuel vs Michaels analysis of SST vs. hurricane intensity. The major difference is whether the SST is measured along the storm’s path. Emanuel’s analysis does not achieve this. I find it very surprising that Emanuel finds any correlation at all.
re #449- Sampling the SST shortly before the storm’s arrival avoids Judith’s comment that the SST used in the analysis is affected by the storm. David already stated this in #445.
re #451- And please explain why the Michaels et al. paper is “mostly useless?”
395 – Thanks Bender. That makes sense. When I first read How to Lie With Statistics, I found myself saying “Oh. I need to be more careful about that.” a lot. Maybe Judith would put confidence intervals around the 5 year averages if she did it again. Live and learn.
TCO you are looking at sources who are using the term sample error the way bender is, but you are just not seeing it. You need to find a knowledgeable source you trust and ask him.
TCO, I’ve scouted a bit for some good online sources and here is a preliminary report.
To understand the statistical behavior of stochastic dynamic systems you have to understand ergodicity, and that means being able to get the gist of texts such as this one on Probability, Random Processes and Ergodic Properties.
And if you want to see exactly how sample variance is defined for an ergodic stochastic process, here is a succinct excerpt showing how to calculate it.
Can I do better than this? Probably. If need be. Rather than searching the phrase “sampling error” you might try “ergodicity” + “sample variance”. That will narrow your search to include only material from the time-series literature. But what’s online is limited. Nothing beats going to the good old library and starting with Chatfield, and going down the row. (In a library the books are all lined up by topic. You don’t have to search through random junk on the web.)
TCO, you love the old-time monogrpahs. Here’s one for you from the Bureau of the Census 1989 on Modeling time series subject to sampling error.
re: #452
After reading Michaels’ paper, this layman is inclined to say that the methodology described in his paper makes more sense intuitively than Emanuel’s. Michaels’ R^2 factors, indicating SST explains very little of the wind velocity variation in Atlantic basin tropical storms, compared with Emanuel’s R^2 factors in the 0.8 range for PDI versus SST would seem to put their results at definite odds. If I were to judge whose calculations are more susceptible to innocent data snooping and/or cherry picking, I would definitely have to go with Emanuel’s.
Even with the low explanatory value of SST for wind velocities in Michaels’ paper, his data would indicate that the number of hurricanes would increase by how often his threshold temperature is exceeded, but that the intensity of these hurricanes once that threshold is exceeded would not necessarily increase with further increases in SST. Since the average area temperatures in that basin have increased only a few tenths of a degree centigrade over the last 50 years, Michaels’ results would not have predicted an increase in hurricanes or the intensity of these storms due to that level of SST increase over that time period.
It would be interesting to see what the predicted increase in frequency of hurricanes would be with say a 1 degree increase in the average SST over the basin area of interest using Michaels’ results.
I would like to make a general comment about the discussions of the mechanisms for carbon dioxide, water and cloud feedback and their hypothesized effects on temperatures that I have read on this thread.
Some of the not so well thought out and personalized mechanisms, while interesting sometimes when viewed in isolation, seem to be a less efficient way of looking at and criticizing the theories put forth by scientists publishing in this area. I do not mean this as criticism along the lines of a Dano, who sometimes seems to imply that unless you can write a paper with an opposing theory you cannot critique the paper.
I would like to see more discussion of published current theories and criticisms of these theories. I believe I am at least partially aware of the chinks in the carbon dioxide and water feedback theories and the lack of good understanding of the effects of upper and lower level clouds on feedback and resulting temperatures, but I would be more interested in discussing published papers than unpublished personal theories.
My input here is for my own selfish interests and may not have anything approximating a consensus backing it up.
456: You have not addressed the specifics of my cited, googled definitions. Nore have you supplied one. Go grab a textbook, type the definition of sample error and cite the source. Put up or shut up.
457 and 458:
A. Just give me the wording of the definition from Chatham and the citation (include a page number). Or another written source. If you are so much in the right, it should be easy for you to back yourself up. I would think if you were so much in the right and Bloom were such a boner for not seeing it, you would have an easier time finding an online definition. But fine. Give me an off-line one.
B. You still have not adressed the entire page of googled references for “sample error” and “definition” which I provided. None of them discuss perturbation experiments or ensembles of “what might have happened” in chaotic systems.
C. YOUR MONOGRAPH SUPPORTS ME! Did you read it? They use sampling error not to mean some sort of chaotic change in population from year to year, but rather the very vanilla one of imperfect observation of an entire class because one looks at a subsample WITHIN THAT year. The analog is to imperfect observations of the number of hurricanes! Not to variation from year to year in the actual number of hurricanes. The discussion of the time series is about the interaction of that vanilla form of sampling error with various models of time series. Essentially about how ARIMA models interact with imperfect estimates OF THE SPECIFIC YEARLY POPULATION. Please reread the peice. I also welcome the other stats jocks on this board to do so and to back me up on the usage of the term sample error in that article.
Bender: Your pieces on ergodicity are interesting and “are what I KNEW you were talking about”. Note that they don’t use the term “sample error”. This exactly fits into my point, that while upbraiding Bloom you were NOT using the right terminology for the effect that you wanted to describe.
On the 217 page Gray reference: Please cite the specific page that supports your restrictive (or even non-restrictive) use of the term sample error.
re: #463 TCO,
I don’t know what the stats gurus here will say, but I think I now have a better insight now on where you disagree with Bender.
Bender is saying that the “entire class” is not the number of actual hurricanes in a given year, but the population of potential hurricanes based on the objective situation in a hurricane basin. From that there is an actually produced subset of hurricanes and of those there may or may not be any missed in looking for them. It’s suspected that there are some missed in the older days, but probably not at present. But there’s definitely only a subset of the potential produced in any given year and that’s why you need to look at the likely “sample error” before comparing hurricanes between various years or eras.
Let’s say you were scooping up samples of a run of gidgets with a wiremesh scoop. Now you’d want to know the number and mean size of the sample. But if someone pointed out that there were a few meshes of of shape which might allow some samples to escape you might need to estimate also how many escaped and if there would be a bias in the size of those which escaped. So the sample error that you’d be primarily interested in would be that of the overall sample scooped up compared to the total bin of product, but before you could do that you’d need to figure out if gidgets were missed and if so if they effected the results of your testing. This is a different sort of sampling error and I think the one you’re thinking of rather than the error of the first sort.
Dave:
Right. I know all that. I’ve pointed it out before. I have no problem with bender using the term in the context of year to year variation with the caveat that the process is random, that the variation is from chaotic issues in the system rather then the forcing itself (a distinction he has not yet made btw).
He just needs to distinguish this usage from the usage of the term as applied to sampling error of observed versus actual hurricanes in a given year. (Especially if he is upbraiding someone on not knowing the concept. The concept of “sample error” is a larger set then just “year to year variation” of random processes.)
It’s also amusing to me that his example, the 1989 monograph about sample error and interaction with time series analysis, is about the sample error of WITHIN YEAR estimation of a population because of imprecise measurement. NOT about year to year variation of the process itself. Have a look at it and comment…
Re #459: Ken, you seem to be avoiding focusing on the metric Michaels selected relative to others that might have been used. Please read my #425 again. Putting it preceisely, is it reasonable to think that there would be a very good relationship between intensity and averaged SSTs in a 1×1 grid during the week before the hurricane got there? What does theory tell us about the manner in which SST affects intensity, and how would that reflect on the metric?
re: #467
I was comparing Emanuel’s versus Michael’s methodology and not against your suppositions. Intuitively yours make less sense to me than Michael’s — in fact some of it makes no sense to me.
Re #468: From which I conclude you need to read up on how SST affects hurricanes. Emanuel’s papers relating to that are available on his site.
Before everyone gets worn out, I just want to say “thank you” all. Thank you bender and willis, thank you Judith, thank you Steve M. for hosting the blog. Thanks for the interesting and often insightful comments and references from David Smith, Jean S, ET SidViscous, Ken Fritsch, Douglas Hoyt, fFreddy, welikerocks, Ferdinand Engelbeen, Kenneth Blumenfeld, jae, Pat Frank, John Creighton, UC and all the others that added to better understanding. (And even thanks to the Dano character for some amusing moments and occasionally interesting references, even if they often came at the expense of irritating bender). I believe better science will come forward directly as a result of this thread.
A few comments on the selection of SST regions.
Lets consider the NATL as a specific example. The classical Main Development Region does not encompass the entire region where tropical storms initiate; in fact this season we saw some of the earlier storms develop fairly close to the U.S. So there is the region of genesis (which varies somewhat from year to year and over the course of the season. Then there is the region where storms that are going to make it to major hurricane status do most of their intensification; this is to the west of the MDR (closer to the U.S.) and probably the months of Aug/Sept only need to be included. Then, if you are looking at one of the integral intensity measures like ACE and PDI and its relation to SST, then arguably you should be looking at the region encompassing the entire storm tracks (which occasionally even go up to Nova Scotia). If we were to conduct a sensitivity study on the different regions/strategies you might select for this, I suspect it wouldn’t make a huge difference to the conclusions you would draw (but would arguably make some sort of quantitative difference to the results).
The other thing to consider is that it is not just the SST that is changing, but it is also the the storm tracks. In the past decade it seems that the tracks are closer to the equator overall. This influences what is going on with the storms, and unless this is considered in the context of a “fixed SST box” analysis, you may get a misleadingly strong relationship between intensity and SST that may arise in part from storms moving further to the south (whether the change in tracks is AGW, AMO or whatever has not been looked it, but it is probably a convolution of both).
Kerry Emanuel has written a reply to Michaels paper, i don’t know where this is at in terms of review, publication. But the essense of his concern was that this strategy tends to convolute several elements of potential intensity theory. I would like to argue that the general strategy that Michaels used could be used to assemble a broader dataset (in terms of more environmental variables of relevance to the thermodynamic potential intensity) to revisit the whole concept of potential intensity.
In terms of a practical matter, some assessment of the sensitivity of the analysis to which region/period you pick for the SST should be done. The atmospheric scientists have done this since they assume that it doesn’t matter too much. This may be an unwarranted assumption, but I suspect that it isn’t too bad of one. But it should be checked.
and i definitely agree with #470, this has been a great discussion. If there is a comment that you find insulting or boring, just skip it and focus on the interesting comments.
RE 411: Joel writes:
I think John A is correct at least in that the tops of tall, convective clouds are a common atmospheric effect for radiating excess “heat” to space. The tops of those clouds are high & cold because they are (or were) warmer than the surrounding air & became buoyant. I would assume at those cold high altitude/low pressure conditions that radiation from the clouds’ water vapor & ice crystals to space would be the major mode of heat transfer (air itself radiates little).
But feel free to correct me.
While I normally get interested in these subjects by reading what the “experts” and informed laypersons have to say about it, there is certainly a point that is reached when one has to make the effort to read most of the available literature — without guidance.
I would think from what I currently know that Michaels’ approach would be the basis for more detailed future work. On the other hand, maybe Emanuel has to think more outside the “box”.
Is anyone interested in starting a separate thread on water vapor and cloud feedbacks? While it is of some relevance to the hurricane/global warming topic, the relevance is indirect and this topic certainly has enough scientific meat for its own thread (provided people are sufficiently interested.
re: # 472
Are not some of these apparent disagreements more a matter of semantics? It has to be a given that clouds like any other earthly object radiates heat towards/into space and other directions also. To determine or theorize the affect on global warming, vis a vis radiation of heat by clouds, the amount of radiation with clouds versus without clouds would need to be measured or modeled.
We have some very informed and intelligent people who post here, but does not the question being debated here (and others like them that appear in this blog’s posts) require some major work with thoughtful published analyses and if so are not we better served in these discussions by quoting from and linking to these published papers.
Re #472: I am not arguing that clouds do not radiate energy into space and the detection of this is not the way IR satellite photographs work. However, John A was claiming specifically that the reason IR can be used to detect clouds at night is that water vapor is rising and condensing and releasing heat energy in so doing. My point is that it is the mere existence of the condensed water vapor (or ice crystals) in the form of clouds, which is radiating as all objects do, that allows us to detect the clouds.
In particular, I was worried that looking it in the way that John A does is in danger of getting things backwards…i.e., one might almost conclude that where water is condensing into water vapor, it will show up as the warmest spot in the IR photograph. In fact, as I noted, the higher up the clouds, the colder they are in the IR picture…and, in fact, it is where there are no clouds and you are seeing directly to the ground where things are the warmest in the IR photograph.
Re #474 Yes. I would have many more questions than comments, and be a sideliner, but I’d be very interested in reading the dialogue among people with good understanding and ideas.
Probably the best way to start one is to write a short argument (or whatever the proper term may be) and send it to Steve M as a proposed start to a thread.
The SST/Emanuel thing is worn out for me, so I’ll make several (final, unless someone has a question or spots a mistake I’ve made) comments.
** I believe Emanuel has shown that, when it is warmer than normal in the “box” (MDR), we tend to get more storms and more of the intense “Cape Verde” type (= increased PDI). I agree with that, and I think that most others like Gray and Landsea agree, too.
** Where I disagree is the tightness of the correlation between SST and intensity (PDI). I think it’s a messy subject, with much that is poorly understood. “The science is not settled.”
** I give up on trying to understand Emanuel’s SST choice of regions and smoothing techniques. My final note is that, if one excludes 6N to 9N from his “box”, then the early 1940s (1938-1943) are as warm as the early 2000s (1998-2003), meaning that SST is more of a hill-valley-hill (oscillation) shape than a hockey stick.
** On PDI, look at his revised graph, the one he sent to Willis. It begins at 1970, but you can correlate it with Figure 1 in Emanuel’s 2005 paper, and extend the “all-storm” PDI back to 1950.
** It looks to me like Emanuel has significantly revised downward the PDI for the early 2000s. It looks to me like his 1950 PDI is as high as his (revised) 2002 PDI.
Emanuel’s revised PDI plot begins to look like a hill-valley-hill (oscillation) shape rather than his 2005 hockey stick.
** Perhaps the early 2000s are not so unique?
** It is, of course, 2006, so we have data for 2004 and 2005. Yes, using that gives the final wiggle of a graph a Mt Everest uptick, but I’d like to see more data (like 2006 and 2007 and 2008) before assuming we’re climbing Mt Everest.
Best wishes to all! Whatever our differences, we’re all after the truth, whatever that may be and wherever it may take us.
David
Judith,
I know I would love to have a thread to discuss clouds and water vapor. Of course I’m no expert, I just think it’s the area needing the most study and discussion in order to be rightly understood. Indeed just a thread where people can link to papers or on-line discussions of the scientific aspects would be important.
For that matter I suppose I should go look at the IPCC TAR to see what they have to say. Unfortunately, being primarily a high-level summary, it generally doesn’t have the detailed information that’s needed and I’m not at a university or anything where I can get to papers which are on-line unless I want to spend a lot more than I want to.
re #478
David, I for one, especially appreciate your reviews and summaries of Emanuel’s and Michael’s papers. I also second your vote for a thread on moisture/cloud effects on climate.
Dave, steve has started a new thread on this, see the DOE Atmospheric Radiation Measurement Program http://www.arm.gov for tons of information on this topic, including papers from their annual science team meeting.
Yeah, I know Judith. Can’t even run off to church for a couple of hours on Sunday morning before there are new threads started!
re: #473
I found the Emanuel paper (2005) and particularly his Q&A on his blog most informative. I learned that the cyclic nature of the time series plots of PDI and SST is evident in the Pacific data and that a reasonable correlation holds both Atlantic and Pacific results of PDI versus SST after the 1-2-1 filter is twice applied to both series.
Some of the comments that I found more interesting are listed below:
Emanuel goes on to explain why he judges those corrections as being applicable to the data.
And this from Emanuel 2005 on the filtering before graphing and calculating R^2:
The SST and PDI series were both treated this way with the filter taking ½ of the value of year under calculation and adding to ¼ of the previous year’s value and ¼ of the next year’s value and then repeating this whole process again evidently using these adjusted values. My question would be: for what purpose was this done. While SSTs can be correlated from year to year, the relationship of PDI and SST should not be serially correlated. It also deprives us of seeing a scatter plot of PDI versus SST on an annual basis and looking at that R^2. What would happen if the data where broken down into smaller time units than years/seasons? Emanuel does not give any good reasons –that I was able to find- why he would want to test his theory of PDI and SST and present the results in such a coarse manner as he did.
I did not see any references in either of these Emanuel sources to those variables that Steve B reiterated in his post as being potential important.
His site seems to have moved:
http://wind.mit.edu/~emanuel/home.html
I can’t find the paper of discussion but there seems to be a lot of good papers and other information there. A truly good resource for learning about hurricanes.
Is this the paper under discussion:
ftp://texmex.mit.edu/pub/emanuel/PAPERS/NATURE03906.pdf
With the supplemental material here:
ftp://texmex.mit.edu/pub/emanuel/PAPERS/NATURE03906_suppl.pdf
I suspect strongly that absent the double 1-2-1 filtering that there would not be any significant relationship, although I don’t know that.
I say this because there is no a priori reason to think that next year’s water temperatures would be related to last year’s hurricanes. Thus, I suspect that it is the smoothing that introduces a spurious relationship between the data.
Finally, my analysis has shown that the hurricanes that are not in Emanuel’s genesis area have a greater correlation with the SST than the ones that are in the genesis area, which makes no sense at all.
Thus, I suspect that his correlation is not real.
w.
re: #484 and #485
John C., his site did not move, as my bookmark still works, so I must admit that I did something wrong in my linking. The links you listed in comment #485 are those to which I have referred. Sorry, for my sloppy work and not checking my links and thanks for listing the correct ones.
Re #485: Maybe I haven’t been specific enough.
A 1×1 grid is about 70×70 miles. What is the relationship between that area and the area of sea surface that a given storm would gain energy from? Note that this latter is highly variable.
As far as I can tell the 1×1 grids used weren’t centered on the path of the storms, but rather were simply the 1×1 areas the centerlines of the paths happened to touch. How much would this differ with a 1×1 grid that was centered on the storm path?
Michaels et al did nothing to account for the speed of the storms. All else being equal, this will affect the amount of energy a storm can gain.
SST in a given 1×1 grid is somewhat variable from week to week. As far as I can tell Michaels et al failed to account for this.
As I described above most of this could have been taken into account by using finer-grained SST data combined with a better description of the tracks (accounting for storm size and speed). As well, it might be worth comparing SSTs following the storms with those before, and looking at temps at depth (perhaps using the 26C thermocline as a proxy).
Put another way, a very useful paper could be done in comparing the use of various metrics. All that Michaels et al accomplished was to demonstrate that the particular one they selected probably isn’t very good.
Re 488, Steve B., a most interesting post. However, you say “As I described above most of this could have been taken into account by using finer-grained SST data combined with a better description of the tracks (accounting for storm size and speed).”
Is there SST data available that is finer grained than 1°x1°?
w.
It may well be necessary to work directly with the satellite data, which would be vastly more work than what they did. OTOH, they could have done this for a few storms (combined with a more detailed track analysis along the lines I described) and gotten some useful results.
re: #488
The biggest problem with your complaints, Steve B, is that you’d never think of demanding your own favorite scientists be held to the same degree of accuracy. Emanuel’s SSTs are hundreds or thousands of miles from where the storms he’s working with end up. That surely can’t be better than someplace at least touching the storm. Likewise he averages SSTs over months. That surely can’t be as accurate as a few days earlier than when the storm actually entered the area.
As for the speed of the storm, I’m still not sure what you’re trying to say. A faster storm would presumably pass over warmer water, on average, since it hadn’t been “depleted” of heat to evaporate water, but even if that’s what you’re getting at, I don’t expect it’s a huge difference, nor do I know that Emanuel has included storm motion in his calculations either. In any case, any higher or lower SSTs would presumably be reflected in the top wind speeds. That is, if there’s a higher time over a given area, the wind speeds would decline and this would produce a spread in the measures which should be observable.
re: #488
That is why my intent was to keep this particular discussion, in a thread containing many discussions, focused on comparing the work Emanuel with that of Michaels. Steve B’s suggestions were a sidelight, not known to have available data from which to extract the information he suggest be analyzed and certainly much more a critique of Emanuel’s work than that of Michael’s. I could, I guess in the smart alecky tone of some others posting here, suggest that Steve B communicate his suggestions to both Emanuel and Michaels.
Judith Curry has a good, interesting paper on tropical cyclones, which I’ll link below. I wish I had read this earlier – much more data than Emanuel’s work.
I’ll try to hit the highlights – Judith, correct me where I misstate:
* the period examined is the satellite era, where good data exists, basically 1975 to the present. (yea!)
* all cyclone-producing basins worldwide are examined. (Yea!)
* Finding: the total number of named cyclones (tropical storms + hurricanes + typhoons) is remarkably constant over the last 35 years. The total rocks along at about 90 a year worldwide, more or less.
* Finding: the number of cyclone-days (every day that a particular storm exists is a “storm-day”) has actually trended downwards a bit. The number of hurricane/typhoon-days has actually dropped about 25% over the last 10 years.
* Finding: there is no upward trend in maximum storm windspeed over the last 35 years.
* Finding: the percent of intense (categories 4,5 hurricane) cyclones has significantly increased worldwide
* Finding: the percent of weaker (categories 2,3 hurricane) cyclones has remained about the same
* Finding: the percent of weak (category 1 hurricane) cyclones has decreased over the last 35 years.
* Thought: the rise in intense storms is related to rising SST
These are interesting findings. The trend down in storm-days is a particular surprise to me. The only thing I’d like to see in addition would be data on “storm-days” for the storm categories and see how that has trended, in addition to the displayed trend on number of storms.
I’m going to dig into some other data, mainly on the west Pacific, and try to relate the findings to what I understand of tropical cyclones.
(I can’t get the auto-link to work – drat. Here’s the address.)
http://www.sciencemag.org/cgi/content/full/309/5742/1844
David, good summary of the webster et al. paper.. To bring you up to date, the main controversy surrounding this paper is the quality of the hurricane intensity data outside the North Atlantic. The satellite data back to 1983 are being reprocessed, i have no idea what this will show (and i’m sure the hurricane types will have intense arguments about how to do this). In my opinion the Webster et al. paper is more straightforward than emanuel’s and a more powerful way to look for footprint of global warming (assuming we can believe the global hurricane intensity data, which is being questioned right now).
David, that is the paper that is referred to as “WHCC”. I find their use of statistics inconsistent.
For the SST, they assert that there is a trend in SST using the Kendall trend test which is significant at the 99% level. Which is fine, that is a good test to use, and I am able to replicate the result.
But then they say:
Unfortunately, they don’t give the test they have used for either trend (hurricane number or duration). Even more unfortunately, using the Kendall trend test as they used above, the z-score for the number of hurricanes in the North Atlantic is only 1.67, significant only at the 91% confidence level, which is generally considered to mean that there is no significant trend.
The z-score for the number of hurricane days is larger, 2.34, but this is still not significant at the 99% confidence level as claimed.
Finally, the paper says:
However (a) the increase overall in North Atlatic hurricane numbers is not statistically significant, and (b) the trend in North Atlantic hurricane numbers since 1995 is even less significant (trend 1995-2004, Kendall z-score 0.89, significant at 63% …)
Judith, could you comment on this? Many thanks,
w.
Re #461:
“Or”? How about I do both?
Sampling Error: That part of the difference between a population value and an estimate thereof, derived from a random sample, which is due to the fact that only a sample of values is observed; as distinct from errors due to imperfect selection, bias in response or estimation, errors of observation and recording, etc. The totality of sampling errors in all possible samples* of the same size generates the sampling distribution of the statistic which is being used to estimate the parent value. [p. 255]
Ergodicity: Generally, this word denotes a property of certain systems which develop through time according to probabilistic laws. Under certain circumstances a system will tend in probability to a limiting form which is independent of the initial position from which it started. This is the ergodic property.
A stationary stochastic process {xsubt} may be regarded as the set of all realisations possible* under the process. Each such realisation may have a mean msubr. If the process itself has a mean E(xsubt)=µ the ergodic thereom of Birkhoff and Khintchine states that msubr exists for almost all realisations. If, in addition, msubr=µ for almost all realisations the process is said to be ergodic. In this sense ergodciity may be regarded as the law of large numbers applied to stationary processes. [p.96]
From: Kendall & Buckland. 1957. A Dictionary of Statistical Terms. Oliver & Boyd, London.
*See the bolded linkie between the two definitions?
Re #496: “as distinct from errors due to imperfect selection, bias in response or estimation, errors of observation and recording, etc.”
Indeed.
Re #497
No spitballs, no tweaking, in #496, as requested by your bullying protector, TCO. So tell us, please: what is your point? And let’s try to avoid another tarbaby incident. Be logical, and we’ll all be ok.
Re #498: To have a sampling error at all it appears you have to know what the total population is (population value). If the sample is the entire population, there is only one possible sample (and thus, I suppose, a nominal error of 0). The other classes of error mentioned seem to cover the hurricane situation nicely.
(repost from yesterday since I just got page errors when I attempted to post this then)
Re #491: Dave, most of the work Emanuel did involved the PDI calculations. He then did what amounted a quick and dirty look at whether there was an SST correlation. He established that there was, but took it no further.
You said: “Likewise he averages SSTs over months. That surely can’t be as accurate as a few days earlier than when the storm actually entered the area.” Basin-wide or MDR (or some variant) SST could well be a better metric than what Michaels et al used. I’m speculating, but I suspect that basin-scale metrics would more accurately track temperature at depth than what Michaels et al used, and temperature at depth appears to be more important than SST as such.
On the speed issue, all else being equal a slow-moving storm passing over warm SSTs will have more opportunity to gain energy than a fast moving one, but this is complicated by the depletion you mention. The water heat at depth is a huge factor, as witness what happens when Gulf hurricanes stall over a loop eddy and “blow up” (i.e., the churning effect that would normally be cooling simply makes more warm water available to the hurricane). I don’t think it’s valid to assume that storm wind speed would be an accurate reflection of SST, although it makes sense that there some degree of correlation.
PDI doesn’t account for speed as such, but that’s only relevant if a comparison is being done to some other metric along the storm path (e.g. SST).
Appearances are sometimes deceiving. That you cannot measure it based on a single realisation does not mean it does not exist. In the case of stochastic dynamic processes the issue of sampling error lurks in the background, causing problems only when people try to make untenable conclusions about trends in a series, or differences between two series. If those series are very long and stationary, the ergodic principle allows for the desired comparsion. If not, then watch out: the sample series moments (mean, variance) will not have converged to the ensemble’s moments, ergodicity will not hold, and all bets are off.
The other classes of error are relevant, yes, but are not the issue when it comes to inferences about trends.
re: #500
You’d stated this several times, but it makes no sense to me. True the water will turn over, but it does that anyway on its own, so what exactly do you claim a slow moving storm does that a fast moving one can’t? AFAIK, The storm isn’t using up its energy to move faster or slower, it’s basically being pushed along by prevailing winds. Thus the warmer the surface, the more energy it picks up per unit time. I’m sure there are more complications I’m not aware of, but from a pure thermodynamic position the speed with respect to ocean surface doesn’t mean much of anything.
Steve, in the case that we are discussing THE SAMPLE IS NOT THE ENTIRE POPULATION.
In fact it is only the tiniest morsel imaginable. In the case of an annual hurricane count you have only one sample from the entire population (infinite) of possibilities, which is formally defined as an ensemble. You and TCO need to get yourselves to an introductory course on time-series analysis. Fast. And an introductory stats course too. Because you seem not to understand that “population” has a formal definition, and in the case of a trend forecast, the intended scope of inference is not the observed time-series, but the whole realm of future observations that could be realized. This is why the ergodic principle is crucial: because your population, which is defined by your scope of inference, is the whole ensemble of hurricane counts, not just one, single stochastic realisation.
Get thee to a Wegman. [Tweak.]
Re 499, Steve Bloom, you say:
I think I see the problem. You think that for a given year, the number of hurricanes is the total population. But if that is the case, what is the total number of hurricanes for half a year? Half the population? And how about for ten years, would that be ten times the population? For that matter, why should one year define the population? You see the problem?
Think of it like flipping coins. One year we get ten heads, and one year we get three. But in neither case is that the total population. Instead, the population is all possible coin tosses. We take a sample of the total population each year, and from that sample we try to estimate the statistics of the underlying population.
You are correct that if we could sample the entire population, the sampling error would be zero. In some cases this is possible “¢’¬? if we want to know how many Army recruits have a high school education, we could sample say a tenth of them, and get an estimate of the number along with a sampling error … or we could sample all the recruits, which is the entire population, and get an accurate number, with no sampling error.
With stochastic processes like flipping coins or hurricane generation, on the other hand, we can never sample the entire population. Thus, our conclusions about hurricanes must always deal with sampling error.
This error is basically proportional to $latex \frac{1}{\sqrt{N}}[\tex], where “N” is the number of data points. Increasing N reduces the error. Which is why forming the data into pentads increases the sample error, because it reduces N by a factor of five.
HTH,
w.
Well, my first attempt at LaTex failed … let me try again …
This error is basically proportional to , where “N” is the number of data points. Increasing N reduces the error. Which is why forming the data into pentads increases the sample error, because it reduces N by a factor of five.
w.
Re #503: bender, the problem is that the first definition you provided doesn’t support that interpretation. But if as you say the definition of population is also needed for this discussion, please provide that. Note that the definition distinguishes between “population value” and “estimated population value.” You seem to be describing the former as a theoretical value that can’t exist in the real world.
Also, this is the first time I’ve heard you use the term “trend forecast” (as opposed to just “trend”) in this discussion. Those sound like somewhat different things to me, so perhaps you could amplify. Both Emanuel and Webster et al identified past trends, but did they try to forecast a trend? Not in any formal sense. Had they done so, everything you’re talking about would make a lot more sense.
bender:
1. Your quoted definition does not restrict (or even mention) the issue of year to year variation and imaginary perturbation experiments. I understand the linkage that you are trying to make. But when you want to make it, you need to make it. Just using the term “sample error” on it’s own is insufficient. (As shown by that you needed to cite two definitions.)
2. There’s no need for me to take a course on time series (for this discussion, for others surely). I understand the concept that you are driving fine. Do you really think I don’t? We are having a semantic argument.
3. Please reply to my comments on your cited pamphlet (that sample error in that paper applies to misestimation of the population at a given time, not year to year variation of some chaotic system).
We are going to go round and round on points 1 and 2 (it’s in the nature of a semantic argument), so please do me the courtesy to make sure to answer point 3. Please don’t think of “winning the debate” but of finding what common ground exists. If I have the wrong finding from that pamphlet, I want you to correct it. If my statements about that pamphlet are correct, I want you to see that.
You were going well up until this point. I’m not sure what summing by pentads does to the sample variance. But I can check. What it does do (and this is only true in this case, and is not generally true) is smooth over the interannual fluctuations and accentuate the trend. This is because the fifth-order autocorrelation happens to be high in the series. [Why?] Summing by pentads thus increases the inter-observation first-order autocorrelation – which is what a trend is.
The point about the size of N is a good one. The longer the N, the lower the sample variance. But far more importantly, from the trend analysis perspective: the higher the N the more likely the series sample mean and sample variance have converged on the ensemble mean and variance, thus making inferencing possible.
This is true only for stationary series however. Non-stationary series are another kettle of fish. Under 1/f noise models or even simple random walk models (Brownian motion) var{xsubt} will increase as N increases. Here ergodicity can not help you because convergence will never happen.
The mistake Bloom keeps making is thinking that a calculation that is mathematically undefined (e.g. estimate of sampling error based on a single sample) implies that the quantity being calculated is linguistically meaningless. The sampling error is unquestionably well-defined and non-zero. You just can’t estimate it from a single sample. You can estimate the sample variance and hope that that is equal to the ensemble variance, but I wouldn’t count on that in the case of Earth’s climate system. You could compare the sample variance from one part of a series to the sample variance from another part of the series, and test whether they are equal. But that does not imply future samples to be realized from the process will yield the same result. Only if the generating process is stationary will that happen. And again, I wouldn’t hold my breath on that one.
Please respond to the pamphlet issue (#3). (You cited it in the first place.)
Re #508
Sorry TCO, I haven’t been following things in as close detail as before. I wasn’t avoiding your question. Just busy with other things. You’re quite right that that report refers to sample error in a more traditional context from what I meant. Citing it was a stop-gap measure to show you I was not dismissing your question, but merely stalling until I could get to a proper library with real books. Which I told you would take a little bit of time to do.
In my view the problem has been solved, and we are not going around in circles. If you think we are going around in circles, then close the thread. You were the one who kept things running by insisting on an authoritative defintion. By the same token, it’s up to you to tell me when you’re satisfied.
Re #502: “True the water will turn over, but it does that anyway on its own, so what exactly do you claim a slow moving storm does that a fast moving one can’t?”
Hurricanes have a huge effect on the water beneath them. A lot more time in one place equals a lot more churning than would otherwise occur. For example, a hurricane moving at a moderate speed over warm surface water will gain energy, but if it slows too much will churn up water from greater depths. If that water is cooler, then the hurricane will lose energy (relatively speaking). For the reverse of this effect, see here.
Re #510
Please try to be more patient. I was in the process of answering when we just cross-posted.
TCO, your linkies to pages upon pages of out-of-context definitions are as useless as Dano’s. I prefer to read people’s posts rather than wade through web junk. Do me a favor and go read a few real texts, and let me know what you find. I think I’ve done quite enough for you.
If you don’t like the phrase “sampling error”, invent a better one.
Warmers should have no difficulty “reading my mind”. As they are the ones making exagerrated claims about “unprecedented trends”, I naturally assume they are well-versed in the methods of trend analysis in the area of stochastic dynamic systems.
They’re not?! They find the notion of ensembles “bizarre”?! What a surprise. The circle is complete: my deep apologies for their ignorance and arrogance. Please close the thread.
If you accept that:
(1) “sampling error” is the difference between a sample mean and the true population mean,
(2) the sample mean of the hurricane series is very close to the population (i.e. ensemble) mean,
Then “sampling error” is well-defined for any interval over the length of the hurricane time-series. You pick an interval, and I’ll tell you what the sampling error is for the observations over that interval.
Nothing fancy here, folks. Ergodicity only comes into play regarding the validity of the assumption in (2).
Satisfied, TCO? Or is Kendall not a high enough authority for you?
Thanks man. I think this is about played out.
Re: Webster et al
There are several observations/trends from the paper which I’ve tried to convert into a physical model. (The paper is a worldwide look, covering 1970-2004.)
(I have not looked at any statistical aspect of the paper.)
The paper’s observations are:
1. No change in the worldwide frequency of tropical cyclones
2. A decrease in typical storm life (falls from about 10 days to about 7.5 days)
3. A shift of hurricanes from less-intense to more-intense
4. No increase in windspeed of the most-intense hurricanes
This is a tough one.
On observation #1, I believe that the worldwide frequency of “seedlings” (easterly waves) stays about the same, so there is no increase in “seeds” for storms even with warmer SST. But, since there is more ocean above 26C, then it seems like more seedlings have a chance of developing into cyclones. Perhaps the worldwide increase in >26C ocean is small, so the storm increase is small. I would expect higher SST to slightly increase storm frequency, and maybe that is happening, but is just not apparent in the short period covered by the data.
On observation #2, I tried to rationalize it away thinking that there were relatively fewer storms in the long-life basins (WPAC, EPAC, SO) while storms in the short-life basins (NATL and IO) increased, and perhaps that explains the downward trend in overall life. But, it looks like storm life decreased in the long-life basins, too, so it’s hard to discount this observation. I cannot conceive of a way that higher SST would decrease average storm life.
On observation #3, I understand the thinking about “higher octane fuel” creating more intense storms, but expect the increase to be modest, based on Emanuel’s model.
On observation #4, I would expect to see an upward shift in the windspeed of the most intense storms, but that is not apparent in the data. Perhaps any windspeed increase is modest and not detectable in the data. That would be consistent with Emanuel’s model, I believe.
Bottom line for me is that it’s hard to see how conventional explanations of the impact of SST on tropical cyclones explain the data. (I can rationalize portions of the data away, and I know the storm intensity data is under review, but I take the paper at face value for this exercise.)
Here is a wild idea, outside regular thinking. Perhaps higher SST affects the height and strength of the tropopause, allowing hurricanes to form stronger anticyclones. One characteristic that all intense tropical cyclones share is an excellent outflow mechanism. Perhaps global warming improves the upper atmosphere in a way that, once a hurricane eye feature forms, it has an easier time establishing a stong upper anticyclone.
Even this wild idea does not explain observation #2. That one stumps me.
Anyway, the science is young and the jury is out. Anyone who declares that the “science is settled” is wrong. Webster et al is very careful in what they say and are not in the “science is settled” camp, as i read it.
Speaking for myself, living 15 miles from the Gulf of Mexico, I’ve seen nothing in the data that gives me any more willies or heebie-jeebies than I had 5 years ago. I think we’re in a cyclical upswing in the Atlantic basin, and may stay relatively high even when we are in the valley of the cycle, but I do not see the end of the world coming.
re: #493
From my reading and your summaries of these papers, David, I would say there is significantly more agreement between Webster et al and Michaels than between Webster and Emanuel.
Re #516
Great. Hopefully this wasn’t a big fat waste of time.
Re #506 (Missed first time around.)
Thanks for the invitation to clarify. Yes, this is the first time I used that word. My use of it changes nothing definitional however. I just thought it would help clarify in your mind why it is the ensemble (i.e. the underlying hurricane-generating process), and not the sample, that is the central issue here. Describing the statistical behavior of the series is not what we’re after. What we’re after is interpretation. Is this “trend” strong (i.e. non-spurious), and is it meaningful (i.e. interpretible in terms of the hurricane-generating process as we understand it)?
I want to apologize if my initial language was misleading. But I must point out that the uninformed are easily misled. Your knowledge on storm processes is clearly superior to mine, no question. But you need to learn more about the statistics of thermodynamic processes if you want your arguments to carry weight.
This is the very same mistake, by the way, that proponents of “unprecedented trends in warming” are making every day. The A in AGW may be non-zero, but this “unprecedented” claim, pre-LIA, is statistically untenable.
Steve B,
To be perfectly clear that this is not a semantic dodge:
“In the case of a trend analysis, the intended scope of inference is not the observed time-series, but the whole realm of observations that could have been realized over that time interval by the hurricane-generating process had the putative driver (eg. SSTs) exhibited the same trend-like pattern of variation.”
i.e. If the trend is real and externally driven, one would expect it to appear in run after run. And if that driver is real, and should continue to trend up, then so should hurricane frequency continue to trend up. [Note how time and probability space are interchangeable if the relationship is valid.]
Better?
re: #513
The surface waters are well mixed down to the level of the bottom of the mixing layer. And this isn’t over a period of weeks but of hours. So a hurricane doesn’t need to be over an area very long to suck a lot of heat out of it.
BTW, your link doesn’t seem to work for me. I get some sort of search on the topic of ftp rather than getting to the ftp site. How about just cutting and pasting whatever point you wanted to make?
In any case, under the mixing layer temperatures in the tropics will be much lower than above. The opposite might be the case in the winter in polar areas (which, BTW, have much thicker mixing layers). I might mention this is the one area I learned useful information from the time I spent on RealClimate. That was from a paper that was linked, BTW.
Re 509, bender, you are right about the effects of summing by pentads on trendless data, it makes no difference. But if there is a trend, it affects the standard error of the mean. Here’s the Curry data to show what I mean.
Year__Count__Avg. By Pentads
1970_____7
1971_____8
1972_____5
1973_____6
1974_____6_____6.4
1975_____8
1976_____8
1977_____7
1978_____7
1979_____7_____7.4
1980_____11
1981_____9
1982_____4
1983_____5
1984_____7_____7.2
1985_____9
1986_____6
1987_____5
1988_____7
1989_____9_____7.2
1990_____10
1991_____6
1992_____6
1993_____6
1994_____5_____6.6
1995_____13
1996_____10
1997_____5
1998_____12
1999_____10_____10
2000_____10
2001_____11
2002_____6
2003_____9
2004_____10_____9.2
Average__7.71_____7.71
Std. Dev.__2.27____1.36
N__________35_____7
S.E.M_____0.38_____0.51
This increase in the SEM is not dependent on the high lag(5) autocorrelation that we find in the Curry data, it exists in all trended data. And of course, your point about the mean increasing in a trended series is most important.
w.
Re 521, Dave, you say:
The other effect that you are not mentioning here is that the hurricane is pouring down tonnes and tonnes of cold rain … in the case of ocean thunderstorms, they can only get large if there is upper atmosphere wind shear, because in that case the rain is falling in a different place than the base of the cloud where the heat is driving the heat engine. Otherwise, if the thunderstorm goes straight up, the rain just puts out the fire and the thunderstorm stops.
In a hurricane, though, the cold rain is falling on the heat source that’s driving the hurricane, so the hurricane has to move to maintain strength. It’s the oceanic version of Murphy’s Law …
w.
“in the case of ocean thunderstorms, they can only get large if there is upper atmosphere wind shear, because in that case the rain is falling in a different place than the base of the cloud where the heat is driving the heat engine. Otherwise, if the thunderstorm goes straight up, the rain just puts out the fire and the thunderstorm stops.”
Is the wind pushing the rain to somewhere other than the base, or is the base moving towards more heat, thus is the driving force to direction and speed?
I say this because while Hammerheads are indicitave of some storms, I don’t think that is the case of Hurricanes.
Re 524, what happens is that the cloud grows from the base to the top on a slant rather than straight up, so that the rain doesn’t fall on the base of the cloud.
w.
Does this hold true after they start to rotate?
Just to clarify, “sampling error” and “standard error of the mean” are not the same thing, although both decrease with increasing N.
Standard error of the mean is always calculable because it is purely a sample statistic. Sampling error, in contrast, is just a concept unless you have some knowledge of the true mean. That doesn’t mean it isn’t there influencing your ability to make correct inferences (through time, among samples), however.
In this case the series is non-stationary: the sample means (over whatever interval) are increasing [weakly]. The point is that in the pentad series the observations are heavily autocorrelated. In the raw series they are not. It is this artifically introduced autocorrelation that biases the regression parameters. And what is the source of the autocorrelation in the pentad series? The 5th-order autocorrelation in the raw data. Take that away and the regression parameters on the pentad series would be unbiased, albeit more error prone. The r^2 would drop, as would the slope estimate.
Although you are correct that the increase in SEM is independent of the lag(5) autocorrelation, it is the bias in the regression parameters in the opening graphic that is the issue. And that is a direct result of cherry-picking a window (5-y “pentad”) that “happens” to cause the lag-5 autocorrelation to bubble up to the surface in the pentad series. Coincidence? Point is: change either the window size, or the time-series autocorrelation function, and those favorable trend statistics will drop off the table – just as shown in the graphic.
Re #527
That was posted in response to #522, and the graphic referred to is not the one starting this thread, but the original one in “bender on hurricane counts”.
#527 — smoothing-induced autocorrelation. Gad, I never thought of that, but it makes perfect sense in retrospect. I swear, hanging out here with you guys is making me a better scientist. 🙂
Re #529
Yes, this can happen, and is a mjajor problem. But remember: there is no smoothing in this particular windowing operation. The smoothing is done tacitly by amplifying a signal that the authors did nto know was there.
#529 Pat, this is exactly why I did not let this issue die, and also why I disagree with TCO that we’re “running in circles” or that “this is all played out”. We’re moving forward, slowly but surely. Problem is there are lots of climate scientists (and investors) out there making the same incorrect inferences over and over again – and surprise, surprise, it’s the warmers that are making these errors most frequently, not the battle-worn skeptics. Time-series is a tricky subject at the best of times, and the climate system is the trickiest arena of all. Hence Wegman’s criticisms about the lack of integration betwen climatology and statistics. He’s right.
Re #521: Here is the correct link. Temps below the mixing layer are critical.
re: #532
Ok, thanks for the paper. You’re right that if there’s an eddy that produces a thick mixed layer, and a storm parks over it for a bit, the storm will do better than just chugging along. But that’s the exception, not the rule. So now we just have another parameter to take into consideration: Eddy index. Someone have a link to a map of eddies in the Atlantic? [I hope it wasn’t in your paper as I admit I just read the abstract.]
Bender, could you comment on the 1-2-1 twice applied filter that Emanuel (2005) uses in his data presentation (for both the PDI and SST time series)and the effects that it would have on his R^2 calculations that evidently were not adjusted for any smoothing induced autocorrelation?
I also question why Emanuel presented his data only in the filtered form (at least that is all that I have found) and did not include an unfiltered version.
Just to be clear, I understand and agree with bender’s interest in the variability of hurricanes and the issues with trend analysis of a series that has high inherent variability. I have not conceded the semantic argument, just am sick of beating on him, since my point is semantic and he keeps wanting to say that I don’t understand the concept in and of itself. In addition, I appreciated his graceful comment on the pamphlet. I really don’t see movement forward on the semantic issue, which is why I say we are driving in circles. I think we are both repeating points (see below).
I still disagree with his casual use of the term “sampling error” as only meaning the “non-traditional sense”. And his upbraiding of someone for not knowing what the term meant when he himself had not restricted the usage. As his pamphlet shows it is perfectly reasonable to use the term in the “traditional sense” within a discussion of time series. And given the discussion of observed hurricanes versus actual ones, this traditional usage could apply in our thread.
I also find it interesting that his one supplied example of the use of the term “sample error” in a time series context, used it in the vanilla sense (have not yet seen one that used it in the non vanilla sense). And that his supplied definition was not a single definition, but that he had to link to two different definitions. (To me, this shows that the term “sample error” when used in the context of a “what might have happened ensemble of universes” needs to have that explanation appended, to make it clear that this is the intended usage, not the “traditional”.
RE #518
Yes, Michael’s suggestion of a 28.25C threshold for intense storms could actually be used to explain some of Webster’s observations.
On Webster, I just can’t convert their combined observations into a physical explanation based on warmer SSTs. I have to either discount some of the data or come up with rather unlikely models to make sense of things.
One thing from the Webster data: a chart shows Atlantic SST over a broader region than Emanuel’s box. If that broader SST data went back to 1950, it’s be fun to combine Webster’s SST with Emanuel’s revised PDI, and see if that graph is as striking as Emanuel’s original Figure 1. I bet not.
Re #535
I didn’t think clarity was required, but I’m glad you understand the concept (at least you say you do) because that’s what’s important. Your point on definitions is well-taken – it was necessary for me to provide to separate defintions (it was from a dictionary, for pete’s sake) and to link them myself. I will find a better source that links the two explicitly in a single discussion. [Anyone with a copy of M. Kendall and A. Stuart. Kendall’s Advanced Theory of Statistics, Volume 3 could look it up for me, because that is the text that would do it.] Meanwhile you’ll just have to wait until I can get to the university library.
Casual use? No, I clearly indicated very early on in the discussion that my use of the term “sampling error” was a special use. That’s precisely why I bothered to introduce the term ‘ergodicity’ – to show that something special happens epistemologically when you start trying to make inferences about stochastic dynamic processes.
Note, sir, that just because you can’t find something online doesn’t mean it doesn’t exist.
Note, sir, that it is incumbent on those making provocative claims about unprecedented trends to be up on their statistics. Where is their definition of “sampling error”? Their answer: “it doesn’t exist”. THEY are the ones to be rebuked for this unnacceptably ignorant response, not me.
Re #534
Yes. First, can you provide the full citation, link, or pdf (or point me to the appropriate post, if this has laready been provided here)? Context usually matters …
#537
In these new publications there is no Volume 3 (http://www.kendallslibrary.com/pub.htm). But other books in Kendall’s Library of Statistics cover the old Volume 3 topics.
Re #539
Thanks for the link, UC. There was a Vol 3 to the 2nd Ed. 1968 series. Since that time there has been a lot of editing of these volumes. And now it appears they are adding new volumes under the Kendall “brand” on topics the original Kendall (the guy, not the brand) did not cover. I can’t tell you which of the new volumes contains the old Vol 3 material. Like I said, I need to get to a full library to answer this question.
re: 538
Bender, I assumed you were following the other part of this thread while attempting to inform TCO so now I must apologize for not giving the background. That material is found in the Willis E comment #297 (the latest graph of PDI and SST time series after applying the filter) and the links to Emanuel’s papers are given in the John C links posted in comment #485 — all from this thread. If you chose to accept this assignment…
Kendall’s Vol. 8 might be the ticket.
Re #541
I was following, yes, but not closely. (There’s a lot of ground to cover at this blog.) Steve Bloom knows more than I do about stormology, so it’s not like I have a lot to contribute on the topic. But I’ll read the paper. No promises. This highly specialized stuff is pretty far afield for me.
Re #541
Ok, I scanned through (but did not scrutinize) the Emanuel (2005) paper. The smoothing problem introduced by Emanuel’s Eq. 3 is significant. We should get his data and do some sensitivity analysis to quantify just how bad it is. Meanwhile …
In animal population ecology this smoothing problem is termed the ‘Slutzky effect’, after Slutzky (1937) “The summation of random causes as the source of cyclic processes” Econometrica 4: 105-46. You see, the smoothing of weather data was a common practice in the time of Yule, who happened to debunk the related sunspot theory of snowshoe hare cycling in Yule, G. U. 1926 “Why do we sometimes get nonsense-correlation between time-series” J. Royal Stat. Society 89: 1-64.
You can see the relationship to the present problem, where Emanuel is enhancing low-frequency noise to form a signal, and then comparing the two “signals”. Nobody could ever slip one past Yule. He would not have been impressed with Emanuel’s method.
Unrelated. Why does Emanuel talk about r^2 and “correlation” in the same breath [p. 687]? Nature’s severe page limits? At any rate, this explains the source of my complaint in #393: it’s Emanuel himself.
Emanuel (2005) Fig 1 caption states “total Atlantic Hurricane PDI has more than doubled in the past 30 yr.” However,
(1) he does not include confidence estimates on his starting and ending values;
(2) he has cherry picked the 30-year time frame;
(3) his smoothing method biases the analysis strongly in favor of his hypothesis.
I do not believe this conclusion is statistically robust. If I were to guess – and this is ony a guess – I would say the PDI has increased by ~50% +/- some large margin of error, depending what flavor of trend & noise model you choose. Looks like the start of another thread, if you want it.
Ditto for Fig. 2 for the W. Pacific. His 75% increase appears to be biased high. Again, a ~50% increase looks about right, and this would be consistent with what I just reported for Fig. 1. Large margin of error in both cases however, and this is directly because of his intentional efforts “to minimize the effect of interannual variability”. Fine for graphic representation. Not fine for policy-making.
Ditto for Fig. 3. ~50% increase.
This all harkens directly back to #42, which I’d forgotten about. Emanuel’s estimated increases appear to be 2-4 times too high, which is entirely consistent with Willis’s original complaint in #37. All this a product of cherry-picking and inappropriate data massaging.
Willis et al.: is there no Supplementary Info for the Emanuel (2005) paper? When I check Nature’s stash I get a “Page not found” error. Anyone have the raw data?
Re #44
This is exactly why we are concerned with ergodicity. The three independent realizations of what should be the same process give three very different regression responses. It is likely, Willis, that this lack of consistency is the result of three biased models that have been overfit to the three samples, and the overfit is exposed when you do the comparison between the three independent sample realizations.
That, Mr Bloom et al., is why we concern ourselves with the entire universe of possible realizations. Because it’s not about the sample; it’s about the process that generated the sample. Someone get me the raw data and I’ll do a proper job of it.
re: #549
The supplementary talks about adjusting the tropical storm wind velocities for pre-1973 data (they were considered too high).
ftp://texmex.mit.edu/pub/emanuel/PAPERS/NATURE03906_suppl.pdf
Also here is the link to Kerry Emanuel’s home page:
http://wind.mit.edu/~emanuel/home.html
I am linking the right and wrong way because my last attempts at the right way did not work.
No linkies, please. Data.
no dano-esk pejoratives please.
Sorry. It’s so annoying it’s actually catching.
ok then
re: #552
Hey Benderino, my dinky slinky linkies were only intended to help you get a better feel for what Emanuel is doing. I also thought that you were getting an error message to the supplementary paper. Willis E. was in contact by email with questions for Emanuel and received some answers from him when he realized that Willis was a serious reader of his publications. I would think that we should use the Willis’ status with Emanuel to make the request for raw data. I agree that the raw and at least annual/seasonal data are the key to answering our questions. As a matter of fact, Emanuel’s reply to that request will be informative in and of itself.
Ken, I got the “supplementary methods” no problem, but there was no data there. Just 1 graph. No raw data tables. No files. The “Page not found” error was from the “Supplementary Info” link on Nature’s website. If Willis could extract some raw data from him, I will analyse it and post the script.
Re 549, Bender, I don’t have the Supplementary Info, I’ve had the same experience trying to get it. However, I did find his original data.
Also, on a related note, a “1-2-1” filter applied twice is the same as a “1-4-6-4-1” filter applied once … makes one wonder why he applied it twice.
Here is the original data, as reported by Landsea in his Brief Communication Arising. I also include the SST for a slightly larger area than Emanuel (5°-20*N vs 6°-18°N).
Year , SST , PDI
1949 , 0.324 , 9.25
1950 , -0.265 , 26.2
1951 , 0.066 , 14.25
1952 , 0.234 , 8.9
1953 , 0.067 , 9.8
1954 , -0.272 , 11.5
1955 , 0.174 , 21.35
1956 , -0.271 , 5.3
1957 , 0.086 , 8.7
1958 , 0.181 , 12.5
1959 , -0.209 , 7.5
1960 , -0.066 , 10.2
1961 , -0.124 , 22.9
1962 , -0.013 , 3.2
1963 , 0.02 , 11.95
1964 , -0.341 , 18.05
1965 , -0.138 , 8.6
1966 , 0.088 , 14.9
1967 , -0.155 , 12.05
1968 , -0.112 , 3.65
1969 , 0.289 , 15.65
1970 , 0.004 , 3.75
1971 , -0.149 , 9.25
1972 , -0.359 , 2.9
1973 , -0.107 , 4.15
1974 , -0.386 , 7.5
1975 , -0.315 , 7.8
1976 , 0.056 , 8.6
1977 , -0.068 , 2.95
1978 , -0.246 , 6.6
1979 , 0.235 , 11.85
1980 , 0.292 , 19.3
1981 , 0.06 , 9.95
1982 , -0.151 , 3.35
1983 , 0.01 , 1.5
1984 , -0.23 , 7.45
1985 , -0.008 , 9.3
1986 , -0.068 , 3.5
1987 , 0.496 , 2.65
1988 , 0.233 , 13.1
1989 , 0.085 , 16.45
1990 , 0.52 , 8.5
1991 , -0.089 , 3.45
1992 , -0.078 , 8.85
1993 , 0.136 , 3.5
1994 , -0.135 , 2.65
1995 , 0.64 , 24.8
1996 , 0.334 , 19.55
1997 , 0.312 , 4.15
1998 , 0.621 , 21.75
1999 , 0.53 , 21.85
2000 , 0.12 , 12.2
2001 , 0.41 , 11.25
2002 , 0.141 , 6.35
2003 , 0.873 , 22.6
2004 , 0.803 , 30.2
And here is a graph of the data:
Now, here’s some perplexities about the data.
1) I was unable to reproduce Emanuel’s Figure 1 without applying the “1-2-1” filter not twice, but four times …
2) The SST data has a significant trend (Kendall z = 3.25, autocorrelation adjusted standard z = 3.3), and the PDI does not (Kendall z = 0.22, autocorrelation adjusted standard z = 0.41)
3) The R2 of the SST vs PDI, while significant at p less than 0.01, is only 0.24, … hardly a ringing endorsement.
4) Post 1970 I get very good agreement with the SST of Emanuel, but prior to 1970, his SST numbers are increasingly high. This may be related to the fact that his PDI numbers have not been increased prior to 1970 as he described in the paper and as Landsea detailed in his paper. It appears that he may have applied the pre-1970 corrections to the SST figures rather than to the PDI figures as he should have … dunno.
I guess the most important finding out of all of this, other than that Emanuel’s numbers don’t match his Figures, is that Atlantic SST is increasing from 1949 to 2004, but Atlantic PDI is not.
w.
Here is where that supplementary data, referred to on p. 688 (“Supplementary Information”), is supposed to reside.
Brilliant, Willis. Thanks.
Re #558
Good point. Hmmmm – a five-year weighted moving average. That wouldn’t serve to amplify a weak 5-year autocorrelation, would it? This is looking sweet.