Does anyone think that Kerry Emanuel and Judith Curry each have an obligation to issue a report in Nature and/or Science on the 2006 hurricane season? Corporations can’t just issue financial statements when they have good years; they have to issue reports in bad years. And let there be no doubt – 2006 was a “bad” year for hurricane alarmists. I’ve collated all the storm track data to date. Storm and hurricane days are each off 30%; cat 3+ days by 50% and cat 4+ days by 54%. Hurricane days were at their lowest levels since 1989 and storm days at their lowest levels since Dvorak measurements were introduced in the Pacific in 1987. To my knowledge, this is the first quantitative report of these 2006 hurricane results. Emanuel had something in print using 2005 hurricane data in December 2005 (Reply to Landsea). What’s the over/under on when Emanuel and/or Webster/Curry will report on 2006 results in peer reviewed literature?
The results for storm, hurricane cat 3 and cat 4+ days are indicated in the graphic below:
Figure 1. Total storm, hurricane, cat 3 and cat 4+ days for 5 basins (Atlantic, W Pacific, E PAcific, N Indian Ocean, S Indian Oean + S Pacific). (Storm includes all greater categories etc.)
Webster and Curry argued that the proportion of intense hurricanes was increasing. The proportion also turned down slightly in 2006. (While I haven’t discussed this, Webster et al do not even begin to demonstrate that the results from the last few years demonstrate a change in distribution as opposed to high draws from a stochastic process for a few years). 
Figure 2. As figure 1, showing proportion of storm days.
For reference, I’ve calculated “hurricane days” etc. by dividing the number of 6-hour measurements at hurricane speed by 4. This does not exactly reconcile to the figure in Webster, Curry et al, although the shapes match pretty closely – Webster et al do not provide a complete operational definition. Given the “topological” match, it is highly doubtful that the above results will not also hold for the corresponding indicator in the Webster, Curry operational definition, whatever tghat may be.
. 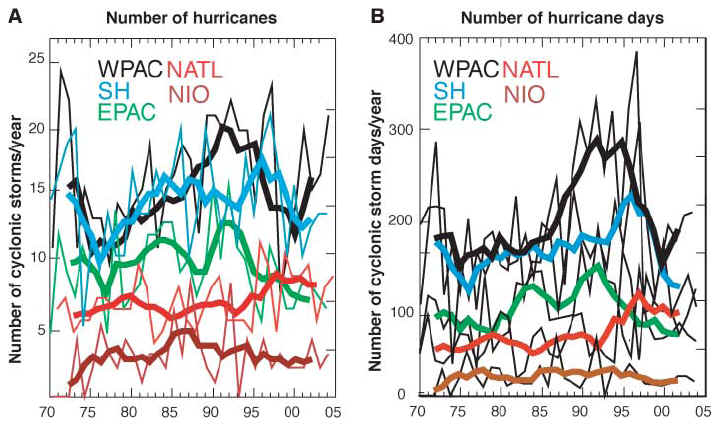
Figure 3. From Webster and Curry. 
Figure 4. Emulation of hurricane-day calculation in right panel of Figure 3.


98 Comments
Does “Cat 4” in the first two diagrams include Cat 5 as well? If so perhaps it should be labeled Cat 4+. If not, what happened to the Cat 5s?
Cat 4 as used here includes all greater storms. I’ve changed label to 4+, but haven’t re-labelled figure.
As you have done the work, why don’t you report on the 2006 season, with no mention of AGW?
Off topic — but could you explain to me why it seems that most peer-reviewed articles about AGW are not skeptical?
Peiser’s study seems not to hold up too well to scrutiny. [link redacted]
And could you point me to a lay outline of the hockey stick debate. I’m not a scientist and don’t have a few spare months to go through all available literature. Is there some quick’n’easy objective overview?
Thanks in advance.
#4 The Hockey stick debate.
At the climate science conference at KTH in Sweden on 11 and 12 September, Prof Hans von Storch (no friend of the sceptics but with considerable expertise in climate science) said that the Hockey Stick was scientific fraud and then went on to compare associate Professor Michael Mann with Hwang Woo Suk, the Korean Doctor accused of scientific fraud related to stem cell research. It is on video at http://gamma.physchem.kth.se/~climate/
The Wegman report (and Steve’s work) make it clear that other papers claiming to support the hockey stick have, if anything, less credibility than the research of Mann et al.
The midle ages warm period did exist and was warmer and more salubrious than now. The little ice age was a lot colder and nastier. Since 1998, the worl has cooled. And its likely that 2006 will be cooler than 2005. How many more years of colling will have to pass before they notice that their computer programs and the climate are seriously out of kilter?
Re #4
That would be this.
Re ¢5:
Wash your mouth out. These simulations are perfect.
Don’t you realise this cooling (I think it started in 1998) is due to the triumphant success of Kyoto?
And that Queen Victoria is alive and well and is now a pole dancer in Las Vegas?
Knaff and Sampson have reanalyzed Western Pacific storms here . The old (“best track”) data used various, significantly different equations for estimating winds. Knaff and Sampson’s “reanalysis” data uses but one equation, so that the wind estimates are apples-to-apples.
The results of this apples-to-apples reanalysis are unfavorable to the Emanuel/Webster hypotheses. It shows essentally no-trend in West Pacific cat 4 and 5 storms over the last 35 years. This is important because the Western Pacific accounts for over 40% of the global intense storms.
The real test will be when the satellite photos are reexamined across all basins. But even that will be problematic, as satellite coverage and angles, which are important to the reanalysis, did not become adequate until the early to mid 1980s.
But, the lack of quality data may not slow down at least one of the proponents. I expect that we won’t see updated Emanuel charts but, instead, he will “move on” to some kind of scare-chart with a new twist.
Here is corresponding data on Atlantic hurricane days. Hurricane days were down 70%, cat 3+ days down 80% and, as of right now, it doesn’t look like there were any cat 4+ days (down 100%).
Re #3:
Steve, this would make a perfect short piece for Eos.
Thanks. And to the first question?
And what happened to the link I provided. Is there some policy on this website that I don’t know about?
Thanks fellas. And to the first question?
And what happened to the link I provided. Is there some links policy on this website that I don’t know about?
Also, I’ve just noticed the debate about average temperatures. For example, here. Has there been a response to these issues?
Thanks again.
What are the y axis units in comment 9?
Hurricane days? Y do you ask?
re: #12
Afraid that’s somewhat a bait and switch. The error, if it is an error, that Lambert is running on about is concerned with the book by Essex and McKitrick, “Taken by Storm” and not by anything Steve McIntyre is concerned with or associated with. And Steve has no interest in going into that subject. Indeed I’d be surprised if these messages survive.
That was John A that redacted the link, not me. I’m not sure why he did, but, in any event, as Dave says, the radian-degree has nothing to do with me. More importantly, it is completely irrelevant to the impact of bristlecones and PC methods on Mann’s results. I’ve spent quite a bit of time dealing with this disinformation in the past and have other things to do right now.
Re #10
HFL: What, in your opinion, makes this publication-worthy? It’s just a counterpoint, after all. And every one knows that the inference of a trend in noisy autocorrelated time-series depends on whether the first and last points in the series are anomalously high (eg. 2005) or low (eg. 2006), such that conclusions may flip-flop every other year.)
Steve M: If hurricane season closes Dec 1, maybe it is possible to write something up in time to coincide with that date?
“El Niño” is the reason (the alarmist will say)
“El Niño” is the reason (the alarmists will say)
One cautionary note: storm reports are considered preliminary until reanalyzed in the off-season. Sometimes storms get upgraded or downgraded as a result of reanalysis, though changes are almost always minor. It’s not a big deal, but just something to note.
12: As to the first question: It simply is not true. There are hundreds of peer-reviewed studies that could be considered “skeptical.”
Steve, the main point that was made by WHCC was regarding an increase in hurricane intensity (specifically a shift in the distribution of hurricane wind speeds towards more cat 4 + 5 storms). Hurricane intensity is linked to increasing SST, both observationally and theoretically (and also in the highest resolution climate models). We do NOT have a theory that explains the total number of global tropical cyclones (only in the N. Atlantic does this appear to be linked to SST) or the number of hurricane days. High resolution climate model simulations suggest that a decrease in total number of tropical cyclones may occur with warming, although the number in the NATL is expected increase.
In the way that we (and Emanuel) have been reporting our results (with running means, etc), the data from one year doesn’t make much of a difference. So data from 2006 (or any other year) won’t change the statistics much. If you compare the global hurricane statistics in 2006 with 2005, you will see that in 2006 there were fewer total global hurricanes. There were proportionately (scaled for the total number of hurricanes) more major hurricanes in 2006 than in 2005 (more cat 3 and 5, but fewer cat 4).
I will leave it to you to plot or analyze the intensity data (peak wind speed or max category). But the year 2006 actually supports the WHCC hypothesis of increasing average global hurricane intensity. Future papers will of course include the 2006 data. But there is nothing particularly astonishing about 2006 in terms of the global hurricane statistics particularly with regards to the global warming arguments.
re: #16
BTW, Steve, this wasn’t the radian-degree thingee but the “can an average ‘temperature’ really be defined” one.
All the better to wait to report on the “startling rise in hurricane activity from 2006 to 2007.”
Re #22
Dr. Curry,
Your point on analysis based on running means is well-taken; it implies your scope of inference is restricted to 5-year periods. The problem is that many people want to make inferences across a much shorter time-scale, such as a single year. Thus there are two options: (1) insist that they unask their question; (2) provide them with the statistics necessary to make inferences on their time-scale of choice.
Judy-
A request for clarification–
You write, “But the year 2006 actually supports the WHCC hypothesis of increasing average global hurricane intensity.”
(a) Is the “WHCC hypothesis” that the proportion of category 4+5 storms will continue to increase into the future?
Or is it that,
(b) There has been an increase in the proportion 1970 to present
If it is (b) then 2006 doesn’t support WHCC or not-WHCC, as the debate is over data prior to 1986. I don’t think anyone has advanced an argument that proportions of Cat 4+5 observed over the past two decades should be expected to occur at levels described in WHCC, but rather the critique is that the 1970s and early 1980s were in fact more like the past several decades than the data suggests (of course, please correct if this is in error).
If it is (a) then I’d be interested in a pointer to where you’ve provided this hypothesis/prediction in quantified terms.
Thanks!
Dr. Curry,
You said:
Can you please explain what you mean? This sounds an awful lot like John Kerry’s “I voted for it before I voted against it” comments.
And, how can there be “proportionately…more major hurricanes” if there were fewer hurricanes? This statement makes absolutely no sense.
I like the use of the (storm type)(days) UOM. This is in line with things like (heating degree)(days) futures used as a – proxy! – for things like heating oil and natural gas price futures.
Paul: I think she is saying that there was a higher percentage of major storms in 2006 (a lot easier way to say it, perhaps).
I believe Webster et al calculated that, once a hurricane has formed, it was more likely to become severe (cat 4,5) in 1990-2005 than it was in 1975-1990. That indeed is different from saying that the number of severe storms (or storm-days) increased.
However, it’s a rather narrow argument which heavily depends on the quality of storm data pre-1985. As the historical data is reanalyzed their argument has weakened, at least so far. 2006 supports their case only if one accepts the 1975-1990 data as-is.
Also, from a social-consequences standpoint, what counts most is the number of severe storms, not the percentage, in my opinion.
As mentioned before, I see Webster et al as the victims of bad data. Yes, they are responsible for assuring the quality of the data they use, but I’ve seen no evidence that they’ve been deceptive or generated Scareplots. They are currently on a narrow, crumbly intellectual ledge, but that’s science. It happens. They were rude and dismissive to Gray but Gray was rude and dismissive to them. That, too, sadly, is science.
I wonder if anyone could provide a translation of this sentence.
A distribution of hurricane intensity can be created by normalizing the number of hurricanes in a particular category by the total number of hurricanes (e.g. NCAT1/N, NCAT2/N, NCAT3/N, etc). This allows you to look at the distirbution of the intensities, in a way that doesn’t depend on the total number of hurricanes. The point of my previous message was that the 2006 data in no way falsifies WHCC’s hypothesis that hurricane intensity is increasing.
Re: #30
David Smith, thanks much for a reassuring summary. I often think I have a handle on the salient points and then I read comments that seem to isolate the discussion back to a sub topic that does not to me appear to have much relevance to main topic.
Re 31: Not all hurricanes occur in the North Atlantic. The highest resolution climate model simulation that addresses this issue (Oouchi et al., run on the Japanese Earth Simulator) indicates a decrease in the number of tropical cyclones globally, but an increase in NATL TCs. This means a decrease in frequency in basins other than the North Atlantic
In the Atlantic, the proportion of Cat4+ storm-days in 2006 obviously did not go up as it was 0.
The second figure above shows the distributions relative to total number of storm-days. IT would be very difficult to show that any change in proportion – if real- did not result from inhomogeneity in the measurement systems.
Re #17
Bender, you’re right of course, it is a counterpoint. I would argue, however, that the issue isn’t trends, it’s the high intrinsic variability apparent within hurricane data (as evident in Steve’s figures). Unfortunately, for the past decade and a half, the traditional focus on climatic variability has been supplanted by one focused on climatic change, despite the fact that our ability to characterize change is dependent upon a more thorough understanding of variability. My encouraging Steve to submit a brief assessment of the 2006 hurricane season in an historical and statistical context to Eos is aimed simply at refocusing the hurricane discussion on the inveterate problems of variability — problems that those who publish papers purporting to demonstrate change simply sweep under the rug.
RE #33 Ken, you’re welcome. I expect to get thumped by someone shortly in this bar-room dustup. Reminds me of college.
I did notice one thing in Judith’s comments, where she mentions a proportional increase in major (3,4,5) hurricanes, which is not the same as “severe” (4,5) hurricanes. It’s a slight apples-and-oranges debating move, but she identifies what she did.
Judith, if you’re still around, I do have a question
The SST plots in Webster et al are not the same as in Hoyos et al. I cannot figure out why they are different – can you help me?
I wonder whether, if one plugged the Webster SSTs into the Hoyos information-theory methodology, the results would be the same. I don’t grasp the Hoyos methodology well enough to have an opinion on this.
Thanks
Judy- Wanted to make sure that you saw #26 .. Thx!
Re #336
I follow. A characterization of the noise properties of the system would be worthwhile. The problem is Mann & Emanuel (2006) suggesting that much of this noise is not noise, but a mid-to-high-frequency signal attributable to a circulatory pathway through which Earth dissipates much of its heat. Their argument is that it’s not linear time-series trends one should be looking for, but linear strengthening of the spatiotemporal fingerprint of warming.
To take that a step further, I recall a regular poster at RC who wanted scientists to determine how much GW was responsible for Katrina and put body and $$$ counts to it.
From an insurer’s perspective, that is not an unreasonable endeavor. Challenging, but not impossible.
Oh, hurricane days down 70%. Good that you confirmed my favorite number, thanks. There are other things that are down 70% in the Atlantic basin, too. 9 storms instead of 27 in 2005, 5 hurricanes instead of 15, 2 hurricanes of 3+ strength compared to 7, etc.
From:
On the Transverse Circulation of the Hurricane
This is all just playing with numbers. Given a sufficient number of numbers, some small pattern is likely to emerge just by chance. That is why humans invented statistics and confidence intervals. So we wouldn’t get fooled by random fluctuations in a series of numbers.
The cat 3,4, and 5 numbers as a proportion of total storms (over the past 35 years) is just that. A fluke caused by a series that fluctuates over time
When we (Steve, bender et al.) started to look at the longer time series of hurricanes (not just 1970 to the present or 1990 to the present), (and not just 5 year averages), the true randomness became apparent.
The National Hurricane Centre data set for the northern Atlantic has its problems and the data sets of other basins have their problems too, but the overall data going back to 1850 is more reliable than just picking 7 5-year averages over the past 35 years.
It is clear that 2006 fits into THAT 1850 to the present pattern rather than data selection patterns used by some to show increasing hurricane intensity over the past few decades.
Thanks Jae. I’ll have a good read of that website soon.
Dave — I know it wasn’t Steve that brought up the impossibility of average termperatures & that it has nothing to do with Mann’s results. However, this site seems to be the best place to get good information on quality skeptical arguments.
Also, McKintrick doesn’t have a blog (as far as I know) and as M & M have worked together I thought Steve might be able to help my find any counter-arguments if they existed.
Sorry for taking this comments thread sideways.
1. Those posts are currently inaccessible. Hopefully this will get fixed (along with RoadMap, image posting, mouse-over comment #s, etc.).
2. Note the devil of a problem created by Mann & Emanuel (2006), who hypothesize that the spatiotemporal fingerprint of warming is complex. This means that the “randomness” described by JW may be attributable to a complex warming signal. It is this “moving on” to a more complex attribution model that has largely pre-empted publication of our simpler linear analyses.
And yet the M&E06 model has a hint of Popperian unfalsifiability about it. We say the fingerprint isn’t there; they say we haven’t got the right search image, or we aren’t looking hard enough, or don’t have the right pattern detection algorithm. i.e. Without an objective a priori definition of this “fingerprint”, it is bound to change each time a skeptic shows that it is not there. This is not science. This is evasive semantics. The orthodoxy asserts its authority by choosing definitions that don’t allow discussion of alternatives. It’s Orwell.
Somewhat reminescent of the argument over the MWP fingerprint. Coolers say it’s there, it’s just not global. Warmers say it’s not global, therefore it never existed. i.e. Avoid the substantive problem of temperature trend atttribution by refocusing on the semantic problem of fingerprint definition and detection. It’s Chomsky.
When it comes to AGW alarmism the left brain doesn’t understand what the left hand is doing.
#47
That’s Dickian.
Speaking of storms and hurricanes (not that I was) I thought some people here may find this interesting:
http://www.lavoisier.com.au/papers/articles/billgrayintro.html
I haven’t got time to read it now, but it seems to be about the 2006 hurricane season.
Hey, isnt it a bit early to close the books on 2006?
In the S Pacific the season is just starting.
We have had a number of v destructive storms at
xmas time in the past.
rhill
#50
Looking at that link, it seems to be concerning the Atlantic season,not the global season.
There is no global cyclone season.
There are both N and S hemisphere cyclone seasons offset about 6 months to each other, with the NH now winding down while the SH is starting to wind up – a deepening low currently SE of the Solomon Islands is likely to become a TC in the Coral Sea in the next couple of days.
There are also variations between the length of the cyclone season in the different basins in either hemisphere, with the North West Pacific and the South Central Indian Ocean usually having the longest season in each – however in the SH in El Nino years the longer cyclone season sometimes shifts to the SW Pacific, which got away to an early start this season with TC Xavier some weeks back.
Typically less than 5% of global hurricanes/typhoons occur in December, most in the SH. Figures 1 and 2 will grow slightly by the end of the year.
The figure in post #9 (Atlantic) is pretty much complete – things in the North Atlantic are already hostile to hurricane formation and will become even more hostile.
Re #22 – Dr. Curry,
could you please tell me some references for:
TIA
Bender, I am attempting to keep all these hypotheses and papers’ contents straight in my mind. My layman’s view of the Mann/Emanuel 2006 paper published in EOS was that they went to great lengths to demonstrate the August/September/October (ASO) SST temperatures in the main development region (MDR) for Atlantic basin hurricanes were a function of, not a reoccurring AMO, but of global temperature changes and “regional enhancement of anthropogenic tropospheric aerosol cooling”. They then go on to reiterate what Emanuel had already stated in his 2005 Nature paper about PDI and hurricanes in the Atlantic basin, i.e. “PDI correlates with MDR ASO SST over a period of 50 years”.
The only moving on that I see is that they have attempted (and tried way too hard in my estimation for a scientific pursuit) to show the relationship of SST in the MDR to anthropogenic causes. Have I missed something in my general understanding of what M/E attempted to do?
On going to Kerry Emanuel’s site to fetch the Mann/Emanuel EOS paper I found this statement by the identified group of climatologists. I do not know whether this is the place to post it but I judge it to be much in agreement with I find the most pressing issue of hurricane activity to be. I do not know how much weight climatologists carry with such policy issues but I did find the statement refreshingly straight forward and particularly so for the sentence: “Federal disaster policies, while providing obvious humanitarian benefits, also serve to promote risky behavior in the long run.”
I have no problem with people moving to and enjoying the benefits of coastal living as long as they accept the full risk and responsibility of doing so.
Re #56 Thanks for posting this, Ken. It’s a reasoned letter. Personally, I agree with nearly all of it.
Some of what they advocate has been underway. My county, which is hurricane-vulnerable, requires new construction to make certain provisions to minimize wind damage. I believe the same is true for Florida.
Another example is that insurance companies have dramatically raised the cost of coastal flood insurance in the Florida Panhandle. A neighbor who owns a ground-floor oceanfront condo near Pensacola saw his flood insurance premium jump from $400 a year to $11,000. The condo owners will try to pass the costs on to the summer renters, who will come in lower numbers due to higher costs, which will slow further growth.
But, these scattered examples need to become widespread.
Well Australia’s storms have not increased in the last 25 years either:
http://gustofhotair.blogspot.com/2006/10/false-optimism.html
Re #58 Nice start on a blog, Jonathan. Please keep CA posted on what you find.
Re #49
From the William Gray presentation (p. 17):
This is part of my overarching question about negative feedbacks … but I don’t have the same command of the specialist language that Gray does. Will have to try to square this one with the authorities.
Re #59
Thanks David Smith, there is a lot of information there at http://gustofhotair.blogspot.com/
in particular how temperatures have not significantly increased over the past 150 years in Australia and parts of Antarctica.
#52
Pardon my lack of clarity. I ment that the data were for the 2006 Altantic season, not all cyclones for the entire year of 2006 across the globe.
The posting in #50 seemed to communicate a fear that looking at 2006 numbers (posting #49) is premature at this stage because 2006 has not yet ended and his area was just entering storm season. I was attempting to soothe his concern by noting that posting #49 was concerned only with the Atlantic season which is now closed. My apologies for choosing the phrase “global season” when I ment to communicate “global storm count” or something along those lines.
#62. For some reason, December is a low month in all hurricane basins. I should amend the graph to insert a provisional estimate for December, but any such estimate would be very small and leave the graphic visually unchanged.
Hurricane Predictions Off Track As Tranquil Season Wafts Away
BY THE NUMBERS
9: The number of named storms this year
17: The number of named storms predicted May 31 by a team at Colorado State University led by Professor William Gray
45 mph: The wind speed when Tropical Storm Alberto hit the Florida Panhandle near Adams Beach on June 13, the strongest winds over Florida all season
56 percent: The average homeowner rate increase Citizens Property Insurance Corp. requested even after no hurricanes struck Florida
27 percent: The Citizens rate increase approved to start Jan. 1
$100 million: Estimated damage in the United States from Tropical Storm Ernesto
0: The number of storms that formed in October, the first time since 2002 that no storms formed that month. Also, no Category 4 or 5 storms formed this year for the first time since 1997.
Link
Drudge Report
Insurance anyone?
RE: #65 – Two words – Warren Buffett.
All’s quiet. One hour to go!
Supertyphoon Leaves at Least 146 Dead in Philippines (Update2)
By Ian C. Sayson and Francisco Alcuaz Jr.
Dec. 1 (Bloomberg) — Supertyphoon Durian, which slammed into the Philippines last night (30 Nov)
http://www.usatoday.com/weather/hurricane/2006-11-29-typhoon-philippines_x.htm?ord=2
The 2006 hurricane season may be a quiet one, but I guess Earth never sleeps.
Not all that quiet if you live in the Phillipines:
With gusts of up to 140 mph, Typhoon Durian lashed the eastern island province of Catanduanes, about 230 miles east of the capital, Manila. Forecasters warned capital residents to brace for potentially destructive winds, and authorities ordered the evacuation of coastal areas.
The “supertyphoon” “¢’¬? the fourth to hit the Philippines in as many months “¢’¬? was packing sustained winds of 121 mph, the Philippine weather bureau said.
Lee writes before he reads. 😉
My point was in the second graph – I thought I’d point this out, just in case you didn’t get that far before you went to write your post.
So you’re going to lecture me on hurricanes, are you? I’m all ears.
Say, how are you on Bayesian statistics? You and Bloom can team-teach.
Re #74:
Well the link tag didn’t work: See Milloy’s take on the 2006 predictions? http://www.foxnews.com/printer_friendly_story/0,3566,233454,00.html
The WMO International Workshop on Tropical Cyclones, IWTC-6, San Jose, Costa Rica, November 2006 issued a Statement on Tropical Cyclones and Climate Change. Please note that this link is to a PDF. The press release is dated 11 December, 2006.
The first paragraph of the press release states:
Further down in the press release, it states:
RE #76 Brooks, thanks for the link.
I’ve scanned it and my impression is that it is a balanced, well-reasoned statement. Not bad for a diverse group.
I had missed the work of the Japanese and of Chan, mentioned in #11 – I’ll look for copies of those.
Bottom line: “The science is NOT settled.”
You are welcome.
The science is clearly not settled, unless the HT wants to begin painting the WMO with the same brush that they have used on Steve M.
Re #76 Yes, thanks for this link. This underscores everything I was trying to say and show in the hurricane threads this Sept-Oct.
A while back someone mentioned that Europeans were entering the hurricane seasonal forecasting field in 2007. I think it was also mentioned that the European methods did a good job in hindcasting prior seasons.
A came across this presentation by Peter Webster, one of the co-authors of the well-publicized 2005 paper. Slide 32 of the presentation shows the 2005 forecasts of the French agency Meteo-France, which appears to be the lead in this European effort:
Here is their June 1 forecast (if I correctly understand their chart labeling):
Atlantic forecast (June-Nov): 20.4 storms
Atlantic actual (Jun-Nov): 26
East Pacific forecast: 7.8
East Pacific actual: 14
West Pacific forecast: 16.7
West Pacific actual: 20
North Indian forecast: 2.5
North Indian actual: -0-
Total NH storms forecast on June 1 by French: 47
Climatology: 47
Actual: 60
The French developed a revised forecast on July 1 with these results –
Atlantic forecast (July-Dec): 17.2
Atlantic actual (July-Dec): 25
East Pacific forecast: 5.9
East Pacific actual: 12
West Pacific forecast: 15.5
West Pacific actual: 20
Northern Indian forecast: 2.7
Northern Pacific actual: -0-
Total NH storms forecast on July 1 by French: 41
Climatology: 41
Actual: 57
You be the judge on the skill of these French forecasts.
I was surprised that their NH forecasts matched climatology on-the-nose. That seems remarkable.
I was also surprised that the French July 1 Atlantic forecast was actually worse than the June 1 forecast, despite having one month of the season “sous leur ceinture”.
As everyone has noted, the true skill will be in forecasting future activity, starting with 2007.
(French forecast and climatology numbers are from reading the Webster slide 32. Actual storm count data from Unisys. If anyone sees an arithmetic or interpretation error on my part, please post, I’ll be glad to correct it.)
This is not to rekindle hurricane talk but simply to record several updated charts on this thread:
Chart #1 shows the Atlantic ACE, 1949-2006. ACE is a function of storm windspeed and duration. Hard to see any trend.
Chart #2 shows the East Pacific ACE, 1970-2006. No trend.
Chart 3 shows US landfalling hurricane count for the 20’th century, placed in decadal buckets. The final bucket is the much-publicized 1996-2005 period. That recent period has one more total hurricane and one less major hurricane than 1946-1955. Basically a tie.
Here’s a tidbit of information I found on here at wikipedia.
I wonder when they changed the method of determining wind speed. If that 12% is true, it seems all storms prior to the change will have to be adjusted upward 12% in wind speed to make more valid comparison.
Re #82: Not to be too finicky about it, but the upward adjustment should typically be more like 13.6%.
Comparing reports from various places on the globe can be quite tricky. I think, though, that the main historical database is adjusted to standardize all the reported windspeeds, so that it’s apples-to-apples.
A big problem is coming up with a wind estimate at all. Below is a long, hard-to-read excerpt from the US National Hurricane Center final report on Hurricane Ernesto (2006). It illustrates some of the difficulties with estimating storm winds:
I’ll interpret: “We never actually measured hurricane force winds (65 knots at the surface) in Ernesto despite repeated efforts. We came close, but not quite. However, we declared Ernesto to be a hurricane at the time and we’re sticking to that, because there might have been a small area somewhere that met the criteria.”
It’s a guessing game, made with the best information available by experts people who try hard, but windspeed is still a guess, even in 2007.
Dave, I’d like to be as optimistic as you about them making an effort at due diligence and standardizing the historical databases. Unfortunately, I came across two different storms early in the database, both of which sat parked at the identical location (32.5n 73.5w) for their entire lifetime. One had a steady wind speed of 50kts for 4 entire days, and the other a steady wind speed of 70kts for 5 entire days. With things like that it’s hard to get a warm fuzzy feeling about database maintenance.:-)
Re #85 Agreed, Bob. I recall finding a Southern Hemisphere storm several months ago in one database which had max winds listed as 850 knots, supersonic velocity. An obvious typo, but the kind of thing that can inadvertently get pulled into an analysis.
After the disappointing 2006 hurricane season, Chris Mooney is waiting with bated breath for 2007 hurricanes. The first 2007 SH hurricane got its own thread.
Re: #86
This incident probably calls for a climatology graduate student alert. And with our special relationship with Georgia Tech, you might want to start there.
#87 maybe Chris Mooney is just interested in cosmic rays:
Click to access GCRHurricanes.pdf
[Abstract] This paper explores a causal relationship between Galactic Cosmic Ray (GCR) induced ionization and the cloud structure that supports hurricane development. Several observed phenomena can be explained by a relationship between cosmic rays and hurricanes. These are (1) the need for an atmospheric low pressure system, (2) the requirement of strong updraft, (3) and the need for high sustained winds along the ocean’s surface for hurricane development; and (4) the disintegration of a hurricane system as it comes onshore and travels over land. An atmospheric low pressure system allows greater penetration of GCRs at the ocean’s surface. A strong updraft pulls ocean salt water aerosols high into the atmosphere where they are exposed to very high levels of ionization. High sustained winds at the ocean’s surface controls production of ocean salt water aerosols. As hurricanes travel over land, they are starved of marine aerosols which in turn constrain hurricane cloud development & lifetime. This paper presents the hypothesis that ocean salt water aerosols and GCR ionization are primary components of the hurricane formation and intensification process. Surface wind speed drives the production rate of marine aerosols and GCR induced ionization drives the nucleation of marine aerosols and cloud growth.
Actually, the real Southern Hemisphere news is the weakness of the 2007 season (so far).
There were only three storms in January, which is the second-lowest count of the last 63 years. The normal count is about 6 or 7 storms in January.
Also, a glance at years which had below-normal Januarys indicates that the odds are the entire SH year will be below-normal.
Comments from Hong Kong on the 2006 Western Pacific storm season are here . A glance at their Figure 1 is worthwhile.
#91 Dave
Thanks for that link. I was looking for that type of info on the West Pacific. I reference Emanuel’s comment:
“My own work has shown that hurricanes are responding to warming sea surface temperatures faster than we originally expected, especially in the North Atlantic, where the total power output by tropical cyclones has increased by around 60 percent since the 1970s.”
The NOAA does a pretty good job of doing exactly what Emanuel purports to have emulated and I suppose if you look at http://www.ncdc.noaa.gov/oa/climate/research/hurricane-climatology.html and ignore everything prior to 1970 you might be inclined to agree with him. The NOAA also publishes the info as total energy http://www.ncdc.noaa.gov/oa/climate/research/2006/hurricanes06.html which shows the same alarming lack of any trend associated with AGW, especially in the North Atlantic. In fact the current cycle of total hurricane activity has been emulated in the 30’s and the 50’s.
Commentary on the non-eventful 2006 hurricane season has been absent from all but the most selective sources which is not surprising, considering that the threat of MEGA storms was the posterboy of the 2005 season.
More selective hyperbole.
Author: Pavel Mazirka
Editor and Co-writer: Sarah Costa
April 25, 2008
Stony Brook University
No rights reserved.
Hurricane Trends
For a course on global warming at Stony Brook University, our semester-long project was to analyze a published set of data concerning climate change. The class was divided into different groups and each group was given an article to analyze. The figure that our team had was concerning the trend of major hurricanes and was published by Stanley B. Goldenberg. It stated that hurricane wind speed and number of violent hurricanes per year have remained relatively constant. After doing some research, we discovered that Goldenberg has a theory, which got published in the Science magazine, about the trends of major hurricanes. The theory states that the frequency of storms alternates every decade, where a 10-15 year period with a high occurrence of major hurricanes, is followed by 10-15 year period with a much lower frequency.
Our first step in examining this information, was finding the set of data used by the author and graphing it on our own computers to see if it matches. We found that data at weather.unisys.com website. This set of data was plotted using Microsoft Excel and then scrutinized closely. This figure supported the article, except that our data started in the year 1854, while the one in the article began in 1944. Looking at both figures, it is clear that the annual number of major hurricanes fluctuates in accordance with Goldenberg’s theory of decadal trends. Our information was also consistent with figures made by Goldenberg in the article published in Science Magazine.
We also did some research on Goldenberg to see if he is a credible source of information and not someone who would have financial or other types of gains from disproving global warming. After several hours of browsing the World Wide Web, we came to the conclusion that Goldenberg is a very well known and respected scientist who works for the National Oceanic and Atmospheric Association (NOAA), a federal group that monitors things like hurricanes, tsunamis and other climate phenomena.
NOAA has a large amount of data regarding the subject of hurricanes. This organization not only monitors and records hurricane activities and data, it also analyzes that data and tries to make predictions for the future. According to their website, the large number of major hurricanes since 1994 further supports Goldenberg’s theory. This trend of intense hurricane seasons is normal because the previous twenty years, 1974-1994, only had an average of 1.5 major hurricanes a year. It is also said that current research regarding hurricanes and their future trends is “inconsistent” and “such contradictory results as to suggest that the state of understanding of tropical cyclogenesis provides too poor a foundation to base any projections about the future.”
Though, despite saying that predicting the future of hurricanes is very difficult, NOAA made a climate prediction for the year 2007 saying that it will be an “above-normal 2007 Atlantic hurricane season,” with “7-10 hurricanes [and] 3-5 major hurricanes.” This prediction was based primarily on the rise of the sea surface temperatures, which were “above average [0.56oC].” But as witnessed by all of us, 2007 was an extremely pacific year, with six hurricanes, of which only two were major. This shows that sea surface temperature do not affect hurricane activity as much as most people assume they do.
Yet Greg Holland of the National Center for Atmospheric Research (NCAR) and Peter Webster of Georgia Institute of Technology are saying that the hurricane activity has doubles over the past century and even a quiet year like 2006 six, “with five hurricanes and four other named storms… would be considered normal or slightly active compared to an average year in the early part of the 20th century.” Greg Holland and Peter Webster both assume that such increase in hurricanes is largely due to the rise of the sea surface temperatures (SST). But as seen by the predictions made by NOAA and the actual outcome, such assumption is flawed.
The article by Holland and Weber says that “data errors alone cannot explain the sharp, high-amplitude transitions between the climatic regimes,” but there is more than just data errors. Collection of data from aircrafts did not start until 1944, the first hurricane was named in 1954 (econet.com) and the satellite imaging began in mid 1970s. Therefore, most data before 1940s is extremely unreliable, and considering that the population of most regions was a lot lower, the effects of some hurricanes did not appear as drastic as it could have been today. Hence it is likely that a hurricane in that time period was not given a proper category. And if looking carefully at the figure of major hurricane trends, it is clear that the storm occurrence has changed very little, and if it was not for the above normal 2004 and 2005, years 1995-2005 would have been identical to 1965-1974 and 1936-1946.
At the beginning of this project, we expected to find a major flaw in Goldenberg’s theory. Yet after weeks of research and data analysis, we came to the conclusion that there is simply not enough evidence and data consistency to prove a link between sea surface temperatures, global warming and hurricanes. This discovery came as an interesting surprise to our group. It is reasonable to assume that the public did not understand the full facts that surfaced on major news networks after hurricane Katrina and therefore falsely believes that major hurricanes are a direct cause of increasing Global Temperatures. As the incorrect NOAA prediction for 2007 hurricane season showed, a large increase in sea surface temperature, .56 °C, has no impact on category or number of hurricanes.
Pavel and Sarah, thanks for contributing your class research, I have some comments and questions:
I am curious to know if your instructor requires this “credibility” search as a litmus test when it comes to doing critical research of a global warming topic such as hurricanes? Also, what is your definition of financial gain from research? I wonder if your prescribed notion of impartiality is violated by certain figures like Al Gore, James Hansen, UN IPCC, etc. who have considerable investments in “proving” global warming.
Seasonal forecasting is a totally different animal from global warming/climate change predictions. The sea surface temperature (SST) is an important contributor to Atlantic hurricane activity, yet it is not the whole story, and in some years like 2007, may give the wrong answer. It is well known that other factors are responsible which range from ENSO teleconnections to Sahel Africa rainfall to Saharan dust. Extenstive discussion of this topic is found throughout Climate Audit’s archives. You are correct in stating that SST effects are overstated in general, but it is an open research question.
Why was your initial assumption that Goldenberg’s theory was flawed, and why were you surprised about your results? Also, you are remarking that the “public” does not understand the full facts. Journalists tend to use this type of language (some say… it has been noted that…) to editorialize their own experiences or feelings into an article through generalized anecdotes. Thus, in the very next stanza, you discuss “full facts” and then present a completely false statement:
Researchers have to be very careful with word choice and separating cause and effect, especially when examining such quantities correlated highly like hurricane activity and sea-surface temperature. In your case, you evidence one quiet season with a busted seasonal forecast as being contrary to global warming. This evidence has no more or less weight than evidencing 2005 as commensurate with AGW theory.
Do scientists who depend on public grants to fund their research also count as individuals with a financial stake in their findings?
It’s a well known principle in science, that the best way to increase your funding is to discover a future catastrophe that can only be avoided by increases in your teams budget.
Hi everyone!
I am in the middle of studying for my finals, but once they end (this friday) I will be more than happy to answer all
your questions and will also post our graphs.
check back this weekend! and thanks for reading the paper!
HI everyone!
I am in the middle of my finals right now, but once they end, I will answer all questions and post our graphs.
So check back this weekend! Thanks a lot for reading the paper!
Since it’s a course on Global Warming, I hope you did not fail because of obviously wrong conclusions. A little crash course from this site on various mannian adjustments and other creative statistical methods would have helped you get the right correlation and trend 😉