Esper considered three different methods of standardizing tree ring widths and concluded:
For the Gotland TRW data, the resulting three different chronologies do behave differently in the late 19th and 20th centuries. Such difference would influence one’s interpretation of the climate history represented by these chronologies.
The three different RCS chronologies are developed as follows:
1) standardization using ratios. A population age-curve is calculated. Then for each core, the ratio of the ring width to the standard ring-width is taken. These ratios are averaged by year to make a "chronology".
2) standardization using residuals. For each core, the residual of the ring width to the standard ring-width is taken. These residuals are averaged by year to make a "chronology".
3) power-transformation prior to standardization using residuals. In this case, the ring widths are taken to the 0.352 power (Cook and Peters [1997] describes a process for selecting the index in the power transformation, but I haven’t studied this yet.) A population age-curve is calculated and the residuals are averaged by year to make a chronology.
Many tree ring methods date back almost to days when computing time was hard to get – a point that is not mine, but Cook and Peters [1997] – Cook being by far the most reflective Hockey Team player on dendro methods. If you look at Figure 1 below, you’ll see why dendro people talk about "stablizing variance".

Figure 1. Scatterplot of annual means versus standard deviation. Left: raw data; Middle: after calculating ratios (see method 1); Right: after power transformation (method 3).
It seems to me that two different things are going on with this data: first, the data is strongly non-normal. The proposed power transformation mitigates that, but not entirely. But separate from the non-normality is the heteroskedasticity. The data has much bigger variance in big-growth years than in little-growth years ["heteroskedasticity" in this context – you oculd have this with normal distributions as well]. I don’t see how one of these simple monotonic transformations of the data gets rid of heteroskedasticity, although they mitigate non-normality.
Here’s what Esper et al [2003] say:
Residuals without PT do not change the heteroscedastic nature of raw TRW series, a benefit that occurs by calculating ratios. The power transformation, as introduced by Cook and Peters [1997], stabilizes changing variance prior to the calculation of residuals.
I can’t see how you can make any sense whatever of that statement or how their methodology ties in with their objective. I’ll ask Ross about this – he’s got lots of experience with heteroskedasticity.
Anyway, moving on, here’s the plot of the three resulting chronologies, together with Esper commentary:
However, significant differences are recorded in the modern period since the early 19th century. Calculating ratios results in higher chronology levels after AD1830 with increased variances; the PT plus residuals result in lower chronology levels, occasionally below the long-term average, with decreased variances; and indices from residuals perform somewhere in between.
For ratios when the RC spline of the age-aligned series gets close to 0.5 mm., in this example the resulting indices can overestimate "real" growth levels and their variance may have a positive bias (Cook and Peters 1997 – Figure 4B)
For residuals, the fundamental penalty of not stabilizes variances of heteroscedastic TRW series, is of minor importance to the RCS method [Braker 1981]. This is because RCS is usually computed for very long data sets from living and dead trees. After converting the series back to calendar years, the persistently high-variance periods of young trees and the low-variance periods of old trees are evenly distributed over the entire chronology length. In other words, the RCS-chronology averages juvenile and adult trees over every calendar year except in the 20th century when the Gotland trees age synchronously.
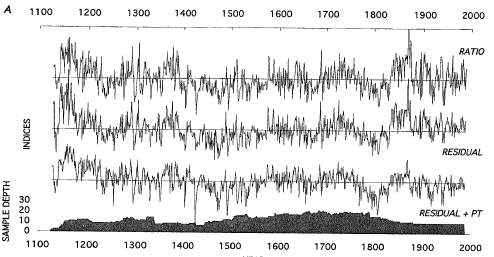
Figure 2. Esper’s Figure 4A.
It is obviously very unsatisfying that the results of the chronology should depend on whether rarios, residuals or power-transformed residuals are used, without a detailed statistical analysis.
As an exercise, to verify my own program for calculating RCS chronologies, I’ve tried to replicate Esper’s figure, as shown below in my Figure 3. To my knowledge, no RCS chronologies exist in a publicly archived digital version for any publicly archived set of measurements, which seems a very odd state of affairs given the increasing policy reliance on this methodology. Anyway, I can’t see much difference between my calculation and Esper’s.
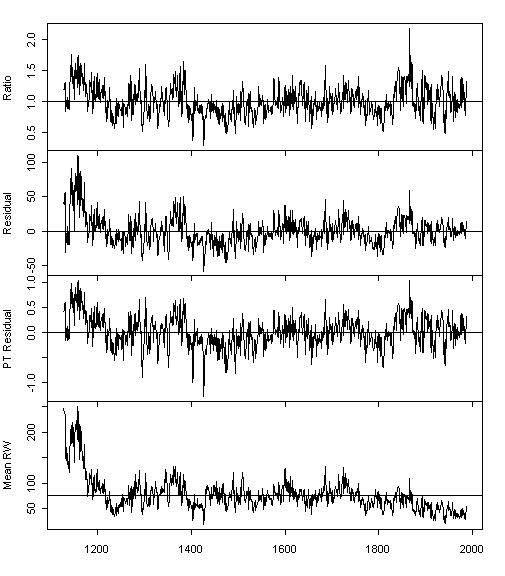
Figure 3. My replication of Esper’s Figure 4A.
Esper goes on to discuss the potential impact of pith offset in chronologies. I’ll post up on another day about these and other issues in RCS chronologies.


One Comment
Ring widths follow a log-normal distribution. Precipitation also follows a log-normal distribution. The power transformation of Esper converts the RW log-normal distribution in a distribution that appears to be neary normal and then they say this time series can be used to reconstruct temperature.
One could also apply this same transformation to preciptation directly and get a transformed normal distribution. But it would not be a measure of temperature. In fact, it is frequently true that there is little correlation between temperature and rainfall.
Bottom line, I think any proxy with a non-normal distribution on the century time scale should not be used as a temperature proxy. This just expands on my comments in an earlier thread ( http://www.climateaudit.org/?p=358#more-358 ).