The NAS Panel showed the following spaghetti diagram.
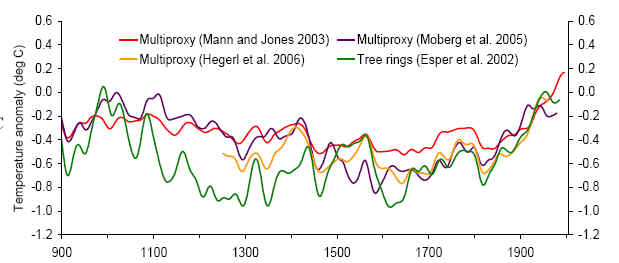
From NAS Panel.
The Esper et al 2002 reconstruction shown here is not actually in Esper et al 2002 in this form, but attributed to Cook et al 2004. I wonder where they got the digital version, as I’ve been unable to locate this version, although it is a linear transformation of the Esper series archived at WDCP here.
I’ve tried to replicate this simple calculation, but, as usual with anything to do with the Team, nothing’s ever straightforward.
The calibration in Cook et al 2004 is attributed to Briffa and Osborn 2002 (Science), which was a review article on Esper et al 2002. In that article, they re-calibrated Esper et al 2002 according to methods of Briffa et al 2001 (JGR) , which re-calibrated by regression of various reconstructions against CRU NH values for 1881-1960, except for Crowley and Lowery where part of the calibration period was excluded due to “poor fit”.
In this case, Briffa archived the fitted values from their regressions and the dated CRU series used for calibration, so you’d think that replication would be straightforward. But it’s the Hockey Team.
Jones et al 1998
First I tried the Briffa re-calibration with the Jones et al 1998 reconstruction. Top is the archived recalibration; middle is my calculation using the archived Jones et al 1998 version and bottom is the difference between the two. Up to rounding, a perfect fit. So it looks like I’ve replicated the method and the rest should be smooth sailing.
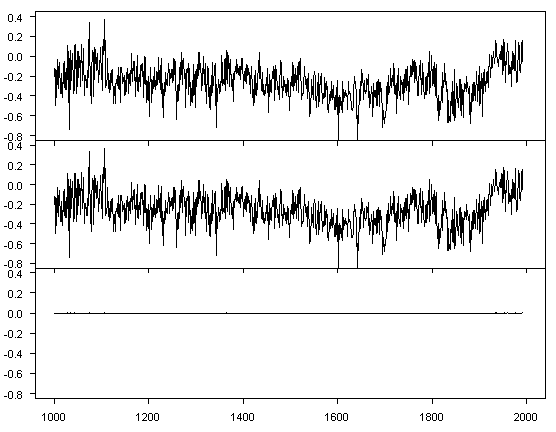
Figure 1. Jones98 re-calibration. Top – As in Briffa et al 2001 archive; middle- emulation from archived Jones 98 reconstruction; bottom – difference.
MBH99
Next I tried MBH99, comparing the Briffa version to a recalibration of the original data. Again, top is the Briffa version; middle my emulation of the Briffa recalibration from original data and bottom the difference. Here the difference ranges from -0.21 to +0.21 and is not negligible. What accounts for th difference? Who knows?
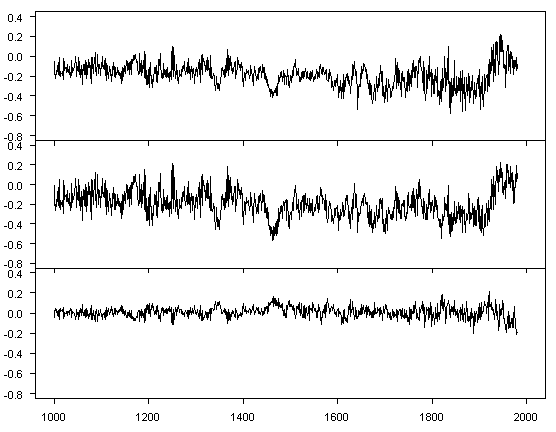
Figure 2. MBH99 re-calibration. Top – As in Briffa et al 2001 archive; middle- emulation from archived Jones 98 reconstruction; bottom – difference.
Crowley and Lowery 2000
Here Briffa said that they omitted the 1901-1919 period in calibration because of "poor fit" . They say: "We do not advocate such an approach but simply follow the procedure used by Crowley and Lowery themselves (in fact they omit the longer 1881-1919 period".
Growing a little weary with ad hockery, I tried doing calibrating without excluding part of the index period to see what happened. Here the differences were between -0.4 and +0.3, with especially pronounced 19th century differences. It appears that Briffa used a different CL version – the one in which Crowley spliced the instrumental record into the proxy data set (I’ll double check at some point as I’ve worked through this in another context and haven’t verified versions here.)

Figure 3. Crowley 00 re-calibration. Top – As in Briffa et al 2001 archive; middle- emulation from original reconstruction; bottom – difference.
Overpeck
Just when I was despairing of replicating any other versions, I got a decent replication of the recalibrated Overpeck series from original data.

Figure 4. Overpeck re-calibration. Top – As in Briffa et al 2001 archive; middle- emulation from original reconstruction; bottom – difference.
I’m baffled as to what’s going on with the MBH99 recalibration. Is it possible that Briffa did a digital scan of MBH99 and used that, thus accounting for the differences? Is there a different version of MBH99 floating around Hockey Team-land?
Whatever the answer, for the purposes of recalibrating Esper, I’m going to take the position that the successful replication of the Jones et al 1998 recalibration indicates that I’ve captured the method and the discrepancies in the other series are simply more snares from the Hockey Team set to trap the unwary.


25 Comments
Publish.
Wow, after years of work, you are finally able to fully replicate a SINGLE Hockey Team reconstruction! Congratulations! I wonder if the HT has ever heard about the Scientific method?
No, I have not yet managed to fully replicate a single reconstruction.
In this exercise, Briffa et al 2001 merely collated and re-scaled 6 reconstructions and I was able to exactly replicate one of the 4 re-scalings that I tested given the target series. (I haven’t been able to replicate the target series used by Briffa).
There has been lots of hoopla in the media lately about the very warm temperatures affecting North America (and Europe) at present. Essentially there is a necklace of high pressure areas along the 35 to 40 N band of latitude. The jet is well to the north and quite unlike how it was as recently as early June (wavy) it is quite flat. It will be interesting to see what happens over the next week or so. Our local NWS is progging a major shift mid next week, may even get the brush of the southern fringes of some systems after mid week. Lest anyone forget, unlike the media-concentrated east of the Mississippi area, out West we had a long lasting winter and almost no real spring. In late February and throughout March, we had some remarkable low elevation snow events in the Mediterranean climate zones here – remarkable in terms of strength, lateness and the sheer number of them. Our wine grape crop is seriously low in yield owing to sheer low numbers of grapes due to inactivity of bees during the critical window of our pathetic excuse for Spring. Berry crops, while reflective of a large number of realized fruit, are in danger of late ripening and subsequent issues due to lowering sun angle during the most critical time. If Summer ends up being short overall, I will have to to view the current “heat wave” as a short term oddity as opposed to “evidence of global warming.”
Well brief, or even month long, cold events are usually dismissed by the AGW crowd as “That is weather not climate” while one warm day is further evidence of Global warming.
Having said that. What makes you think that us Eastern types had a warmer/nicer spring then you west coast weirdoes did?
Our spring was non-existent, other than it raining every day for 3 straight weeks in New England. Temperatures were not warm. I think we had two nice days in May, and warm days didn’t return until late June.
My understanding is that this was true for Engurland as well.
Just had a brief but impressive rain storm here. Temperatures are warmish, but after the heat wave the nighttime temperatures dropped into the low 60s
Yes, and its gets even more interesting when you get up here above 60N around 25E. We had warmer than usual for about two weeks, and media was making “hoopla” about that. Right now we have colder than usual, and the media is making “hoopla” about the heat wave in England/France/Germany 🙂
RE: #6 – “60N around 25E” – Vodka country! 🙂
RE: #5 – that is even more damning in terms of the media behavior then.
An attempt into the RC queue:
“Another interesting datapoint regarding the impacts of the West Coast’s nearly non existent spring is the fact that the berry crops while prolific are ripening late. Even the recent heat has not been enough to overcome this. I am a small grower but struggle a bit due to an ENE facing exposure on a hill. So, I really need to have my fruit already well along during the Solstice. Unfortunately, this year the fruit is only now at that point. The sun angle is already getting low enough that I am seeing uneven rippening, which is sad, because, even though I have a record number of (Olala) berries on the vines, many of them will be poor in quality. There are still even a few blossoms in evidence, those berries will probably be affected by the fall rains. I have to imagine other growers are experiencing problems as well this year.
by Steve Sadlov”
Steve, do you grow ollieberries? Because if you did you spelled it wrong, which I would not expect someone who actually grew them to do. I would put an ad-hom in here, but I won’t.
As far as the weather in central/northern CA, yes there was a late snow in the coastal area in March. This is something I have experienced before, although the snowline did not extend down to sea level like it did this year. Usually the late snows (or any snows) show up around 2000 or 3000 feet in the coastal mountains.
BTW, I looked at the NWS maps for the bay area this weekend and there seems to be a heat advisory (fairly rare) from Pt. Arena South, execpt along the immediate coast. When Santa Cruz and environs are predicted to have a high of 90-100, it is a real live heat wave. I lived in SC for 20 years and days that hot were rare indeed. Generally we considered temps in the mid-80’s to be an epic heat wave, the sort of conditions where everyone complained.
What you are describing is weather; I am also out west in Bozeman MT. We had a winter which hardly anyone noticed. Rain in January. Historically this time of year our high temps are in the 80-85 range during a heat wave. We have had temps in the upper nineties for the last two weeks and temps are projected to go into the 100’s this weekend. I have lived here for 5 years and we have only had one other heat wave which rivaled this. The problem is that we also had a very warm and dry spring…
So I’ll give you a cool spring and raise you a warm one. What the whole country is experiencing might not be due to AGW (as one can never with any certainty at all ascribe a particular meteorological event to AGW, not even Katrina), but it may well be a taste of what is coming.
RE: Santa Cruz For the past 20 years this may be true, but if we look at the historical record we see a downward trend since 1873 in fact the records for the 19th century are signfigantly higher than the 20th
http://tinyurl.com/gofge
http://tinyurl.com/eeqxv
Record for Bozeman was in 1960
http://tinyurl.com/gz2sl
101F
Hottest ever was in 1937 (117F)
http://tinyurl.com/gs3sa
Temp record
http://tinyurl.com/fj5nn
Woooaaa talk about some variance.
ET, I think that if you did a best fit analysis (I have only done a squint test) you would find an upward trend in the Santa Cruz records since around 1900.
Of course your link shows that the record for today (7/22) was 100. My thermometer showed 97F (7/21) today, about 12F above average. My thermometer is on a north facing wall (well actually the sensor is several feet away from my domicile) which does not get any sunshine: care to argue?
As far as your record for the state: Medicine Lake is located in what we call “West Dakota”. The climate there is considerably different from what it is here (get the point?, climate and weather varies from place to place. Cherry picking, which is what you have done, leads to nonsense results.) If you look at the actual records for Bozeman proper you might find a different trend. Cherry picking again, but I can play it just as well as you can. The point remains that this is an unusually warm and dry spring and summer. Our drought out here is going on ten years. Fires in MT have burned up near to 1,000,000 acres at this point and it aint going to get any better.
Things are very odd in the context of the last decade out here in MT, and they are a bit odd in Santa Cruz. In fact, although I will not attribute the oddities which we find around the world to AGW, things are a bit weird.
You completely missed the point.
Yes the trend from 1900 to present is upward, it’s only when you go back, when there was little, if any, increase in atmospheric CO2 that you find it was warmer than it currently is. Yes it is weather, but you like to cherry pick yours, I cherry pick mine.
Again not the point, the record was 4 decades ago, when there was less CO2. Pointing to a warm spring in your backyard this year means nothing. Don’t need or want to argue, the record is part of the official record, argue with your local meteorologist.
Cherry picking is what your doing, so I tossed the cherries right back at you.
Things are always weird, weird is almost the norm. There have always been strange weather events. Odd warmth, odd cold. Just a couple of years ago we had snow all the way into late may, that was weird, about 7 years ago Boston got two feet of snow on April 1st. There is weird weather going back to the beginning of any records. Our current weather may be weird at times, but nothing is abnormal compared to what has happened in the past.
[mind boggles]
It’s a heat wave. How is that wierd. It’s not like we’ve never had a heat wave before.
The heat wave of 1911 in Europe was worse, much worse, than the current one.
ET, the point is, that (although I will not attribute it to AGW) that summers (and winters) have been much warmer that normal here in MT. And as far as heat waves go, the geograhical extent and duration of heat waves seem to be getting larger. Note that the current heat wave encompasses almost the entire lower 48 and, it seems, much of Europe as well. The problem is that widespread and unusual heatwaves seem to be increasing. Record events do not matter as much as the trend.
You can keep denying as much as you want, but most people who are observant realize that something odd is going on. Go outside of you air conditioned house and you air conditioned office and see what the real world is like.
OT, and it is just weather, but sitting here in Sydney, I’m oft amused by England “bracing itself” for 38C, or in North America “shocking” temperatures approaching 100F.
In summer here temperatures like that are routine. Hundreds don’t die, schools don’t close, I play golf and species don’t become extinct.
I suspect that much of the reason for this difference in perceptions is that some places are simply not built for such temperatures, England being the prime example, with the architecture primarily designed to keep heat in.
Jan 2 this year, it hit 44C and I’ll concede that was hot. Neverthelesss, it was tolerable, inside, where I live (and I don’t have air con, although we are well insulated and face south). The summer overall was mild and the current winter has been quite cold, although the snow is poor for the ski season. Go figure.
James : I was driving around in an unairconditioned car with big untinted windows on Jan 2. It got hot in there but I didn’t die. In fact it wasn’t even all that unpleasant for me, even though I prefer cold weather.
I can’t say the climate has noticably changed in the 25+ years I’ve lived here. Same as I always remember. My gut feeling: No worries, mate.
One thing that has been bothering me lately.
I get Australian visitors here in the UK, and they say “It’s hot isn’t it”, and I say, “How can you say that when it’s about 20C hotter where you come from”, and they say “it’s the humidity”.
My point is, when I was a boy, I remember hot summers in England (well warmish), but they weren’t humid, but now they are.
I looked for some history of relative humidity in the UK, but can’t find any, and usually we have a history of everything.
Anyone know where you can look up relative humidity over a long time scale?
#15. Its warmer than the 70s without doubt. We were chatting at dinner last night with my mother who says that it was as hot and hotter in the 1930s. The all-time annual average record temperature for the US is still 1933 or 1934. 1998 came close but didn’t pass it – and one would be invlined to think that there is at least some possibility of measuremebt drift in which the later series would measure a little hotter rather than colder.
Post into the queue at RC, regarding the feedbacks thread they’ve now gotten going:
“Regarding moisture, especially in the tropics. I just got back from spending a few weeks in the tropics in SE Asia. Here are some qualitative observations. This is related to being at the edge of some typhoon outflow. With the relatively high sun angle still in place, prior to the approach of the disturbance it was very hot and muggy, with much heat trapped in the boundary layer especially in urban areas. With the onset of typhoon / monsoonal mode, firstly there was enough wind to stir things up and secondly the clouds and rain resulted in significant cooling overall. Without the muggy stillness, less heat was trapped in the boundary layer at night.
Changing gears to the mid latitudes. Witness the synoptic progression in California since mid Spring. First we had the persistent Siberia Express / deep digging trough until June. It slackened a bit in June but nonetheless we had a cold and moist June. We had a “normal” Summer pattern for about a week (e.g. Pacific High, onshore breeze, warm inland). Then the “heat wave” set in, driven by three weeks of a rather non wavy jet, coupled with a tripple barrel high and subsequent offshore flow. Interestingly, such a configuration is far more typical of Fall than Summer here. Coupled with the July sun angle, it meant oppressive heat. When this broke down last week, it broke down in the extreme. Got the major onshore push and a 3K ft deep marine layer, well intruding. Now, there is a trough digging, and a cut off low progged to be in place by the weekend. It will be interesting to see what we get the rest of this month. The cut off may actually yield some pops. A cut off doing that in September would be unremarkable but in August, it would be unusual – August rain here is usually from the monsoon not a cut off.
Key metric – opening day for Squaw Valley.
by Steve Sadlov”
RE: #15 – 19 – While it may be hotter now in some places than it was during the 70s, I also think most people have been softened over the years by AC. Even though we lived in a hot summer place, we had no AC when I was a kid. The surface record biases more and more upward with urbanization and the increasing ubiquitousnous of electrical and other man made energy disipation sources (including, of course, all the AC no one used to be able to justify!). Combine that with a AGW-biased media – “Hottest Summer Ever In The US!” …. etc.
re: #15
Which is nothing but anecdote. Assuming you aren’t old enough to have been around in the 30s, you likely started life in a cool period, which means you’ve “seen” only a very small portion of the climate cycle, which started warming after the late 70s.
Most people that are observant AND have a solid understanding of science realize that simple perception of what “is going on” is not enough to draw broad conclusions of trends.
Mark
RE: #10 – 13 – JMS: What newbie, 20 years, sheesh. Generally speaking, the 70s were hot in No Cal, on either side of whatever hill. 80s were nothing either way. 90s were coolish. Finally getting back to where we were in the 70s again. Total ad hom about my misspelling – it’s not exactly a word you see written, however I’ve heard it since I was a kid, so SORRRY if my transliteration was incorrect. Yeah, you’re ad hom. What a schmuck.
August is off to a very cool start in No Cal. Got a series of troughs lined up. Some rain up north of here. Very early in the year for this.
“and one would be invlined to think that there is at least some possibility of measuremebt drift in which the later series would measure a little hotter rather than colder.”
Steve the drift on Thermistors is in the opposite direction. Of course I’m talking about the raw dta, and not any mathematical correction.