One of the critical issues in Emanuel 2005 (and presumably for other like studies) is how measurement inhomogeneity is dealt with. Emanuel relies on Landsea 1993 for a procedure to downward adjust pre-1970 wind speeds. However, prior to Emanuel’s article, Landsea – who seems vastly more authoritative than Emanuel on hurricane data – had pointed out further inhomogeneities between 1991 and present-day measurements, requiring the upward adjustment of data from the 1980s and 1970s. Indeed, his response to Emanuel raises the issue of whether the need is to adjust 1970-1990 data upwards rather than adjust pre-1970 data downwards.
It is now understood to be physically reasonable that the intensity of hurricanes in the 1970s through to the early 1990s was underestimated, rather than the 1940s and 1960s being overestimated.
It seems clear to me that every hurricane measurement needs to have the estimation method attached to it. For Emanuel to draw lurid trend conclusions with such weak analysis of homogeneity is all too typical of climate science.
Most of Landsea’s publications are available online here) . Landsea et al (Science 2006) and Landsea et al 2004 – re-analysis of Hurricane Andrew – are especially relevant to homogeneity issues.
One of the key changes in the last 15-20 years has been the increasing availability of direct overhead satellite images(rather than oblique) images and, prior to that, the introduction of infrared imagery in the mid-1980s. These changes are reported to have the effect of frequently increasing measured wind speeds. Landsea et al 2006 observe of Hurricane Hugo in 1989:
For example (13), Atlantic Hurricane Hugo was estimated to have a maximum sustained surface wind of 59 m s–1 on 15 September 1989, based on use of the Dvorak Technique from an oblique observational angle. But in situ aircraft reconnaissance data obtained at the same time revealed that the hurricane was much stronger (72 m/s) than estimated by satellite. This type of underestimate was probably quite common in the 1970s and 1980s in all tropical cyclone basins because of application of the Dvorak Technique in an era of few satellites with low spatial resolution.
Landsea et al 2006 illustrates 5 North Indian Ocean cyclones in the 1980s which were under-estimated, saying:
The North Indian basin tropical cyclones shown here are listed in the best track data set as category 3 or weaker, but were probably category 4 or 5. Similar underestimates may have been common in all ocean basins in the 1970s and 1980s. Trend analyses for tropical cyclones intesities are therefore highly problematic….Another major tropical cyclone, the 1970 Bangladesh cyclone”¢’¬?the world’s worst tropical-cyclone disaster, with 300,000 to 500,000 people killed”¢’¬?does not even have an official intensity estimate, despite indications that it was extremely intense (22).

Image of Indian Ocean Cyclone from Landsea et al 2006.
They go on to say:
Ongoing Dvorak reanalyses of satellite images in the Eastern Hemisphere basins by the third author suggest that there are at least 70 additional, previously unrecognized category 4 and 5 cyclones during the period 1978–1990. The pre-1990 tropical cyclone data for all basins are replete with large uncertainties, gaps, and biases. Trend analyses for extreme tropical cyclones are unreliable because of operational changes that have artificially resulted in more intense tropical cyclones being recorded, casting severe doubts on any such trend linkages to global warming.
Landsea et al 2004 , published before Emanuel 2005, also pointed out these problems in the specific context of a re-analysis of Hurricane Andrew (1992), which was re-classified from a Category 4 to a Category 5 hurricane. They observed:
New global positioning system (GPS) dropwindsonde observations in hurricane eyewalls”¢’¬?first collected in the eastern North Pacific from Hurricane Guillermo in 1997″¢’¬?suggest that the intensities of all of the hurricanes in the aircraft reconnaissance era up through 1998 should be re-examined when the primary method for estimating surface winds was from flight-level wind adjustments….Research using GPS dropwindsondes in the late 1990s and early 2000s has demonstrated that stronger winds exist at the surface in the hurricane eyewall than originally had been believed.
The amount of the increases is summarized below – for PDI which rises as the cube of the wind speed, the impact of these adjstments is even more dramatic.
Excerpt from Landsea et al 2004.
The 1993 Adjustment
Emanuel 2005 spends no time whatever discussing inhomogeneities in the record after 1991. Instead he relies entirely on an inhomogeneity between pre-1970 measurements and 1970-1990 measurements identified in Landsea 1993 to substantially downward adjust pre-1970 measurements, which resulted in much of the rhetorical impact of his graphics (to the extent that they could be replicated – and I’m still in the process of implementing this adjustment. ) Landsea 1993 observed an empirical difference between wind speed estimation before 1970 and from 1970-1991, which Emanuel 2005 (SI) described as follows:
For the first decade or so of airborne reconnaissance, surface winds were estimated mostly by visual inspection of the sea surface. Beginning in the early 1950s, radar altimeters aboard the aircraft made possible an accurate determination of the aircraft’s absolute altitude. When combined with direct pressure measurements, this gives a good estimate of geopotential height at flight level. Surface pressure can then be estimated using empirical relationships between surface and flight level pressure. This technique, developed during the 1950s, was used without significant modification through the end of aircraft reconnaissance in the western North Pacific and until the advent of accurate dropwindsondes in the North Atlantic. Minimum surface pressure estimates were converted to maximum sustained surface wind using semi-empirical wind-pressure relations which, however, have evolved with time. For the North Atlantic, Landsea 3 has documented a change in that took place in 1970, leading to lower wind speed estimates.
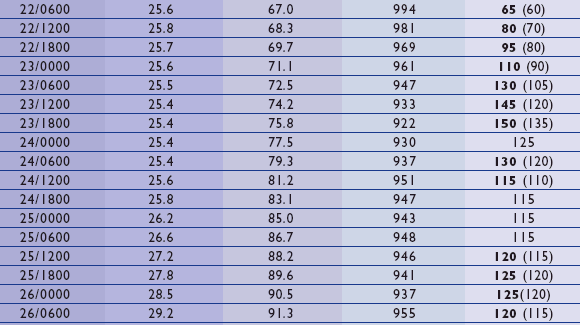
Landsea 1993 provided the following table, which he used only to improve homogeneity in hurricane counts by defining 54 m sec-1 as the hurdle for counting in the early part of the series and 51 m sec-1 in the later part of the series.

From Landsea 1993
I’ve plotted the information from this table is plotted below with the earlier measurement method (vertical) and later measurement method (horizontal). To these 7 points, Emanuel 2000 fitted a slightly convex curve through the formula . The dashed red line shows a simple linear fit. The dashed black line shows the 45 degree line. If one takes Emanuel’s most recent comments at face value, this graph could equally stand for an increase in estimates for the period 1970-1990 rather than a reduction for the pre-1970 period. In his Comment on Emanuel, Landsea observed that this adjustment reached as high as 12 m sec-1 at higher speeds – a result not contemplated in the original article.
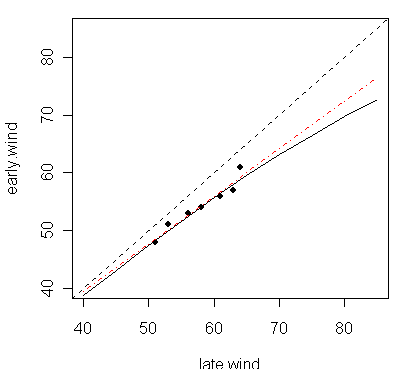
Plot of Table from Landsea 1993, showing Emanuel polynomial fit.
While Landsea’s Comment on Emanuel refers to the problem of post-1990 inhomogeneity in clear terms, he spends more time on the issue of how Emanuel implemented the pre-1970 adjustment, saying – and the above figure is helpful in understanding this:
He attempts to use a bias-removal scheme (Landsea, 1993) that recommends reduction of the tropical-cyclone winds by 2.5–5.0 m s^-1 for the 1940s–60s because of an inconsistency in the pressure–wind relationship during those years compared with subsequent (and presumably more accurate) data. However, the function used by Emanuel to reduce the winds in the earlier period goes well beyond this recommendation, as the bias removal used continued to increase with increasing wind intensity and reached a reduction of as much as 12.2ms^-1 for the strongest hurricane in the 1949–69 original data set.
Landsea then presented an alternative implementation of the pre-1970 adjustment (see below) – which is entirely inconsistent with his caveats about post-1990 inhomogeneity. To implement these comments, one should upward adjust the 1970-1990 values using the Landsea 1993 formula (for example) as means of achieving homogeneity in this period.
LAndsea 2005 Figure 1 | Derivation of Atlantic power-dissipation index (PDI). b, Three versions of the smoothed PDI for the North Atlantic using: dashed line, Emanuel’s applied bias-removal scheme; dotted line, 1993 version3 of the bias-removal scheme; solid line, original hurricane database. All three versions are identical from 1970 onwards.
This implementation is inconsistent with the following observation in Landsea’s Comment:
In major hurricanes, winds are substantially stronger at the ocean’s surface [Franklin et al Weath. Forecast.2003; Dunion et al Mon. Weath. Rev. 2003; Kepert & Wang, J. Atmos. Sci. 2001; Kepert. J. Atmos. Sci. 2001] than was previously realized, so it is no longer clear that Atlantic tropical cyclones of the 1940s–60s call for a sizeable systematic reduction in their wind speeds. It is now understood to be physically reasonable that the intensity of hurricanes in the 1970s through to the early 1990s was underestimated, rather than the 1940s and 1960s being overestimated. To examine changes in intensity over time, it is therefore better to use the original hurricane database than to apply a general adjustment to the data in an attempt to make it homogenous.
Accordingly, as a replication exercise, the calculations that I’ve done so far are reasonable implementations of Landsea’s most recent position on adjustments for the pre-1970 period – but should be adjusted upwards in the 1970-1990 period. I’ll re-do these calculations both ways now that I’ve more or less figured out how to implement the 1993 adjustment.
All authors seem to agree that the data set is in need of repair. Because the post-1970 hurricane period was quiet in the Atlantic, it doesn’t make any sense to discard prior data. However it does make sense to use it sensibly. In my opinion, the most urgent requirement is meta-data – how each particular track was calculated: documentary, airplane, oblique Dvorak, overhead Dvorak, … whatever the relevant information is. Without replicable meta-data, these hurricane calculations may be, in Judith’s terminology, a pissing contest, but the contestants seem to be pissing into the wind. If the wind speeds exceed 18 m sec-1, it’s not clear how the contest is won, but the impact on the contestants is easily predicted.


50 Comments
Steve, this is a good summary. A few comments:
Re your statement:
They go on to say:
Ongoing Dvorak reanalyses of satellite images in the Eastern Hemisphere basins by the third author suggest that there are at least 70 additional, previously unrecognized category 4 and 5 cyclones during the period 1978–1990. The pre-1990 tropical cyclone data for all basins are replete with large uncertainties, gaps, and biases.
This socalled reanalysis referred to by Landsea is extremely subjective and lacking any credibility IMO. This is not to say that the data isn’t bad, its just that this “reanalysis” is totally lacking in credibility.
The Dvorak technique was summarized in the latest edition of BAMS by Chris Velden et al. (I posted previously on this). Application of the Dvorak technique is incredibly subjective, and I am not very happy about a certain individual doing this “reprocessing” who already seems to know the answer. Jim Kossin has attempted a method of objectivizing/automating the Dvorak technique to take the subjectivity out of it, and has also applied it to the global satellite data set since 1983. These papers are under review. Kossin’s work will not be the last work on the data issue, but it will probably be the first important one. Kossin is attempting to go back to 1977 in reprocessing the satellite data; prior to that may be impossible or very difficult.
Steve, another anecdote re Hurricane Andrew. This is still hotly debated in the literature, but scientists with voting rights on the HURDAT Best Tracks Committee (consisting only of NHC scientists) voted in a certain away, with an “outside” scientist being the lone contrarian (nonvoting of course). This does not inspire confidence in the best tracks process. A site exploring alternative ways of assessing intensity is at
http://www.aoml.noaa.gov/hrd/data_sub/wind.html
If people are going to make decisions based on these analyses – and it seems that they are – and there are subjective aspects, then then the raw information should be archived so the decisions can be replicated. If the decision is based on an oblique Dvorak image, then the image should be archived together with a file stating the logic.
This is a fundamental ethic of good research practice. It allows even flawed studies to have future value since different adjustments/assumptions can be made. Fundamental ethics are not always followed though.
Hmmm… some robust statistical analysis might be useful here … I’d like to ask all you hurricane experts, is there anything with respect to these storm winds (the “true” values) that one expects (mainly on physical grounds) to be rather invariant even under changing conditions? What I’m thinking is something like median wind speed of all storms during a hurricane season.
RE#5 Webster et al (see Figure 4) found that, globally averaged, the reported median wind speed of hurricanes globally stays about the same over time. Small variation year-to-year. There has been no upward trend.
Also, globally averaged, the count of tropical cyclones (storms, hurricanes) stays about the same year-after-year. There has been no upward trend.
Judith co-wrote Webster et al, so she’d be the person to ask about any details.
re #6: Ok, good enough. Let’s assume that the median wind speed over Atlantic stays the same over the time. Then I propose the following scheme for adjusting that wind speed record. I have not tried this on any real hurricane etc. data, and I’m only basing it on my intuition based on IMO similar problems I’ve worked with. So I hope someone would try it, and we’ll maybe immediatily see that my intuition is full of **** 🙂
So here we go:
1) Estimate the median wind speed over the record which is considered extremely reliable. Judging from Steve’s text, this would be something like post 1998 period.
2) Calculate the yearly medians for the full record.
3) Work backwards with the record: substract the median of the next year from all raw wind speeds within a year. E.g. from all wind speed estimates in year 1978 substract the median of 1979. This should change the record from reflecting the absolute measured values to reflecting the relative values with respect to median of the next year. The idea here is similar to that actually now used in instrumental temperature series known us the “first difference method”, see
T.C. Petersen et al., First difference method: Maximizing station density for the calculation of long-term global temperature change, JGR, Vol. 103, No. D20, PAGES 25,967–25,974, 1998.
That is, without them realizing it, actually a simple version of an idea used in, e.g., communications engineering for decades, but that’s another story. Anyhow the fundamental idea here is that the error in the (old) estimates is in the absolute value (they are under/overestimated) but the relative wind speeds of the storms within the same year are more or less accurately recorded. Moreover, the errors is two consecutive years are similar.
4) Add to these relative wind speed estimates the “true” wind speed median from step 1).
We are done. This procedure should take care of also any previous (possibly wrong) homogenous adjustments done to the record.
I’m anxiously waiting for the comments 🙂
Have you tried overlaying sunspot cycles with “LAndsea 2005 Figure 1 | Derivation of Atlantic power-dissipation index (PDI). b” from above? At first glance there seems to be a direct relationship.
This is the annual median of the median storm wind speed in m sec-1 in the Atlantic. The peak is in 1917.
An additional inhomogeneity that complicates the utility of the median is that low-speed depressions and small storms appear to get more comprehensively covered in the record.
Jean S. Another method would be proportional adjustments ie. you could scale the prior values by the ratio of the two medians. There might be reasons to suppose that the storms with stronger winds are under-estimated by more than the ones with weaker winds. Could we use information about the estimation methods to distinguish the two cases? In the other application you mention, I sure would have thought that an urban heat island effect, for example, would change over time so a proportional adjustment might make more sense than absolute adjustments.
re #9: Thanks, Steve. That’s something like what I was expecting … in the early years many of the storms are actually missed and only strongest ones detected I suppose. The difference scheme in #7 is supposed to take care some of that, although I suppose there is really nothing one can do to get a reliable record, to say, pre 1950’s (before “airplane series”).
Here is a plot of the annual median of the minumum for each storm – this time in the native units KNOTS (and not m sec). You can see the impact of round numbers.
I don’t think that the median adjustment will work with these hurricane distributions which are way out on the tails of extreme-value energy distributions with big year-to-year variations.
re #10: Peter, I think it should be possible to do that (distinguish between the “two cases”) but it depends so much from the underlying phenomenon. If I were paid for doing this, I would likely try to identify some invariant features of the yearly data using, e.g., order statistics, and use then that information to adjust the record. That might actually offer a way to estimate how many/how strong hurricanes/storms were totally missed during the early years of data.
re #12: Yes, so you can easily argue that many storms we missed before 1930s and that the record is rather good starting around 1970s.
re #13: And why is that? I don’t see the connection between yearly variations, heavy-tailed distributions, and improperness of median adjustment.
Re #6: Re peak wind speed in a given season. We now understand that those data are almost meaningless, owing to those using the Dvorak technique being willing to stray far outside the climatological range of intensities. Re the number of storms, that number is almost certain to be totally accurate (or very close anyways) in the WHCC data set. Actually, the data show a slight decrease in total number of TCs.
Just FYI:
If you trust the data, then probably the big remaining issue is Webster et al’s observation that the global count of severe hurricane (categories 4 and 5) have increased.
Webster used 5-year buckets in its look for trends. Here are the numbers (from eyeballing their chart):
1970-74: 8 severe hurricanes per year, globally
1975-79: 10
1980-84: 10
1985-89: 12
1990-94: 18
1995-99: 16
2000-2004: 16
There was a jump circa 1990, and since then the count has been more-or-less flat.
Perhaps there was an upward trend 1970-84 (from 8 to 12).
Klotzbach makes the point that, if global warming is increasing the global frequency of severe storms, then why haven’t severe storms increased in the last 15 years, a period of considerable warming and improved data quality? Why was the jump circa 1990?
I think that Judith’s position is that 15 years is too short to draw any conclusion. I agree with that, but the 15-year flatline suggests that, if there is a connection between severe hurricanes and global warming, it must involve indirect, lagging phenomena. And no one in this battle has, to my knowledge, proposed a physical mechanism that could explain the indirect, lagging effects of global warming on tropical cyclone intensity.
Bottom line is that a person has to slice and dice the hurricane data to find trends, and that assumes that the data is valid, which it probably is not.
Caveats: the Western Pacific is the Big Daddy of storm coount, and whether it was in an upward phase and downward phase could significantly affect the global severe storm count. I have not looked at that. Also, Klotzbach’s examination went back to circa 1985 and used 10-year buckets instead of 5-year buckets. He found a 10% increase in severe storm count from bucket-to-bucket and no trend in global ACE.)
Re missed NATL storms in the early part of the record. The reason that I think “most” of the storms were captured is described in my testimony, the figure where you plot the 11 yr running mean of number of TCs and SST. On multidecadal time scales, these two curves track in coherent ways, you can see the AMO (positive correlation), 20 yr cycles (negative correlation that switches to positive in 1980, we did the sliding correlation and are still puzzled by this), plus the large trend since 1970 (combo of AMO + AGW, IMO). We are not using circular reasoning here, since we don’t have a theory to explain the variations in the number of storms (only empirical analyses such as Gray’s). Emanuel has also used this argument in stating why he thinks the PDI data are correct, although i think the reasoning gets more circular in his argument since he is saying the PDI data are correct since they track the SST, and then the correlation between PDI and SST leads us to the AGW attribution (something like that).
My argument is based on the physical considerations associated with these coherent variations, I would appreciate a statistical audit on such arguments.
If my arguments and physical understanding of the mulidecadal variability of this time series is correct, we should then be able to devise some statistical tests to assess how many storms might have been missed. For example, near the peak of the 1880 AMO is the year to year variability the same as near the peak of the 1950 AMO, etc.
The bottom line here is that scientists combine data, models, and theory to understand what is going on. Rarely is any one of the three perfect, but we piece things together to test our hypotheses and hopefully the whole ends up being greater than the sum of the parts in terms of scientific understanding
Re #17 David, rather than using the raw counts of NCAT45, you need to scale by the number of total storms. The number of storms decrease in the later part of the period, so there is more of a linear increase once you look at NCAT45/N.
Re #19 This is getting interesting, especially statistically!
First, there is a question: do we look at count, or do we look at percentage? I say both, since trends in storm count matter to those concerned about storm damage and trends in percent are what matter to Webster’s potential intensity hypothesis.
(And it raises a side question: is global warming causing a decrease in global hurricane count (and duration)? But that is beside the point here.)
I accept the need to look at percentages. Here are the percentages (eyeball estimates):
1970-74: 17% of all hurricanes were cat 4 or 5
1975-79: 24%
1980-84: 21
1985-89: 25
1990-94: 35
1995-99: 32
2000-04: 35
For me, it’s like one of those face-or-goblet illusions: looked at one way, I can see a trend, while looked at another way, I see a step-up circa 1990 followed by a flatlining.
Also, I wonder about the statistical problems from dividing a possibly trended database (intense hurricane count) by a possibly trendless database (total hurricane count).
Steve and Willis have full plates, but I wonder if they could look at the Webster database of intense hurricane count and of total hurricane count to see if they can derive meaningful trends or other information from them. This would include combining the two to create a percent. The possible step-change circa 1990 may complicate that analysis.
If they don’t, then the entire civilized world is left to stare at data poured into 5 and 10- year buckets and try to make sense of it all!
#1
Judith,
I spent 2 years at the JTWC on Guam as a Sat Analyst where we used the Dvorak method. While Dvorak’s method does offer a “fair” means of calculating storm intensity, it is a VERY subjective method. I was assigned to the JTWC for only 3 typhoon seasons, and before I transfered I made a suggestion to my CO that they hire civilians to long term contracts for this job, as it takes a minimum of 4-6 seasons to get the hang of it. Dvorak’s method is best used when air recon is unavailable; there were many times where our calculations had to be adjusted significantly when dropsonde data or surface data became available.
For a research scientist to come in and after the fact and readjust storm intensities based ONLY ON HIS reanalysis of old sat data IMHO invites a lot of mischief. If readjustments were made based on land, sea, bouy or air recon info, then it is warranted; otherwise, the person is guessing. You just don’t become an expert with Dvorak overnight.
It would be nice if the WMO, or the UN would fund for the deployment of buoys along those areas where Pacific and Atlantic TS form and intensify. While there would still be plenty of holes, it would be much better than what we have now- which is very little.
JPK, thank you much for your insights, I am very worried that any reanalysis invites a lot of mischief. One of the “reanalyzers” posted on RC under the thread on my BAMS articles, and his postings and behavior did not inspire confidence. If nothing else, a plethora of “reanalyses” will help us assess the uncertainty in the data associated with subjectivity in the analyst.
Of relevance to this thread, an upcoming AMS Seminar on hurricanes and global warming featuring J. Kossin, G. Holland, T. Wigley, and T. Delworth.
Here is G. Holland’s abstract:
http://www.ametsoc.org/atmospolicy/EnvironmentalScienceSeminarSeries.html
“Hurricane variations in the North Atlantic region contain a mix of short and long-term variability superimposed on a distinct trend. The short term variability arises from interannual changes associated with large-scale circulation changes, such as the El Nino. Long-period variations in named storms and hurricanes over the past century are distinguished by relatively stable regimes separated by sharp transitions in the 1930s and 1990s. Each regime has seen 50% more cyclones and hurricanes than the previous one and each is closely associated with a distinct increase in eastern Atlantic sea surface temperatures. These sharp changes cannot be attributed to errors in the hurricane data base. The end result has been a substantial, 100-year trend leading to related increases of over 0.7oC in SST and over 100% in tropical cyclone and hurricane numbers. Superimposed on the evolving tropical cyclone and hurricane climatology is a completely independent variation in the proportions of major and minor hurricanes (compared to all named storms). This has no distinguishable net trend, is associated with concomitant variations in the proportion of tropical and subtropical hurricane developments, and may arise largely from internal oscillations of the climate system. The period of enhanced major hurricane activity during 1945-1964 arose entirely from this oscillation. However, while there is no trend in the proportion of major hurricanes, the increasing cyclone numbers has lead to a distinct trend in the number of major hurricanes. Other presentations will show that the change in ocean temperatures is largely due to greenhouse warming, which leads us the compelling conclusion that the overall trend in named storms, hurricanes and major hurricanes is also substantially influenced by greenhouse warming.”
Re #23 My head is spinning again.
Holland uses 100 years worth of hurricane data and finds:
1. The count of tropical cyclones (tropical storms + hurricanes) is increasing and has doubled over the last 100 years.
2. The percentage that are major has not changed
Webster found that:
1. The count of tropical cyclones has been more or less constant (in the last 35 years)
2. The percentage of major hurricanes has increased.
Also, they establish that the SST rise is largely due to CO2.
This should be good reading.
Re #24 Holland’s new talk, I believe, is only on NATL storms (not global). In contrast to the global study of WHCC, where there is no change (even a slight decrease) in number of storms, in the NATL there is a substantial increase in the number of storms. I discussed this in my testimony.
Re: 22
Judith,
Well said! From my own experience, this is only one of many areas in science where analyst subjectivity plays a role.
RE 3@% Good, thank you! My mistake. My head has stopped spinning and is just bobbing a bit.
I think that (study of NATL-only) would seem to say that the NATL has behaved differently from the rest of the world. Interesting.
Re #22
Judith, I’m curious. Do you have a link handy?
This one, perhaps?
(Searching for “reanalyze” in the search box at the top of the RC main page finds only a handful of posts, all but one in the hurricane thread)
Was there enough science there to comment on?
Re 23:
If Sea Surface Temperatures determine the number of tropical cyclones and hurricanes in the Atlantic and there is an SST below which no tropical cyclones and hurricanes develop (else there would be storms year around) then perhaps we should be concentrating on the tails of the season. If the SST is 0.7 degrees C warmer then it is reasonable to expect that SST would rise to its magic storm-friendly number earlier and stay in range later in the season.
Unfortunately Landsea, Gray, Mielke and Berry shot that theory down in 1994.(Figure) Sort of.
More re 23:
From the Kossin’t abstract (same meeting as the Holland abstract): “Unfortunately, the historical records of global hurricane activity suffer from a number of inconsistencies that make them less-than-perfect for [analysis], and they are particularly ill-suited for identifying long-term trends.”
Taken together we have a startling long term trend (doubling of storms) evidenced by bad data.
And Kossin concludes, “our results challenge the paradigm that increasing SST alone will cause a concomitant increase in hurricane activity, and underscore the need for research toward better physical understanding of the relationship between climate and hurricane activity.”
If the basic data set has such high degree of subjectivity, what is the point of doing statistics or comparisons on it at all? No reasonable person would attempt to estimate the history of insolation by statistically examining people’s diary entries for comments about how sunny each day was.
re: #31
This is a good point, but one where mistakes can be made both ways. It’s certainly true that we can’t count on measurement errors dropping out automatically when we average large numbers of observations. But we also can’t assume that they won’t drop out.
I’ve engaged in seemingly endless arguments with people elsewhere who claimed that you can never do better than the error in the least accurate measurements you make, but that’s wrong statistically. OTOH, there is likely bias in any set of measurements, and perhaps other sorts of systematic errors as well. The point is that hard work is needed to be certain that your measurement errors will cancel to whatever degree you need to get the results you want. And part of that work should be a proper audit of the past measurement systems you want to use. This is what bugs me and most AGW skeptics about the failure for the crown jewel of GW, as it were, the surface temperature measurements to be properly audited. Until Jones, et. al. give in and allow their results to be openly audited, many of us will just not believe the surface temperatures being given out. But I’m getting somewhat off-topic for this thread, so I’ll stop with that.
re #29: the comments were by Karl Hoarau, coauthor on the landsea paper. Given the subjectivity of the Dvorak analysis procedure, the nature and tone of Hoarau’s comments (many of which were apparently censored by Gavin) are of concern to me.
Re #30 Kossin’s reanalysis is for the period 1983-2005, this covers only a fraction of the period of interest. Kossin’s reanalysis will help us assess the uncertainty in the more recent obs (I suspect that the community will not be prepared to accept his analysis as the final word on this, we will see).
#33. At least Gavin let Hoarau reply. I tried to post comments on a thread criticizing us, which were suppressed totally, even though they were civil and precise.
Re #35: Hoarau was neither civil nor precise. Notwithstanding, the substance of his comments was clear enough.
I lurk on both rc and this site. In most matters, the side the censors is usually wrong.
Judy, Gavin has a very heavy hand on the censor switch, particulary if it is someone that is from the skeptic side that is commenting. Karouo is not a super social skilled person or good at English (as evidenced by his posts). Better to just discount that and consider his points themselves. And I have no clue how good those are. But don’t let the social ineptitude affect the evaluation of science. Be savvy.
23,24: Since storms of all types constitute negative feedback to heating, it makes sense to me that there will be more storms with increased warming, whether it be from CO2 or Solar effects, or both. If more energy is available for storm formation, there will be more storms. Or am I just being too simplistic, again?
Judith, a question on Webster Figure 4, plot A. The plot shows “maximum hurricane wind speed observed globally”. Is that the “highest windspeed of the strongest single storm” or is it the “average of the maximum wind speeds of all hurricanes”? I originally assumed it is an average of all storms, but now I wonder if it refers to just the strongest single storm per season.
Thanks
William Gray has a comment on Emanuel 2005 online here in which he states that Emanuel’s PAcific results occur entirely because of inhomogeneity between Dvorak measurements after 1986 and Emanuel’s adjustments, which ignore that inhomogeneity, but make a huge adjustment to pre-1974 data. I’ll post more on this. Nautre rejected the comment, but it would have been very interesting to see exactly what Emanuel’s reply would have been.
#38: it’s not the absolute temperature but the temperature difference between latitudes that cause storms. A better simplistic proxy for storm strength would be the temperature difference between the equator and the poles.
There is also the gradient from the sea surface to the upper atmosphere. Note also that we are not talking about a simple convection problem, but of a very peculiar type of fluid dynamics phenomenon. Heat will get transferred regardless. The question is what makes storms.
#40
Surprisingly few researchers appreciate how serious and pervasive this problem is with respect to nearly all environmental data. It is the nightmare that haunts late nights for environmental statisticians.
Any time one changes how one collects data (the instruments, time of sampling, location of sampling, sampling protocols, analytical techniques, calibration methods), one introduces a new signal into the time series. This is a simple fact. It is usually the case, though not always, that from some perspective the new approach is “an improvement” (i.e. lower bias or variance; it is seldom that simple). What it always does is to change the correspondence between the observations and the real system. This can wreak havoc on subsequent trend tests.
Every scientist who has conducted multiple large-scale longitudinal trend studies (the ones I know, anyway) has encountered this problem at one time or another. An amazing number of manuscripts and articles reporting “environmental trends” — some published in Science and Nature — have had to be formally retracted (or informally retracted; i.e. without embarrassing the authors).
Most of the statisticians I know who work on these things are truly paranoid about the labs and technicians whose well-intentioned efforts to “fix” things — often without carefully documenting the changes — make reliable detection and attribution of trends nearly impossible.
As a result, most serious statisticians are highly skeptical about reported trends, a fortiori about attributing trends to causal factors.
What I always hope for is a really strong signal that overwhelms the noise — e.g. the reduction in “acid rain” (sulfate deposition) that began in the U.S. in the 1980s. However, statisticians are rarely so lucky. It is a competitive world, and many researchers feel pressured to publish with a computed p-value of 4.9% — a “significant” discovery! — which often reflects nothing more than a change in lab procedure. Ouch!
“Publish in haste! Retract at leisure.”
Or in climate science, “publish in haste, censor all counterarguments, demonize your critics, never apologize”
RE: #45 – “We’ve…. would everyone please say it with me now ….. MOVED ON!” LOL …. 😉
Steve M. Great analysis! Alas, Gray’s comments seem to blow my idea on storms as a feedback/heat pump. Still seems logical, though.
Re #42, Chris H, thanks for your post. You say:
The Arctic temperatures went up in 1976-78, as a result of the PDO. However, their is no corresponding decrease in storms …
w.
RE : 21
Thanks for the great discussion on this forum.
I have a question for JPK. On which basis did you make at JTWC a comparison between the Dvorak intensity estimate and the recon data for a given typhoon before 1987 ?
Lenni
Dr.Curry,
I appreciated your great comments.
One thing is just intringuing me. Why the strongest TC intensity (Fig 4 on your original study)would not increase while the Cat 4 and 5 cyclones number would double ?
And what are your comments about the Michael and al.(2006) paper showing that the SST threshold for the very intense cyclones is around 28C/28.5C. And above these figures, the cyclones intensity are more sensitive to a change in the environment than a change in the SST.
This would suggest that a light increase of 0.3C/0.4C for the SST cannot explain a significant increase in the number of the Cat 4 and 5 cyclones.
Thanks for your answer.
Lenni