By far, the most important issue in Emanuel 2005 is Emanuel’s adjustments to West Pacific hurricane wind speeds. I’ve reached this conclusion after expenditure of a considerable amount of time and effort, including looking at every Annual Report of the Joint Typhoon Warning Council from 1959-2003.
After doing this, I stumbled on a Comment by William Gray, which was rejected by Nature – which states the problems with the Pacific adjustments in very clear terms. While Gray’s Comment could be and should be pruned, Nature has distorted the record once again by failing to publish a comment that was actually more pertinent than the comments by Pielke and Landsea, both of which were also meritorious.
Although Emanuel’s Pacific adjustments were new, they were not mentioned in the body of Emanuel 2005, although they were described in the Supplementary Information – which might not even have been considered by reviewers. Emanuel himself has added a link at his website to Cleartheair.org, which has developed a sensationalistic graphic of his results.
It took me longer to find the pea under the thimble than it should have. The debate over Emanuel 2005 has focused on Atlantic hurricanes – in part because these are discussed in the accepted Pielke and Landsea comments. But because the number of Atlantic hurricanes is much smaller than the number of Pacific hurricanes, the totals are dominated by Pacific hurricanes and adjustment issues for Atlantic hurricanes, while interesting, are a much less important issue in the calculation of the total.
Without analyzing the article quite carefully, a reader could obtain the impression that the Atlantic adjustments, discussed in the Landsea article, were the adjustments applicable to Pacific typhoons as well – Judith Curry, for example, missed the distinction as noted in one of the threads. But the Pacific adjustments are quite different. In the Atlantic Basin, Emanuel drew on Landsea 1993 for authority, but for the Pacific made his own adjustments. So the following graphic is really the one that carries the water in Emanuel 2005:

From Emanuel 2005.
The Underlying Data
Jordan and Ho, 1962 online here have an interesting discussion of Pacific cyclones prior to 1962.
The Joint Typhoon Warning Center maintains a large archive with annual reports from 1959-2003 including information on every typhoon and tropical storm. Annual Cyclone Reports Best Tracks . Here is a figure from their 2004 report showing the "trend" of cyclone numbers in the West Pacific – a result obviously at odds with Emanuel. This is not a graph by "stooges", but by the organization that has developed all of the relevant data.
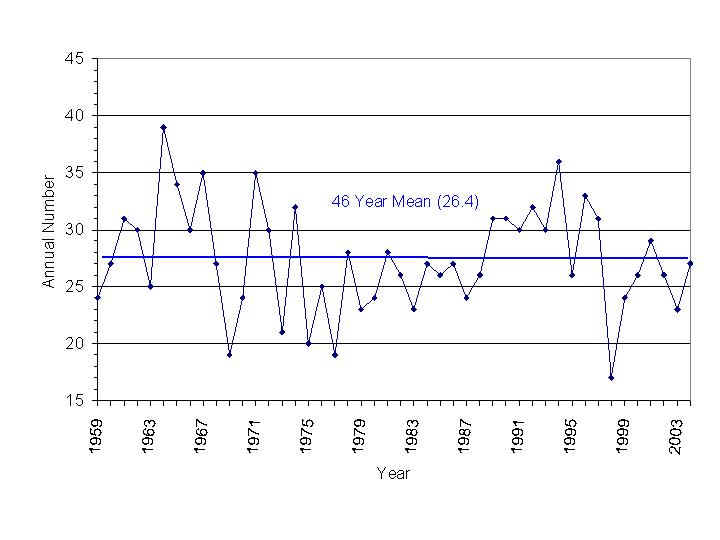
JWTC 2004 Annural Report Figure 1-2. Tropical cyclones of tropical storm or greater intensity in the western North Pacific (1959-2004).
The Pacific wind-speed measurement methods are not homogeneous. I’ll summarize the three main stages in W Pacific hurricane speed measurement, as I presently understand them.
Briefly:
(1) up to 1974, wind speeds were estimated from airplane reconnaissance primarily with an early pressure-wind relationship;
(2) from 1974-1986, wind speeds were estimated from airplane reconnaissance using the pressure-wind relationship of Atkinson and Holliday (1977), resulting in lower wind speeds;
(3) after 1986, when airplane reconnaissance was discontinued in the W Pacific, pressures and winds were estimated from Dvorak-method interpretation of satellite imagery.
Emanuel stated that wind-speeds in the early period were estimated according to the following equation:

Emanuel does not provide any authority for this. A variation of the above equation is discussed in Fletcher and Johannesen 1965, citing Fletcher 1955 and Jordan 1958 for the earlier equation.
The impression that I obtained from the data and literature is that the Fletcher-Jordan equation was an attempt to summarize the data, but was not itself used to generate the wind estimates from pressure information. Fletcher and Johannesen 1965 was written at the time of introducing a new type of airplane reconnaissance using WB-47 instead of WB-50 aircraft, with the new aircraft no longer stressed to penetrate hurricanes at 700 mb.
Previously the reports all included estimates of 700 mb height, which appear to be linked directly to estimates of pressure. Shortly thereafter, the 700 mb heights ceased to be published. I presume that 700 mb heights ceased to measured by WB-47 aircraft – introducing another inhomogeneity into the record, which has not been discussed elsewhere.
There’s a very interesting re-statement of the early data in a recent article by Lander et al, in which they attempt to place the 2002 Pongsona typhoon in the context of wind-pressure measurements prior to the introduction of the Atkinson-Holliday method as shown in the graphic below. The red line shows the Atkinson-Holliday relationship. So presumably Lander et al didn’t think that the early airplane measurements needed to be re-stated a la Emanuel.

From Lander et al. Figure 4. Figure 4. Relationship between maximum sustained wind and minimum sea-level pressure, where “b” values indicate theoretical limits of the relationship. Dots are actual aircraft reports for 1960’s and 1970’s prior to JTWC’s use of the Atkinson-Holliday (1974) wind-pressure relationship (dashed line). Dotted line is the best-fit solution that provides the value used for Pongsona in this assessment.
The Atkinson-Holliday Relationship
In 1974, the following relationship between wind speed and pressure was introduced, being mentioned in the 1974 JWTC Annual Cyclone Report.

Emanuel doesn’t mention either Atkinson-Holliday or the 1974 Annual Cyclone Report, but reports in his SI that a new relationship was introduced – supposedly in 1973. Here is an extended excerpt:
For the first decade or so of airborne reconnaissance, surface winds were estimated mostly by visual inspection of the sea surface. Beginning in the early 1950s, radar altimeters aboard the aircraft made possible an accurate determination of the aircraft’s absolute altitude. When combined with direct pressure measurements, this gives a good estimate of geopotential height at flight level. Surface pressure can then be estimated using empirical relationships between surface and flight level pressure. This technique, developed during the 1950s, was used without significant modification through the end of aircraft reconnaissance in the western North Pacific and until the advent of accurate dropwindsondes in the North Atlantic. Minimum surface pressure estimates were converted to maximum sustained surface wind using semi-empirical wind-pressure relations which, however, have evolved with time.
For the western North Pacific, the wind-pressure relationship used until 1973 was
where in this case
is given in knots and
is the central surface pressure in hPa. In 1973, JTWC adopted a revised wind-pressure relationship given by:
(3)
where
(4)
This yields a substantial reduction in pre-1973 wind speeds, amounting to an average of around 10 ms^à⣃ ’ ”¬’¢1 over the observed range of hurricane-force winds.Although the JTWC best track data does not record estimates of central pressure, the latter was tabulated as part of the Annual Tropical Cyclone Reports available from JTWC. To test whether the wind-pressure relations given by (4) and (5) [SM – should be (2) and (3) ] are indeed valid in the best track data, we tabulated the maximum sustained surface wind and minimum surface pressure for each storm between 1959 and 2003, covering the whole period of time that the Annual Tropical Cyclone Reports are available. This shows that (5) [SM – should be (3) ] is very closely followed in the interval 1973-1987, and maintains exactly thereafter, when the Dvorak method was used to estimate surface winds, while minimum pressure was calculated directly from (5). [SM – should be (3)]
In principle, applying correction (6) [SM – should be (4) ] to the pre-1973 JTWC best track winds should result in their satisfying (5) [SM – (3)] closely, but this does not turn out to be the case.Supplementary Figure 1 shows that while, as expected, the unadjusted winds are much too strong relative to the recorded pressures, the correction introduced by (6) [ SM – (4)] goes too far, and the adjusted winds are somewhat too weak. A better fit is obtained by compromising between the raw winds and the adjusted winds given by (6) [SM- 5?]:
(5)
where
is given by (6) and w is a weight. For the period 1959-1966, a good fit is obtained by choosing w = 0.3 (see Supplementary Figure 1), while for 1967-1972, a better fit is obtained by taking w = 0.8. (The winds during and after 1973 are unadjusted, equivalent to taking w =1.) Having no pressure data before 1959, we use the same adjustment as for the period 1959-1966.
Emanuel illustrated this shift in his Supplementary Figure 1:

Emanuel 2005 Supplementary Figure 1. Scatter plot of storm maximum surface winds (knots) versus minimum surface pressure (hPa) during the period 1959-1966 for the raw JTWC best track data (blue), the winds adjusted using (4) from Supplementary Methods (red), and the winds adjusted using (5) from Supplementary Methods (green). The heavy black curve is the wind-pressure relation given by (3) from Supplementary Methods
The most important aspect of Emanuel’s methodology is the total failure to consider what happens after 1986 when airplane reconnaissance ceased and all information was derived from satellites – introducing inhomogeneity not simply in the wind-pressure equation, but even in the estimation of pressure – which was now done by satellite imagery. Critics of Spencer and Christy would do well to reflect on exactly how hurricane pressures are estimated – since the microwave methodology seems to includes estimates of temperature using satellite imagery in one of its stages.
Gray’s Comments on Emanuel
After I’d spent a lot of time doing this, I stumbled across an online Comment on Emanuel by William Gray, submitted to Nature in 2005 and, needless to say, rejected. Gray seems to be much criticized but his website shows a lengthy list of publications, including relevant publications on estimating hurricane pressure and wind strength using satellite microwave technology – experience which seems to me to be highly relevant to Emanuel 2005, fossilized or otherwise.
Gray states that there is a major inhomogeneity between Dvorak estimation and Atkinson-Holliday estimation, amounting to a estimating difference of approximately 7.5 m/sec (Dvorak higher) and that when this difference is cubed, the bias is multiplied accounting for the entire effect observed by Emanuel. Gray:
The AH [Atkinson-Holliday] scheme was discontinued after 1986 when aircraft reconnaissance in the NW Pacific was terminated, and central pressures could no longer be directly measured. Vmax values have since been obtained solely from satellite. The Dvorak satellite TC intensity scheme (1975, 1984) is known to give systematic higher Vmax estimates than the AH scheme. Knaff and Zehr’s (2005) recent analysis shows that the Dvorak satellite (1975, 1984) scheme for the estimation of Vmax (used in the Pacific since 1987) gives, on average, about 7.5 m/s higher Vmax value than the AH scheme for all wind speed categories. There is no question that the Dvorak scheme is superior to the AH scheme.
The differences between the Dvorak and the AH schemes causes large differences in Vmax. For 7.5 m/s wind differences of 32.5 m/s for Dvorak versus 25 m/s for AH, the cubed ratio of the Dvorak to the AH maximum wind speed is 2.2. For higher Vmax values (say 57.5 vs. 50 m/s) this ratio is 1.5. There are many more TC time periods in Emanuel’s analysis of the lower Vmax values when this ratio of the cubed Vmax of the satellite to the AH is close to 2 to 1.
Most of the large increase in Emanuel’s NW Pacific TC energy dissipation calculations from the early 1970s to the early 2000s can be explained by the cubed differences of the Vmax estimates between the more recent (since 1987) Dvorak pure satellite scheme for Vmax and the earlier (1973-1986) period when the AH aircraft scheme was used. Gray et al. (1991) and Martin and Gray (1993) have discussed the many complications that arise for Vmax determination from utilization of satellite-only versus aircraft-only measurements and when both measurements are available.
Gray is not the only person to comment on inhomogeneity between Dvorak and airplane measurements. Kossin and Yelden, 2004, is entitled "A Pronounced Bias in Tropical Cyclone Minimum Sea Level Pressure Estimation Based on the Dvorak Technique. I haven’t considered it, but it sounds like this should have been specifically considered by Emanuel.
The issue is discussed in further detail in in Knaff and Sampson (2006) online here and Knaff and Zehr (2006), submitted which I have not yet seen. However Knaff and Zehr 2006 is discussed here by Jeff Masters as follows:
Knaff and Zehr (2006) make some convincing arguments that typhoon intensities during the 1973-1986 period were too low due to measurement error, and the number of Category 4 and 5 storms in the region have been roughly constant for the past 50 years. This paper has been accepted for publication in Weather and Forecasting, and will likely be published late this year. Dr. Knaff and Charles Sampson of the Naval Research Laboratory have performed a preliminary re-analysis of maximum typhoon intensities for the period 1966-1987 based on the Knaff and Zehr (2006) results, and this re-analysis will be presented at the upcoming 27th Conference on Hurricanes and Tropical Meteorology (April 24-28, 2006). In the extended abstract, they show that after correcting for the AH technique errors, the number of Category 4 and 5 typhoons during the 1966-1987 period increased by 1.5 per year, leaving only a slight upward trend in Category 4 and 5 typhoons during the period 1970 – 2004.
Masters shows the following graphic:

Masters website Figure 6. Number of Category 4 and 5 hurricanes in the Northwest Pacific Ocean since reliable records began in 1945. Data taken from the Joint Typhoon Warning Center "best track" database. Typhoon intensities from the period 1973 – 1986 were estimated using the "Atkinson-Holliday" (AH) technique, which may have underestimated typhoon intensity.
I think that Gray’s arguments should be appraised on their merits – rather than according to whether Nature published them. At a minimum, to an outsider who has happened to have browsed all of the JWTC Annual Reports from 1959-2003, they seem highly plausible and merit a reply. Perhaps the issue will get into discussion as a result of Knaff and Zehr.
Emanuel’s Website
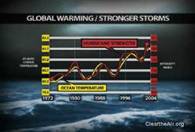
While doing this, I revisited Emanuel’s website. He links to ClearTheAir.org, which has publicized his work and displays the following image

linking in turn to an animated graphic illustrating Emanuel’s graphic.
This chart is based on the dataset from my 2005 Nature paper and updated with two additional years of data. To produce the chart, the temperature index was converted to Fahrenheit. The chart was produced by Clear the Air. For high-resolution non-watermarked versions, download from ftp://70.86.53.74. User: ClearTheAir. Password: hurricane. http://www.cleartheair.org/hurricanes.vtml
While Emanuel was quick to update this graphic to incorporate 2005 data, it will be interesting to see if the graphic is equally quickly updated to include low 2006 Atlantic hurricane results.
References:
Atkinson, G.D. and C.R. Holliday, 1977: Tropical cyclone minimum sea level pressure/maximum sustained wind relationship for the western North Pacific. Mon. Wea. Rev., 105, 421-427.
Emanuel webpage http://wind.mit.edu/~emanuel/anthro2.htm
http://wind.mit.edu/~emanuel/Papers_data_graphics.htm ttp://wind.mit.edu/~emanuel/Hurrgraphwatermarked.wmv
Emaneul 2005 SI http://www.nature.com/nature/journal/v436/n7051/suppinfo/nature03906.html
Fletcher, R.D. 1955, Comparison of maximum surface winds in hurricanes, BAMS 36, 242-250.
Fletcher and Johannesen, 1965. MWR. http://ams.allenpress.com/archive/1520-0450/4/4/pdf/i1520-0450-4-4-457.pdf
Gray, William M., 2005, Comments on: “Increasing destructiveness of tropical cyclones over the past 30 years” by Kerry Emanuel, Nature, 31 July 2005, Vol. 436, pp. 686-688 http://arxiv.org/ftp/physics/papers/0601/0601050.pdf
Gray, William. Website http://typhoon.atmos.colostate.edu/Includes/Documents/Publications.html
Jordan and Ho, 1962. VARIATIONS IN THE ANNUAL FREQUENCY OF TROPICAL CYCLONES, 1886–1958 Monthly Weather Review Volume 90, Issue 4 (April 1962) pp. 157–164
Click to access mwr-090-04-0157.pdf
Jordan, CL 1958. Estimation of surface central pressure in tropical cyclones from aircraft observations. BAMS 39, 345-352.
John A. Knaff and Charles R. Sampson, 2006 , REANALYSIS OF WEST PACIFIC TROPICAL CYCLONE MAXIMUM INTENSITY 1966-1987, http://ams.confex.com/ams/pdfpapers/108298.pdf
Knaff and Zehr 2006..
JAMES P. KOSSIN AND CHRISTOPHER S. VELDEN, 2004. A Pronounced Bias in Tropical Cyclone Minimum Sea Level Pressure Estimation Based on the Dvorak Technique Mon We Rev. http://www.ssec.wisc.edu/~kossin/articles/kossin_velden_MWR.pdf
Mark A. Lander, Charles P. Guard, Arthur N.L. Chiu, METEOROLOGICAL ASSESSMENT FOR SUPER TYPHOON PONGSONA AT LANDFALL ON GUAM — DECEMBER 8, 2002. http://ams.confex.com/ams/pdfpapers/75323.pdf


108 Comments
Steve, you stud. Going to look at the yearly reports. Very commendable.
And just when you thought the hurricane threads were waning … LOL
If you’re a warmer and you don’t see a rising trend in your noisy data, then what you need to do is wait a or two, then bin-and-pin.
That sure doesn’t look like a dry science/stats site, Jude. Pretty flashy…
Steve M, if you’ve got the Pacific data, let’s ram it through the Atlantic R script to check the magnitude of the bin-and-pin effects. The only reason I focused on Atlantic is because we had the data handy, thanks only to Willis’s legwork. (I like analysing data but I can’t stand trolling the www junkheap.)
Re: #2
I think Steve M has once again done a commendable audit on Emanuel 2005 and found closeted items that all of us, including our part time recognized expert in this field and consulting climatologist, Dr. Curry, had missed.
I have learned over the past few weeks, however, that we must not be too quick to judge a paper as there is the stooge factor of those doing the critiquing that must first be evaluated. God, I miss her already.
She’ll come back. She has too much too learn from us. Lurking without asking questions limits your rate and depth of learning.
I like her. She is very motherly protective of the gentle flower students, too timid to handle the blood sport of open combat on the floor of the arena!
She has thick skin.
The brave show their mettle more brightly in contrast to the craven.
Come, ye gentle flowers, with gifts of long data strings from the tropical Pacific.
Re: #8
That could be the message for the GT students, but I suspect that all of the imagery that we put forth here has little to do with the real situation with the GT students. Visualize a Dr Curry who has honed the intellectual skills of her students to do battle with the skeptics (and stooges) but she now has only tentative control of their being unleashed on CA and finally they arrive and appear to disarm this crowd. Suddenly Steve M arrives on the scene not as a skeptic but as someone who through intelligent and diligent auditing shows by example what students can do in the pursuit of truth. And the students proclaim this is good and this is natural.
RE: Northwest Pacific Category 4 and 5 Typhoons figure
It’s certainly consistent with a constant number of typhoons per year for the last 50 years, a Poisson process with a mean of about 6. However, the period from 1973-1986 is just the sort of thing you would expect. On average you would expect the count to be below 6 half the time, and above 6 the other half. In other words, this is just like a 50:50 coin flip which is well known to have runs of heads or tails, or in this case, a run of years with low (or high!) typhoon count.
These guys need a real education in probability and statistics.
Funny, I was just thinking of coin-tossing and the unlikely probablity of six heads turning up consecutively (~0.015) … wondering what it would take for Ken to believe that the Bears winning streak is a bona fide super bowl trend. Wondering what his Bayesian priors were coming in to the season. Wondering how many hurricane warmers are not betting on the Bears. And what proportion because they think sports team performances are more variable than hurricane counts vs. those just in denial about natural climate variability vs. the bin-and-pin crowd – always out to spin a loss into a win.
Re 15 ???
I just read through this post, and I am a bit embarrassed to say I could not find anything wrong with it except that it discredits the work of a really smart guy. This bothers me. Am I missing something? Has anyone found a flaw in SteveM’s analysis?
Hey, you’re scrutinizing anti-AGW work, TAC! Get ‘im, boys.
Steve-
To some degree this subject has been discussed in the literature. You will want to have a close look at this exchange between Johnny Chan and Webster et al. on the NW Pacific data, which was also used by Webster et al. in additional to Emanuel:
Chan:
“Analyses of tropical cyclone records from the western North Pacific reveal that the recent increase in occurrence of intense typhoons reported by Webster et al. (Reports, 16 Sep. 2005, p. 1844) is not a trend. Rather, it is likely a part of the large interdecadal variations in the number of intense typhoons related to similar temporal fluctuations in the atmospheric environment.”
Full text:
http://www.sciencemag.org/cgi/content/full/sci;311/5768/1713b
Webster et al.:
“Although Chan makes several valid points, his analysis confuses relationships associated with the long-term variations with those associated with shorter term variability (interannual and decadal). We present an analysis that clarifies the observations from the western North Pacific.”
Full text:
http://www.sciencemag.org/cgi/content/full/sci;311/5768/1713c
I just read William Gray’s unpublished comment on Emanuel [2005]. It is amazing. Gray’s comment is lucid and compelling. It responds to the details of Emanuel’s paper, and points to fatal flaws (I do not know this field, and there may be something else going on here, but it is hard to see how Gray’s comments (and SteveM’s, for that matter), taken at face value, could be interpreted otherwise).
Whatever your opinion on AGW, if you are interested in the hurricane/SST issue, IMHO you should take some time and read Gray’s comment.
As with the case of the recently concluded Atlantic season, the degree of recurving, and the point of its onset, is a major factor determining likelihood of landfall. In the poorly instrument, underobserved NW Pacific, any storm that does not make landfall might be misreported or undereported. Past periods featuring early and strong recurving might show up as “fewer” high intensity storms, ones like this year where they seemed to be “attracted” to Fujian and Guangdong might show up as “more” high intensity storms. Look at the media frenzy about this year’s storms.
Instrument s/b instrumented … need ….. coffee ….. must …. get …. coffee …. 😉
1991 lot of them hit Japan. I was there for one of them ….
#18 Roger, please help me out. I do not know how to interpret your comment. Were you LOL when you quoted Webster:
To put it differently, does this statement communicate something meaningful to you, aside from a sense that the author is hopelessly confused?
This is not a trick question. I really do want to know the answer.
Roger, I don’t see anything in Chan’s paper or Webster’s response that pertains to Emanuel’s adjustment of the Pacific data or the homogeneity of the resulting series – which IMHO is the key issue in Emanuel 2005 (no doubt Webster et al has issues of its own.) Gray’s rejected Comment is the only thing that I’ve seen that touches on the matter in a precise way. The record has been distorted by the rejection of this Comment. If there’s a response to Gray’s allegations of non-homogeneity, then that should be on the record as well. Actually, Emanuel should have dealt with it in the first place – the non-homogeneity between instrumental and Dvorak estimates was in the literature; he turned his mind to non-homogeneity in the older airplane series; he had an obligation to deal with the later inhomogeneity.
Steve- Well, that is the point.
These studies use the same datasets. You might also take a look at these two references as well:
Click to access 107845.pdf
And Landsea et al. 2006
http://www.sciencemag.org/cgi/content/full/313/5786/452
“Operational changes at the various tropical cyclone warning centers probably also contributed to discontinuities in tropical cyclone intensity estimates and to more frequent identification of extreme tropical cyclones (along with a shift to stronger maximum sustained surface wind in general) by 1990. These operational changes include (13-17) the advent of advanced analysis and display systems for visualizing satellite images, changes in the pressure-wind relationships used for wind estimation from observed pressures, relocation of some tropical cyclone warning centers, termination of aircraft reconnaissance in the Northwest Pacific in August 1987, and the establishment of specialized tropical cyclone warning centers.”
Given the various, and admitted, uncertainties in the datasets I am surprised that no one has yet redone and clearly presented the complete Emanuel (and Webster et al.) analyses considering these uncertainties. You do have a good start here.
The Lander paper that you cited is very interesting. I noticed their comments on Typhoon Pongsona above and found it intriguing that they seemed to use measurements from the 1950s and 1960s at face value without adjusting them downwards a la Emanuel.
On the semantic issues, I find language saying that all these people used the same dataset, without specifically noting that Emanuel adjusted the data, to be imprecise and misleading. I find generic language about "uncertainties" in the data to be less weighty than specific comments about known biases. The issue with Emanuel 2005 is not simply "uncertainties" in the data; it’s a known bias, the direct connection of the known bias with Emanuel’s key result and the failure of the discipline to record and consider the matter when Gray presented it to them on a silver platter.
Steve-
Rather than focusing on Gray’s unpublished comment — which could have been rejected for any number of reasons, some sinister and some benign — I’d recommend that if you think something has been overlooked or handled imprecisely in this community that you write it up concisely and submit it, ideally to Nature.
That will serve two purposes. First, you will know the complete provenance of your own work and why it is rejected or accepted (unlike what any of us are privvy to on Gray’s submission). But also, it seems that a reworking of Emanuel in light of both 2006 and the various uncertainties and biases that you think have been poorly handled would be a hard paper to reject. Particularly if well done and if findings are at odds with what Kerry reported in 2005.
Seems to me that you have made considerable progress on such a venture based on your analyses presented here. Taking the final steps to a short, publishable paper probably involves less work than you’ve already invested.
re #27: I completely agree. This would be IMO a nice and quick way for Steve to wrap up these hurricane issues and to move back to other issues if he feels so.
#28 (contd). I forgot to say that instead of focusing on a single paper (Emmanuel), IMO you should put stress on general view on how adjustments have been done and what is the effect of those. Those early papers you found should definitely be cited as, although theoretically all researchers should be awere of them, many time even good old papers are forgotten. The final punch line of your paper could be stressing the data handling issue: in the papers it should be clearly stated what data sets are used and what adjustments are done to them, and also that used data sets should be archieved for other researchers (and even reviewers!) for replication.
Maybe you could get Gray to co-author with you so that they cannot reject it by saying that you are an “amateur.”
It seems odd to assume ignorance by people in the field of both early papers and the nature of the data. Steve M., you might try emailing Chan (who would have to be very familiar with all of this)about this before devoting a whole lot more effort to it. Also, recall that very recently someone who had worked for the JTWC commented here about more or less contemporary problems with the Dvorak analaysis technique in use there; perhaps that person would be able to shed some light. Finally, note that Emanuel’s essay states that he applied his NWP adjustments only after extensive discussions with people who were responsible for that data (I would assume JTWC, although he didn’t say).
I don’t think that I’ve added anything to what Gray already submitted and Nature has already rejected. The egg was scrambled when Nature rejected his valid comment. It’s onte thing to observe that Emanuel didn’t address non-homogeneity of Dvorak and airplane series, quite another thing to try to do so and I don’t think that I’m the right person to try to fix the problem. For example, I’d feel obliogated to learn a lot more about Dvorak methods than I’m interested in right now.
Re #32: Why such confidence that it was valid?
Steve B, I am commenting about what’s in the four corners of the papers and the supporting information. I didn’t say that people in the field were “ignorant” of the early papers and the nature of the data. I observed that Emanuel 2005 did not cite the early papers in which the formulas were originally presented. I’m not trying to determine whether he was aware of the citations and intentionally or unintentionally omitted to provide them or whether he was unaware of them; it doesn’t matter. Im not trying to read his mind or analyze his motives; I’m simply making an observation about the papers.
Similarly in terms of establishing homogeneity between Dvorak and airplane measurements. I observed that Emanuel’s SI contained a lengthy discussion of inhomogeneity between two phases of airplane data, but did not address homogeneity between airplane and Dvorak data. Why Emanuel didn’t do this is irrelevant to me. Again the amount of time that he spent talking to people at JWTC is irrelevant to this observation. Emanuel may very well be able to present an argument that the Dvorak data is scaled correctly with Atkinson-Holliday estimates. However, he didn’t do so. Again, why he didn’t do so is an issue that I did not comment on. So please don’t put words in my mouth.
Re #33: Because some people here, like Steve, take the time to first familiarize themselves with a subject and then check things out carefully before making any claims (and don’t simply dismiss them ignorantly based on who wrote them, and without really know what they are talking about).
By “Steve” I obviously meant Steve McIntyre, not Steve Bloom….
#33. In this case, I don’t think that Nature reviewers are in any position to determine whether Gray’s criticisms of potential inhomogeneity between Dvorak and Atkinson-Holliday estimates are “valid”. Their job is to decide whether Gray’s Comment is worth publishing – which is a different matter. One man’s “validity” is another man’s POV.
As far as I can tell, there is no literature showing that Gray’s observation is invalid; indeed, there is much generalized commentary by specialists about “uncertainties” in the data. As of December 2005, Gray’s Comments (edited and slimmed) deserved to be on the record together with whatever response Emanuel chose to make and let specialists sort it out. This is what happened with Pielke’s Comment on hurricane damage; the Comment deserved to be on the record as did Emanuel’s response.
Steve M,
On the one hand, I think you should stick it to ’em, and submit a correspondence. First the bin-and-pin, and now this. It’s disgusting. On the other hand, how will you respond (or pre-empt) when they say they’ve “moved on” from Emanuel (2005) in the form of Mann & Emanuel (2006)?
It’s their constant “moving on” that is so frustrating. If we’re always in their wake, mopping up after their errors … well, there’s not much appetite for that kind of work in the literature. So, while I agree with TCO that all this careful auditing work ought to be published, I’m just not that optimistic on the return-on-investment.
That being said, let me know how I can help in exposing this garbage for what it is.
Re #35: Other people, me for example, are also familiar with the material (why did you assume otherwise?) and still think Steve M. may be leaping to conclusions. You could try looking at this issue yourself and forming your own opinion. If after that you agree with his views, fine, but at least you won’t just be cheerleading.
Re #39 Well, Bloom, let’s hear your assessment, then. You suggest Steve M is leaping to conclusions. Let’s hear what it is that makes you say that. Booing is on the same level as cheerleading.
#38. I can see two quite different issues in how to collect and present the results of the discussions here. One is pushing articles through the climate journals – right now I’ve got a couple of articles in the mill, but they only are a small fraction of the topics on the blog. The other is simply collecting the most significant results for interested readers – so that loose ends are pulled together for interested readers who don’t wish to wade through the internal dialectic and noise.
#39. When you say that I am “leaping to conclusions” – please provide a quotation from the thread where you think that I’ve done any leaping.
Steve M.-
Establishing a record is one function of the peer-reviewed literature. The fact that Gray’s comment wasn’t published doesn’t mean that the ideas in it never will be or that they don’t matter. It could have been rejected for something as trivial as having been posted on the internet (thus violating a Nature guideline). Many ideas/papers go through multiple submission before being published. Gray hasn’t followed up. If the ideas have merit someone should. For better or worse, the assumption is that if someone doesn’t pursue an idea to success publication then the ideas must not have had merit in the first place.
As far as #32 you need not yourself come up with the “right” answer. A simple statistical examination of what Emauel has concluded in the context of plausible changes to the datasets would answer the question whether the inhomogeneities matter or not in the context of his conclusions.
The website is great. Science however takes place in the peer-reveiwed literature, and by “science” I don’t mean merely advancing knowledge, but the cultural and political process that is the scientific enterprise. I’d encourage you to participate, as you have on several occasions already.
So has Steve M. violated this rule already in regards to a possible paper on this subject?
Re #39 **Other people, me for example, are also familiar with the material (why did you assume otherwise?) and still think Steve M. may be leaping to conclusions.**
Are you “familiar” or did you just look at it? We never get scientific assessments from you, only quotes from others. Steve M. does many times more in depth analysis than you do.
#44 Possibly. But my sense is that it is the submitted paper itself that is the issue, though if the main conclusions are “published,” then the big journals may decline to review (gotta protect the possibility of an embargo!). But there are always other outlets.
Should not Heal Thyself be a guiding light for climatology — unless they judge that there is nothing to heal or do not choose to see anything that needs healing.
Re #45
Bloom is also “familiar” with number theory, sampling theory, and Bayesian statistics. [Bloom, don’t bother making me go to the effort of combing through your absurd posts for my evidence for this statement. Linkies would not be hard to come up with.]
Even the GT students saw through Bloom’s “I’m an expert on …” schtick. He reads, yes, but very shallowly.
TCO writes:
Explanation:
Looks like a duped do-gooder site. News and posts not often updated. The snazzy graph done by some talented kid I bet, not PR firm produt.
The sites run by the Carbon Credit lobbies are better maintained, full of talking points, including explicitly promting carbon credit trading, and never, never explain their backers. They appear as single issue NGOs which are not really “grass roots” orgs but products of Public Relations firms’ NGO divisions. Yes, the big firms have NGO divisions.
There were rumors in right wing publications that Bush might consider a carbon credit scheme, then that he would not. On the march though is Schwarzenegger who is inking carbon credit schemes between California, NE US states and the EU.
No contest, the EU will win. The EU countries already finding the advantages of undestimating their carbon production. Credits from fake reductions will be sold to Americans.
Red apple; red apple; red apple; red apple; orange; orange….Doh!
Someone get in there and paint those darned oranges red!
re 50
BradH,
please explain to a fossil what you are talking about, eh?
Re 41: If you publish papers, you can just have a section with those papers being most of the content, Steve. Will satisfy the demands of your “second option” with minimal effort above doing the first option. It will also be a higher quality product, since you will have had to meet tighter standards for thought and style.
#52 TCO, I agree that publishing good research in respected journals usually makes sense. But suppose you are in a discipline where the “respected journals” are, for whatever reason, inimical to critical analysis and attach little value to rigorous research? What is the best strategy under that circumstance? We all accept that publishing one’s research sometimes involves a certain amount of compromise in order to satisfy referees and editors, but suppose the “community,” through control of the journals, makes the cost intolerable?
Perhaps — I’m really not sure about this at all — it is better to create a new venue and to invite those with similar views to join you. As we’ve seen, it is possible to create a place where thoughtful criticism is not only tolerated but celebrated. In the past, this might have required starting a new journal or a new “society”. Today, there are blogs.
In conclusion, I would note that SteveM has an audience of thousands and has achieved international recognition — not bad for an “amateur”. In contrast, I would consider William Gray’s experience as described above.
TAC, this is purely a hypothetical case, since Steve is not complaining about being shut out of the journals and since he really doesn’t bother writing many papers.
Re 51
He’s talking about cherry-picking & cherry-painting when the picked cherries ain’t ripe.
Here’s a ppt from the Joint Typhoon Warning Council on the Dvorak method https://metocph.nmci.navy.mil/jtwc/dvorak.ppt . I understand that they’re planning to use MBH99 methodology to establish confidence intervals.
Re:#51
Sorry, jaf. Just a bit of humour about the imhomogenity of the different measurement methods and how what were apples for decades (aeroplane measurements), but suddenly because oranges (satellite measurements) were bolted together as a series (oranges were painted red) and represented in graphical form as just one, long row of apples.
Re:# 57
sp. inhomogeneity
Steve or JohnA, if so inclined, please replace #57 and #58 with the text below (my stoopid spelling mistakes make 57 unclear and embarrassing, especially as jaf was asking for clarity).
Re:#51
Sorry, jaf. Just a bit of humour about the inhomogeneity of the different measurement methods and how what were apples for decades (aeroplane measurements), suddenly became oranges (satellite measurements) and were bolted together as a series (oranges were painted red), then represented in graphical form as just one, long row of apples.
Re: #52
You have viewed papers written by Mann. Tell me that those papers have somehow made him meet higher standards for thought and style. If you would have hinted at higher standards for obfuscations I might see your point better. I think that this view that paper writing is going to set the climatology world right begins with: In an ideal world …
Do these publications really want what Steve M provides? Mann can write on just about any subject with vague references and make any claim with darn near impunity within the climate world. Steve M audits these papers and makes them comprehensible to me and the “hidden” reasoning and methodologies become clear.
#56
Steve,
The JTWC Dvorak methodology looks pretty much what it did 20 years ago when I was there. It is interesting in the introductory slides, there was a statement that Satellite analysis should not replace measured observations (ie from air recon). Any 1st or 2nd year Met student can tell that there is a lot of subjectivty in the Dvorak Method. There are plenty of real world examples where there were significant differences between the Dvorak derived intensities and surface observations.
The meteorology of Dvorak is fine. The problem is he uses “classic” tropical storm development models. Rarely do TS follow this growth and decay model exactly. If you notice, he does place constraints on intensity analysis in order to prevent the analyst from going hog wild.(I wonder if Emanual took this into consideration). The other problem is the human element. It does take several seasons of rigorous satellite analysis to get good at it. My commander, Major Wells was doing tropical satellite analysis for 20 years, and was the only person I knew who could it with any kind of precision. I’m not sure how a climatologist can make intensity adjustment to decades of analysis without specializing in Tropical Meterology.
Perhaps, TS are becoming a new type of proxy. Both AGW skeptics and proponents can play with these sat photos all they want and derive “adjustments” to make thier case.
RE: #49 – Bush has gone on record (sorry I don’t have a specific link, the news passed across my virtual desk about 2 – 3 weeks ago) as being similar in his views as Schwartzenkennedy. The heavies are lining up with the “climate science” orthodoxy. I bet this freight train cannot be stopped until after the damage is done.
Ken, it is trivially evident that an editorial process forces higher quality, from grade school to the corporate world to science. Mike’s papers are better then his RC posts. And I warrent the published ones are better then the submitted ones and that a significant part of Mike’s own problems getting published stem from his desire to write in such a wierd manner.
#63
except when the editorial process wants to promote GW or AGW as a fact from grade school on up.
I can do my own editing here, but as you say an editor at any level can normally improve even the best writers’ clarity in making a point. It is trivially evident that that process did not work with Mike Mann’s renditions –assuming that if his paper started with less clarity most reviewers of it would have had difficulty in deciphering enough of it to even fairly pass judgment on it. If you are including into the editing process the peer review of a paper then I can only say from my perspective that failed also in doing any hard digging (that Steve M has done in his auditing process) into Mike’s papers.
Let me ask you: Who is easier to comprehend (given your technical limitations) an unedited and non-peer reviewed Steve M or an edited and peer reviewed Mike M? Peer reviewed papers obviously play a crucial role in the scientific process, but they are not the be all and end all that I think you sometimes make them out to be — and that goes in spades for climatology.
Enough on this please. This is a specialized topic so please don’t add to the noise with general ruminations about peer review. My main concern with journal peer review is that it is a very limited form of due diligence and that climate scientists all too often confuse passing this limited form of due diligence with something being proven. I do not believe that Nature peer reviewers thought for one second about whether Emanuel’s series was homogeneous between airplane and Dvorak measurements.
#65 I think if you want your results seriously discussed and referred to by the scientific community, you have to publish them. That’s just the way it works: peer-reviewed papers are the tools that modern scientists use to build the knowledge in their field. Whatever the value of Steve’s work, it will not be officially recognized if it is not published (even though many scientists recognize it “non-officially”).
And I don’t think there should be too much worry about a conspiracy of Editors and reviewers. A professional editor, knowing the history of Steve’s work, would not send the paper for review to Mann or anyone close to him. Just chose the right journal. Forget Nature or Science. There are plenty of others.
Steve writes:
I thought I heard that too, but frankly Bush is so inarticulate it’s hard to fathom what his stand is. I do know there were rumors of a push for the Carbon Credit Laudromat within the White House, and rumors it was dumped. Maybe the latter is wishful mishearing on my part. Anyway surely lobbyists will work over Team Bush after the election again. They’ve purchased the Democrats already.
I did hear Bush once say the it doesn’t matter if the global warming crowd is right or not because his plans to go to the hydrogen economy would anyway reduce carbon. Big problem: he’s mentioned the “hydrogen economy” since his first year, lately talked about “oil addiction” but has done nothing. He apparently thinks someone is going to drop some plans in his lap or something. When he talks about “market solutions” that’s a laugher, small-minded right-wingishness. The “market” is against moving off oil. The Democrats can’t take advantage because they have no ideas other than how to “brand” themselves and reliving their Vietnam war protester days.
Pessimistic? Yep.
The Carbon Credit fraud, like all successful con jobs,
Steve, on the NATURE non-publishing of the Gray comment (which needed to be pruned), I agree with you. However, he (and you and other skeptics) need to go ahead and follow the game and submit tight, properly written publications. Landsea and Pielke got their comments in no problem. Nature is a very prestigious, very tight on space journal. If you submit stuff that is verbose or even that has the wrong slant (personal shadowboxing, vice discussion of science), do not be surprised by a rejection and even one that does not allow a rewrite. Furthermore, the “tin ear” for how to write these publications makes me worry a bit about the overall logic that all of y’all have when you examine issues.
Steve, agree that the specifics of the adjustments are not called out in the Nature letter (why I say the SI should be the paper and not the letter itself), I would be mildly surprised if the reviewers had not considered the SI in their review. It is very reader-friendly and is clearly pointed to in the Methods section as having the adjustments and data treatments therein. If Curry or Landsea reviewed, could not imagine them not reading the SI.
What is your impression of how wind speed was measured in the early period, Steve? Given that the equation seems to be an explanation, not a predictor, how did they get a wind speed number at all, Steve? Do you think it was directly measured by pitot tube? This would seem to be answerable by discussion with those that generated the data, perhaps even with a veteran at the right organization.
All?
Technical question: how do you quote (cut and paste) text from a pdf? Is there some way to do this other then retyping?
WRT the 1987 shift to Dvorak, I agree that this generates a big concern of displacement and that Emanuel should consider this issue. However, are you aware of any work on this specific issue (essentially it would be cross-calibration of the two estimates, perhaps from the foundational Dvorak papers)?
WAIT! (stream of consciousness). Just read down and saw your discusson of the different papers citing a difference of Dvorak and AH methods. However at the end of the day, both AH and Dvorak are estimates and should be compared not only to each other but to direct measurement. No? So to be consistent, not just knowing that AH and Dvorak differ, but proving the difference of either from direct measurements ought to be done. This is a trivial issue, but I just want it all nailed down and consistent.
Click on the Select tool at the top of Acrobat reader. You should now be able to select text. You can either right click and “copy to the clipboard” or use the keyboard shortcut ‘ctrl + c’ to copy the text. I usually paste it into Word to get rid of the carriage return/ line feeds.
re 74: sometimes a pdf uses scanned images, so no text selection is possible, also sometimes the text is encrypted so pasting yields gibberish. In those cases print, scan and OCR is an option.
74: just do it. gotta have the right “tool” from the toolbar, though.
#75
“Just read down and saw your discusson of the different papers citing a difference of Dvorak and AH methods. However at the end of the day, both AH and Dvorak are estimates and should be compared not only to each other but to direct measurement. No? So to be consistent, not just knowing that AH and Dvorak differ, but proving the difference of either from direct measurements ought to be done.”
TCO,
I think you pose the main question. The Air Force suspended air recon over the NW Pacific back in ’87. Unless the storms pass over ships, buoys, or surface weather stations you have no direct observable surface pressure or wind speed. I don’t think the Dvorak Method was ever expected to replace direct weather observations.
#’s 76,77,78,
You realize that your technical assistance may encourage TCO to post even more frequently, don’t you?
I’m not sure whether that would fall under “the road to hell is paved with good intentions” or “the law of unintended consequences”.
#71. The Emanuel SI was not online as of Sept 20, 2006 – see http://www.climateaudit.org/?p=803#comment-46763. I looked for it as well and was unable to locate it. It’s online now but only came online after we started commenting here. Based on my experience with reviewers, I completely doubt that they consulted the SI.
#69, You’ve missed the point – the Pacific adjustment has nothing to do with Landsea.
#70. I agree that Gray should have written his comment more tightly. This may be business experience speaking, but, in my opinion, it’s fortuitous that Gray noticed the problems and Gray has no personal responsibility to correct Emanuel’s problems; the primary responsibility for ensuring that the record is correct lies with Emanuel and with Nature. Presumably Emanuel became aware of Gray’s criticism as a respondent. He should have corrected the record himself if Gray’s comment did not stylistically meet Nature’s criteria. Not putting Gray’s criticism on the record distorts the record. While I realize that Nature takes little responsibility for its own dirty linen, I find it reprehensible that they take so little responsibility for dealing with criticisms and flaws in their publications and export the responsibility for cleaning up their problems to other journals with less visibility.
I presume that the information from the 1950s and 1960s was obtained from WB-50airplanes flying into hurricanes at 700 mb. Lander et al showed this data in their Figure 4 shown above – perhaps it’s closer to direct measurements than either AH estimation from WB-47 airplanes at higher altitudes or Dvorak. I don’t know all the details – while Emanuel purported to discuss measurements in his SI, his discussion was not thorough even in the airplane part.
Re #81
1. You mean that Nature SI for Emanuel (2005) is available now? Good! Must have missed that announcement. Score +1 for CA.
2. Wait a sec – that opening fancy graphic – I just noiticed: those aren’t Emanuel’s curves. They look quadruple+ smoothed, not double-smoothed. [See what BradH means about painting apples orange? Another case of “Climate Data Massage for Alarmists 101”?]
WRT publication: an obvious answer to the precedence dilemma is a joint McK/Gray paper. The paper needs to be carefully scoped and presented.
For instance, are you arguing for an alternate correction of AH and Dvorak consistency? Or are you just saying that no-one knows and presenting two different options (the zero offset and the 7.5 m/s offset for consideration) of the implications.
The 50 years experience puffery needs to be cut.
The stuff on alternate basins needs to be expanded or addressed more thoughtfully or omitted. Do we have PDI of those basins? Similarly the comments on numbers of storms either needs to be omitted or made more thoughtful and consideration needs to be given to the statement that Emanuel had in his paper that he knew of the number trendlessness but thought PDI of interest regardless.
Given the previous rejection and the scope of the comments, paper needs to go to somewhere other then Nature. GRL would be good, given that this is essentially a very short paper.
Steve, I know that the adjustments for the Pacific were different. Perhaps my comment doesn’t fit in this thread, but the comment on the desirability of understanding the Landsea correction issue to definitive end (vice “precedence” stands). I was making comments in general from having read the paper itself. Not just from your post.
Steve, my experience in material science is that SIs are routinely looked at by reviewers, especially in crystallography (which is a type of data analysis, statistics, pattern finding study). Just because the SI was not online, does not mean that the SI was not presented with the paper. We could look at Nature direction to authors (will in a second) to understand what normal policy is. And “I say again” (radio telephony) that the text itself is VERY clear about referring to the supplemental information for details of methods.
Steve, it is NOT Nature’s responsability to help codgers that can’t write decent papers when they may (or may not) have a relevant point in an area of science debate. If you want to play this game, you need to follow directions to authors and write appropriately. I have NO SYMPATHY for you all getting shut out of journals if you don’t write good stuff. In fact, when you do, it makes me worry that there may be sloppiness in other areas of your thinking.
Another double standard for your list bender?
Husband says re: peer review and his experience [maybe true in any other branch of science or NOT true in fame and fortune pubs like Nature has become]:
peer review he has come to know is not concerned with arguing/reviewing conclusions of a paper, and it may make suggestions for wording; but it’s the math, formulas, numbers and statisitics they will comb over the most [ and a reviewer of the proper authority will be in place and they will make sure one is] -in other words the author can say whatever and come to whatever conclusion they want to [in a nutshell] if the numbers add up. And authors are really concerned with that part of their paper too [sleepless nights!] -before, during and after their paper is made public. [He has a friend who wrote a paper about soils, a small math error was found in his paper after it had been accepted. This guy was so concerned with the integrity of his paper, he did so much to correct it! He sent out a mass mailing for one example]
This is one reason my husband thinks something’s certainly fishy in the world of climate science peer review and publishing. And why it’s fishy SteveM has been treated so by the original authors and the climate community.
Considering the proxies and or data sets lacking or hidden , methods not being shared; the apples grouped with the oranges etc etc etc, on top of everything else a non-biased professional would notice; an even worse picture of the all the fishiness emerges.
Getting back to Pacific adjustments, I’ve been looking at the Webster, Curry results and it looks to me like the supposed change in Cat4-5 proportions is entirely dependent on W Pacific results and that the supposed change in proportions occurs almost precisely at the discontinuation of airplane flights and reliance on Dvorak analyses. I’ll post on this later.
The Webster, Curry reply to Chang while full of sweetness, does not seem to clarify points or drive any science. Really sort of mealymouthed. In addition, I’m not sure that Curry understands how much her analyses suffer from “insignificance” if she restricts the period to post 1970. In addition, I don’t know if she understands the concept of bounding a problem. IOW, if pre-1970 data is an UNDERESTIMATE of storms and it STILL shows higher variability, one IS NOT justified in excluding it because it was inaccurate!
After rereading Judith Curry’s summary of the Webster, Curry et al paper, I was curious as to whether their data sources might have some of the same issues as Emanuel’s. I look forward to that analysis.
TCO, your advice is coming so fast and furious (as it frequently tends to do) that if I were the target of all this consultation I would soon get lost in all the detail. May I suggest that you confine your advice giving to a point at a time and then wait for a reply until going on into another.
I fail to see why anyone is obliged to answer a communication or critique. But others are free to consider what that silence may mean. It may mean nothing.
A continuing theme here is that peer review didn’t detect weaknesses or probable objections. Is that the job of the reviewer?
Or should reviewers look at methods, clarity, and format and let the researcher state the conclusions, even if such conclusions seem mistakes to the reviewer?
After publication the reviewer(s) probably should not try to defend the paper itself. If they now feel they have committed to the paper being right they probably should have not been reviewing it at all.
I hope no one is using the the hurricane data at unisys that is collated by decade. I examined several of the files have found them to contain multiple copies of the data for the decade.
#93. Arggh, Bob K, I’ve downloaded the following files from unisys: atlantic/tracks.atl, w_pacific/tracks.bwp, e_pacific/tracks.epa,s_indian/tracks.bsh,indian_oc/tracks.bio and spent a lot of time collating the data. Plus I’ve downloaded the storm track data for 2004-2006 by indvidual tracks and updated.
If this data is no good, what should be used? OR what corrections are needed?
Steve,
Those files you are using are likely ok. I was talking about the files collated by decade only. Two of the basins have been reformated by decade and the files have extensions of .data
If you look at the bottom of this page you’ll see what I’m talking about.
#95. I hadn’t noticed the decadal formats – which are much more sensibly formatted (BTW). What’s wrong with the decadal collations? Jeez, you’d think that they’d be able to get this stuff straight.
They have multiple copies of the same data in the decade files. The Atlantic 1940 has three copies of the 1940’s in the one file. Most of the others have dupes also. Kinda makes you wonder, doesn’t it?
Here’s a sample of the way I’m reformatting them. I saved all readings that had a longitude. Trivial changes allow me do it saving only the ones with a wind speed. I think that may be the way to go.
All fields are justified to the left in fixed length fields. Individual readings get a separate line. Most changes are fairly trivial now that I have the parsing engine done.
The first field is the line number into their database. Then date, hour, storm number for the year, storm number for the database, latitude, longitude, wind, pressure, storm class. The readme file says the hours are purportedly 0z, 6z, 12z, 18z each day, so I shammed them in.
I dump the entire line containing the storm name to a separate file.
If you’re interested, just let me know what style you would like. I’m just puttering around, so I don’t mind doing it.
10600 01/16/1956 0 10 251 18 207 10 0 TS
10600 01/16/1956 6 10 251 18.1 206.9 15 0 TS
10600 01/16/1956 12 10 251 18.2 206.8 20 0 TS
10600 01/16/1956 18 10 251 18.3 206.7 20 0 TS
10605 01/17/1956 0 10 251 18.5 206.5 25 0 TS
10605 01/17/1956 6 10 251 19.1 205.9 30 0 TS
10605 01/17/1956 12 10 251 19.6 205.4 35 0 TS
10605 01/17/1956 18 10 251 19.8 205.2 35 0 TS
New article on measuring hurricane inner core wind speeds here:
Click to access kossin_etal_2006_WandF.pdf
James P. Kossin, John A. Knaff2, Howard I. Berger, Derrick C. Herndon1, Thomas A. Cram2, Christopher S. Velden, Richard J. Murnane, and Jeffrey D. Hawkins, Estimating Hurricane Wind Structure in the Absence of Aircraft Reconnaissance
RE : 1
Steve,
In the graphic of the Northwest Pacific Category 4 and 5 typhoons, 1997 has only 9 systems while the original JTWC reported 11 typhoons at the Super Typhoon intensity (130 kt).
Lenni
#99. Good point, I wonder why?
Sorry if I missed this but…
With the discussions regarding the veracity of AH and Dvorak measurements, and the lack of direct observation by aircraft in the Pacific, has anyone done any measurements of AH and/or Dvorak against storms that DID have direct measurements (in either the Atlantic OR the Pacific), and what were the results? If the estimates were off, was there a consistent factor that could be applied to bring the estimate in line with the actual recorded measurements from the aircraft?
Re #101 Yes, there has been a lot of work to correlate Dvorak results with actual measurements (aircraft, dropsonde, etc). I think I’ve read that, on average, there is about a plus or minus 15% difference between Dvorak and actual meansurements. That is not a big problem for meteorologists issuing storm warmings but it is a big problem for climatologists looking for small changes in intensities.
Dvorak is an approximate method, based on the appearance of the cloud tops and a few other features. It is surprising to me that Dvorak works as well as it does.
In my experience the Dvorak method is best used to estimate if a depression has made the structural transition to tropical storm or hurricane.
After many years of communication with professionals who do real time tropical cyclone analysis, it is clear to me that Dvorak works best with nearly symmetrical cyclones, which can only occur in low shear environments. Higher wind shear distorts the satellite presentation, which in turn reduces the accuracy of the Dvorak estimate.
Also, the transition from depression to storm is largely guesswork using Dvorak in the real world, as Dvorak relies on deeper convection wrapping at least part way around the centre to get a reasonable estimate that a depression has intensified to a tropical storm, and the presence of wind shear means that waiting until this situation is satisfied can cause an underestimation of a storms intensity.
You only have to see how often a system classified as a depression in one warning can suddenly become a quite strong tropical storm in the next warning – chances are it was already a tropical storm for many hours before strict application of Dvorak identified it as one, as has been shown often enough in the Atlantic where a storm not presenting as such by Dvorak was upgraded because of the recon – of course situations of explosive deepening also may result in a quick transition, however these will usually continue to intensify into hurricanes quite quickly.
BTW, Severe Tropical Cyclone (Hurricane) XAVIER is threatening Vanuatu at the moment – October cyclones of any intensity are quite rare in the SW Pacific, and this one has cyclone watchers looking on with amazement as it quickly exploded into a full blown Cat 5 system!
Hate to be you, Vanuatu
Just an OT addendum to my previous post – Xavier’s life as Cat 5 (Aust) – high Cat 4 US – earlier today was short-lived, reacing peak intensity only briefly before slamming headlong into strong NW wind shear that over a few hours reduced it’s previously quite well-defined intense core stucture into a distorted mess, and over the next couple of days it will probably be blown apart, so hopefully Vanuatu will be spared the worst as it is likely to swing S then SW then W, passing to the S of Port Vila as a much weakened system.
Whew!
#102,
Thanks for the answer. I guess my next question would be was such an adjustment applied to the non-recon Pacific data that used the Dvorak estimating method for the Emmanuel paper and if not, what would such adjustments do to the data. Frankly, I’m not it’s even possible since with any given storm, going +/- 15% would seem to create chaos with the dataset…How would you know for which storm to go + or – on, and if you apply it to each storm, you have the same thing as without it. Given that, I don’t see how you could apply any significant confidence level to your estimates of intensity and trending.
Using the Saffir-Simpson scale
74 – 95 – Cat 1
96 – 110 – Cat 2
111 – 130 – Cat 3
131 – 155 – Cat 4
> 155 – Cat 5
Assuming a hurricane in the median of each range, +15% changes it’s category by + 1 and -15% changes it’s category by -1. Depending on which category you are in, the % change required to go from the median wind speed for that category to the next highest or lowest category ranges from a high of 13.6% for Cat 1 to a low of 7.7% for Cat 2.
I guess for me, the bottom line as usual is, if you can’t assume with a high enough confidence level that you input data is correct, how can you make valid conclusions about what that data might mean, and beyond that, how can any reasonable policy decisions be made if the source(s) of those policy decisions are suspect.
I may be totally wrong on all of this, which if true, I’m blaming this post on my evil twin.
RE: #106 – might have gone over an eddy in the ocean current just right, and picked up an unexpected shot of energy quick to be dissipated.