Proxy attention seems to have migrated away from things like bristlecones (still waiting for Hughes’ 2002 Sheep Mountain update) to the Antarctic Peninsula ice shelves, with the major break-ups of the Larsen 1-A and 1-B ice shelves. An interesting illustration of NH-SH asymmetry is that the latitude of the Larsen 1-A ice shelf is 64 45S; in comparison, the latitude of Tornetrask is 68N. The difference is presumably due to the impact of the Antarctic continent on the one hand and the Arctic Ocean on the other.
I’m going to post up a note on Domack’s prominent Nature article on the break-up of the Larsen 1-B ice shelf, but first I’m going to post a note on Brachfeld, Domack et al 2003, an earlier article on the break-up of Larsen 1-A. Domack’s articles are interesting and well-presented, but the Nature article is on the one hand less informative and on the other hand contains annoying Naturisms (“unprecedented”) that did not occur in the earlier article – you can draw your own conclusions.
Domack and his coauthors have taken sediment cores underneath receding ice shelves and provided informative descriptions of the sediment cores – they are geologists and write informatively. It’s quite different than reading Lonnie Thompson or Keith Briffa and very welcome.
Their Figure 1 is a location map of the cores. Brachfeld et al 2003 discussed (karsten) core KC23 – which is the furthest offshore.
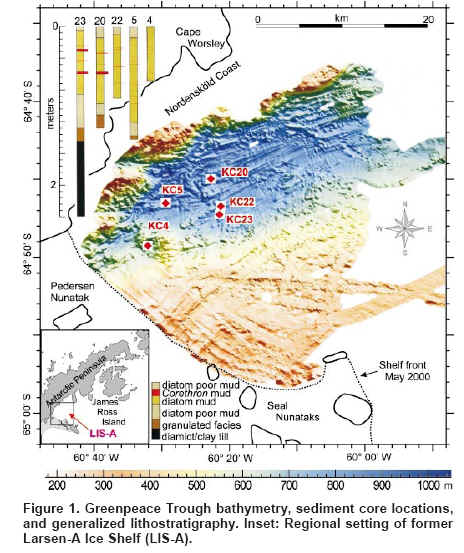
They report that KC23 contains 3 lithological units – the topmost of which is open water facies, the bottom-most showing grounded ice. They then try to date the strata. An identical strategy is used in their later article on Larsen 1-B. Brachfeld et al:
KC23 contains three lithological units (Fig. 2). Unit 1 (0–130 cm) consists of a silty-clay with a minor component of sand and scattered gravel. The upper 3–5 cm of Unit 1a contains unsupported 210Pb, indicative of modern sediment accumulation (Gilbert and Domack, 2003). Unit 2 (130–150 cm) consists of a coarse-grained granulated facies, which represents an ice-proximal water-laid till. Unit 3 (150–230 cm) consists of a structureless black mud with elevated shear strength, which represents a comminution till deposited under grounded ice (Domack et al., 2001a).
Their Figure 2 (an excerpt of which is shown below) shows a core photograph on the left and several other indicators including diatom and foraminifera abundance. In the open water facies, diatoms and foraminifera are present, while in the facies grounded by ice, there are no diatoms or foraminifera. The difference is very marked and leaves no doubt as to the reality of the distinction. You can see a difference in color of the units as well, with the ice facies being darker in color. The transition from open water facies to grounded ice facies takes place between 130 and 150 sm in depth.
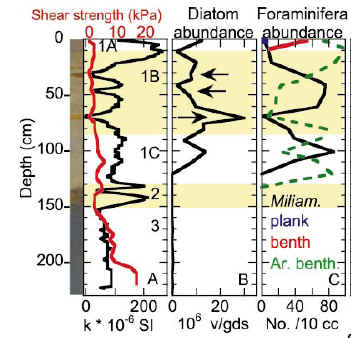
Brachfeld Original Caption: Figure 2. Digital photograph of KC23 and downcore profiles. [KC23 is furthest offshore.] A: Magnetic susceptibility and shear strength. B:Millions of diatom valves per gram of dry sediment. Arrows denote Corethron ooze layers. C: Foraminifera per20 cm3 sediment. Miliammina spp. (Milam.) and arenaceous benthics (Ar. benth) dominate KC23 profile. Calcareous benthics (benth) and planktics (plank) are restricted to Unit 1a.
The earlier article contains an extended discussion of two Antarctic radiocarbon dating problems: 1) a significant reservoir age of 1200-1300 years, which needs to be deducted from all measurements; 2) re-cycling of old material requiring a “regional AIOM (acid-insoluble organic matter)correction factor of 9000–9400 years” , noting that AIOM is often used in Antarctic studies due to the absence of calcareous organisms in many circumstances.
Antarctic marine carbonates have an ocean reservoir age of ca. 1200–1300 14C yr B.P. (Gordon and Harkness, 1992; Harden et al., 1992; Berkman and Forman, 1996). However, much of the sediment accumulating on the Antarctic shelf lacks calcareous organisms, necessitating the use of acid-insoluble organic matter (AIOM) from bulk sediment. The AIOM may be affected by reworked carbon from detrital humic macerals, kerogen from sedimentary rocks, and resuspended marine organic matter (Andrews et al., 1999; Domack et al.,1999).Microscope observations indicate that LIS-A organic carbon is a mixture of 25% carbon formed and deposited contemporaneously with the sediment and ~75% reworked organic carbon characterized by preaged terrestrial detritus. We obtained a radiocarbon age of 9720 +-65 14C yr from a sediment-water interface sample of AIOM and an age of 1010 +- 30 14C yr from a sample of living bryozoan calcite, which indicates the magnitude (~8700 yr) of the effect of reworked carbon on our radiocarbon ages (Fig. 1; Table 1). However, the surface sediment contains a greater abundance of sterols (0.3–0.55 mg/g) than the downcore material (~0.15 mg/g), where reworked carbon has had a greater impact on the resultant ages. A regional AIOM correction factor of 9000–9400 yr is indicated by paired calcite and AIOM 14C ages from LIS-B, where biogenic calcite is much more abundant than in LIS-A (Domack et al., 2002). These observations illustrate the difficulty of relying solely on AIOM radiocarbon ages from organically lean sediment.
They present the following tables of uncorrected C14 dates. The only C14 dates for Unit 1 are in the open-marine Unit 1 and are all AIOM – which would be subject to AIOM dating problems that they refer to.
In an attempt to avoid reliance on potentially problematic radiocarbon dates, they wiggle-match geomagnetic intensity reversals in core KC23 against an intensity reference curve. Brachfeld et al:
Records of high-frequency (,10 k.y.) geomagnetic field paleointensity variations can serve as a global, millennial-scale correlation and dating tool (Channell et al., 2000; Laj et al., 2000; Stoner et al., 2002). Here we demonstrate the utility of geomagnetic field paleointensity as a dating tool for Holocene sediment via tuning with an independently dated reference curve. Our absolute intensity reference curve (denoted ABSINT) is a compilation of more than 2000 absolute paleointensity determinations made on archaeological baked clays (pottery, bricks) and recent volcanic samples from around the world (Yang et al., 2000; Laj et al., 2002) that permits us to import the 14C, K/Ar, and historical absolute ages of ABSINT’s samples to the Antarctic margin.
From this dating, they derive a Holocene history in which the transition from the ice-grounded units to open-marine facies Unit 1 is said to be complete by 10,700 BP and the transition
The paleointensity-based chronology eliminates these complications and enables us to establish the timing of events in the history of LIS-A. The progression from the comminution till and gravelly mud of Units 3 and 2 into the diatomaceous mud of Unit 1 likely represents the Last Glacial Maximum to Holocene transition in the northwestern Weddell Sea. This is manifested as a transition from a grounded ice sheet to a floating ice shelf, as evidenced by shifting gravel provenance from in situ black shale to crystalline igneous and metamorphic rocks derived from further afield. This transition was completed by ca. 10.7 +- 0.5 ka. The transition from Unit 1c to the more diatomaceous Unit 1b is dated as 6.3 +- 0.5 ka, which coincides with the maximum warming and maximum biological productivity observed in records from the western Antarctic Peninsula (Domack et al., 2001b).
The three diatomaceous ooze layers are dated as 1.4 +- 0.25 ka, 2.1 +- 0.25 ka, and 3.8 +- 0.5 ka. The precise mechanisms of formation and emplacement of these layers remain uncertain. However, they occurred after the peak in middle Holocene warming documented on the Antarctic Peninsula (Domack et al., 2001b) and slightly later than other episodes of ice shelf decay in the Antarctic. Sedimentary records from beneath the smaller and more northerly Prince Gustav Ice Shelf suggest that the ice shelf decayed ca. 5–2 ka (Pudsey and Evans, 2001). Records from the East Antarctic margin indicate both advances and retreat of glaciers ca. 7–1 ka (Domack et al., 1991; Hemer and Harris, 2003). It is likely that the discrepancies in the timing of these events are due to challenges associated with the derivation of an appropriate correction factor to account for marine radiocarbon reservoir variations and the variable input of reworked carbon: hence the appeal of the paleointensity method.The transition from Unit 1b to the gray, less biogenic Unit 1a is dated as 0.45 +-0.25 ka. This unit coincides with decreased productivity and cooling observed on the western Antarctic Peninsula (Domack et al., 2001b). The top (0–2 cm) of Unit 1a is characterized by the first appearance of calcareous planktonic foraminifera and increases in calcareous benthic foraminifera and diatom abundance, which marks the modern recession of the ice shelf.
One simple observation from these cores (and the same will apply to Larsen 1-B): they conclude that the shelf was grounded prior to 10,700 BP, but do not attempt to limit that – i.e the information does not enable one to determine the last precious time when open marine conditions prevailed – whether the Eemian (110,000 BP or the Pliocene or whenever). If something is actually the “warmest in 12,000 years”, I’m pretty sure that you could quickly postulate that it is the warmest in 100,000 years. In his article on Larsen 1-B, Domack observes that erosion of the ice shelves has been going on for thousands of years. As one looks at the million-year proxies, one is struck by the relative warmth of the Holocene (look at the famous Vostok graphic for example). The issue that I’m pondering about these ice shelves is the extent to which the present break-up is the resulted of an extended process of glacier and ice shelf erosion that has been taking place occurring throughout the Holocene, with the Larsen ice shelves being present day recessions not dissimilar in character to the previous recession of other ice shelves earlier in the Holocene. I’ll reflect further on this in connection with Larsen 1-B.
Reference: Stefanie Brachfeld, Eugene Domack, et al 2003. Holocene history of the Larsen-A Ice Shelf constrained by geomagnetic paleointensity dating, Geology, 31, 749-752.


7 Comments
Steve, the graphics are missing. Something is broken
The pic links need correcting — they point to a drive file, ex:
file:///D:/DOCUMENTS/My%20Webs/blogimages/domack4.gif
‘Fraid that’s not on my computer. 🙂
I’ve gone through the post taking out all the annoying changes of font, improving speling and paragraphing and removing the reference to the figure on Steve’s laptop – its the same as Figure 4 anyway.
John A, when I tried to copy text into the new layout, the fonts got screwed up. I’m using Front Page as a html text editor, which isn’t very good.
That’s true – it isn’t very good. Personally I take all the formatting out using MS Word or OpenOffice or even Notepad and then use the WordPress editor to put formatting in where I need it.
The WP editor isn’t very useful and I’m going to see if there’s a better one as a plug-in
W3C have a pretty good free html editor called Amaya at http://www.w3.org/Amaya/
Recent changes in Larsen IS Area reported here:
Coastal-Change and Glaciological Map of the Larsen Ice Shelf Area, Antarctica: 1940–2005 published 2008, posted March09 at
http://pubs.usgs.gov/imap/2600/B/