Here’s an interesting map of tropical salinity from Stott et al 2004. If you were Louis Hissink or a mining geologist looking at this map, you’d be interested in a core in the salinity bulls-eye at 120W and 20S. I haven’t been able to locate any relevant ocean sediment cores in this bullseye area (but am just feeling my way through this data). There seem to be lots of cores in upwelling areas. If anyone is aware of an ocean sediment core in this area with relevant dO18 or Mg/Ca, I’d appreciate the information. (Update note: as noted in the maps in comments, there are some older DSDP cores in this area but they have do not appear to have yielded relevant Pleistocene information.)
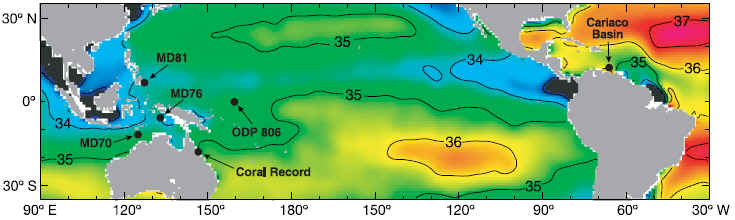
Figure 1. Pacific Ocean salinity from Stott et al 2004


23 Comments
Map of global odp sites:

http://www-odp.tamu.edu/sitemap/sitemap.html
Hans, thanks for the map. It does show a big hole in the PAcific in this area. As far as I can tell, the closest holes are from Leg 92, Site 598 etc. I’ve done a quick browse without locating information relevant to the Pleistocene. If anyone else has better luck, let me know.
HEre are excerpts from the two ODP maps – one showing an earlier set of holes. My impression of the lack of work in the bullseye shown above seems to be confirmed -t he top graphic is the more recent cores.
Re #1, What is your point, other than ‘more sampling = better’? There is not appreciable upwelling in the western tropical Pacific (is that what you mean to imply regarding the Stott graphic?). The low salinity in that region results from precipitation excess and freshwater runoff. The ‘bulls-eye’ in the salinity climatology results from strong trade winds and low precipitation. The climatology doesn’t suggest much of anything regarding variability. And there do seem to be a number of sediment records from this area, as indicated by the lower map in your latest post (75,76, 318, 597). Records from this area might be complementary to others, but there is no a priori reason to assume they would be of any greater value or more reflective of larger-scale patterns of variability. If I am missing something, please help me, but I don’t quite see what you are getting at. Regards.
No big point – it just seems odd to me that there’s such a big hole on the map. As to 318, 597, etc, I haven’t seen any information on them in the Pleistocene – so the practical hole in the map for Pleistocene studies is even larger than the hole in the drilling map. If you can identify any Pleistocene information between New Zealand and the Galapagos, I’d appreciate it.
The point is not just that more sampling is better – it’s that there is a very large hole in the Pacific map in an area that is a salinity bulls-eye. It’s possible that there are some unprocessed Pleistocene cores from the older drilling. A high-resolution analysis might be an interesting project for someone like Alicia Newton or Julie Richey.
Is this any good?
Click to access 375.pdf
Call me crazy, but on your lower map of the ODP programs shows cores 75, 597, 598, 599, 600, 601, 602, and 319 in the area of interest. I assume you’ve checked them out and they don’t have what you’re looking for?
At least some of these contained Globigerina spp., see here. The records are kept at the University of Arizona, the index is here. They are in the PForams section, and the 597-602 series are from leg 92 of the Deep Sea Drilling Program (DSDP). They are numbered by the leg and the core, eg “92601”.
w.
Thanks but no cigar that I can see. Neither reference has relevant information that I could see on the Pleistocene.
Steve,
This link to the Lamont-Doherty core repository might help with finding relevant cores (http://www.ldeo.columbia.edu/res/fac/CORE_REPOSITORY/RHP1.html). It will take further hunting to track down data, but this is a start.
SteveM,
Also try searching the United States Geological Survey website. Dr. John Barron, of the USGS is a co-author on my husband’s paper and he was involved in the Deep Sea Drilling Project. Here’s an download page I found just googling his name+ Deep Sea Drilling Project on the web:USGS publications and data Maybe you can be more specific and search the USGS site for exactly what you want.
#4
Unless there are data points linked to that salinity high, it is essentially a computational artefact of the gridding algorithm.
We have this problem all the time when gridding geochemical or geophysical data – generally edge effects at the data limits. Given all the cores subsequently posted, there is still a total lack of data points corresponding to the salinity bulls-eye.
So unless Steve or anyone can provide data coincident with that salinity high in the SE Pacific, the bulls-eye remains a highly spurious computation artefact. It is fiction!
Before digital computing became commonplace, hand-contouring of the data could never have produced that salinity anomaly, simply because there was no data at the point.
I suspect the grid was computed by some variant of Kriging – well known to produce spurious bulls-eyes where there is no data.
Problems arise when the computer model is assumed to be physically reality which the unwitting then interpret the bulls-eye as signficant, when it isn’t.
If I were an astronomer or astrophysicist, I would propose that the salinity bulls-eye would point to the existence of a black-hole at the area. Anything is possible in fiction-land.
#11. Louis, you’ve misunderstood this. The salinity high is real and measured – it’s at surface. What we don’t seem to have is ocean cores with high- medium resolution Pleistocene information in this area stratching from about 15S to Antarctica and from 100W to 170W.
The area has low precipitation, and high temperature according to Legates and Willmott climate grids. It could have something to do with evaporation, but I have often wondered about the reliability of data in that part of the ocean too.
Some information on collation of L&W data is here.
#13. Again, I’m not disputing the climatology here!!! What I’m observing is that we don’t seem to have ocean sediment cores in something that has an interesting climatological feature.
Reference: Hollis, C.J., Mildenhall, D.C. & Naish, T.R. 2002: Orbitally-influenced deep sea record of terrestrial vegetation response to the mid-Pleistocene climate transition, offshore eastern New Zealand. Western Pacific Geophysical Meeting, Wellington, New Zealand. Eos, Transactions, American Geophysical Union, 83, 22 (supplement), WP19.
Click to access HOLLISetal2002.pdf
#15. That hole is at 175E and 44S so it’s just off the Stott map and quite a distance from the salinity high. This is probably pretty close to Bob Carter’s ocean sediment holes which I discussed on an earlier occasion and will revisit at some point.
SteveM have you considered submarine volcanos in that spot?
For instance re: #16 that hole is an island
uninhabited Antipodes Islands complete with volcano
Latitudeude: 49.68°S 49°41’0″S
Longitude: 178.77°E 178°46’0″E
volcano information
Map of Antipodes Islands (island(s)), New Zealand
This map shows the bullseye area (?) w/volcanos marked: pacific map Click on the subregions under this map and it will take you to another page with a map, then click Volcano List on the left and it will give you longitude and lattitude of each volcano in that area.
Oh darn, re 17 I meant the main map here:volcanos of the world The other link is also good-it is the pacific so just click on the volcano list.
Sorry again, I know “volcanoes” -what I get for being up so early!
RE: 120W and 20S
I believe the East Pacific Rise passes near there. Lots of black smokers.
The salinity high appears to be somewhat to the north of Easter Island on the east and Pitcairn Island on the west.
SteveM, there is an anomalous area called Easter Micro plate (that rotates? weird!) Easter Microplate
This page mentions SeaBeam (1983), SeaMARC II (1987), GLORIA (1989), and NAUTILE (1993) maybe looking up these projects you can find more information about that area?
And if you google Pitcairn + volcanoes there’s articles and papers as well.
#12
Thanks Steve for the correction – I tend to automatically assume when you find a hole in data that it’s directly related to the map. Serves me right for a quick scan of the post without reading it fully. (I tend to scan the blogs during lunch-break as right now it’s the only time I have, lunch being the time it takes to eat some sushi rolls and a japanese salad ;)).
That said I wonder if there is a dataset available for those salinity measurements?
I would also have a look at a world geomagnetic map and see what it shows – pity we don’t have datasets for the earth’s electric field – as well as gravity.
In any case it remains highly anomalous – I would have initially thought higher alinity would be as a band around the equator rather than ‘down there’.
There also should be cores down in that region, from memory the Challenger expedition?