John Bell has posted some comments on a thread here about a recent poster and GRL article by Holgate on sea level rise. Here’s something that caught my eye.
Holgate reported in his poster that sea level rose more in the first half of the 20th century – an observation which is not mentioned in AR4 as far as I know.
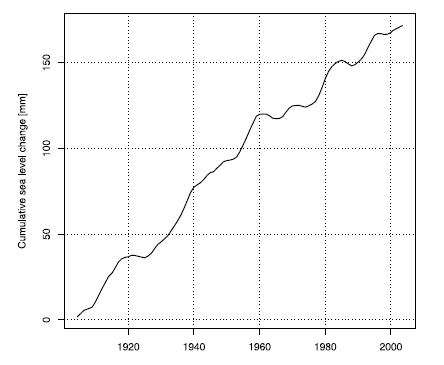
When the decadal rates of change are integrated over the entire twentieth century we obtain the figure on the right. Sea level can be seen to have risen around 170 mm on average over the past century. The mean rate for the twentieth century calculated in this way is 1.67⯰.04 mm/yr. The first half of the century (1904-1953) had a slightly higher rate (1.91⯰.14 mm/yr) in comparison with the second half of the century (1.42⯰.14 mm/yr 1954-2003).
There is a slight difference in the last part of the image between the poster and the GRL article, which was observed by John Bell. The GRL version has an uptick at the end that is not present in the poster, which, as noted below, is a result of the incorporation of additional information in the final article, which is the final version.
 |
 |
Now here’s a figure that intrigued me – a graph showing the rate of change. The version below is the GRL version – the poster version is a little different.

Holgate 2007 Figure 2. Comparison of the global mean decadal rates of sea level change based on the nine records with the rates from the 177 stations used in HW04. All rates are corrected for glacial isostatic adjustment and inverse barometer effects. The shaded region indicates ⯱ standard error.
Doesn’t it look like there’s something like an 11-year cycle in this? Remind you of anything? I know that it’s a bit of a mug’s game trying to identify solar cycles, but here’s a plot of sun spot numbers in the same period. The maxima and minima of the solar cycles seem to match the fluctuations in sea level rise rather uncannily. While the resemblance is impressionistic (I don’t have a digital version of Holgate’s series), offhand, I can’t think of any two climate series with better decadal matching. I think that this resemblance is pretty obvious. Notwithstanding this obvious resemblance that surely deserves some commentary, Holgate does not even mention the word “solar”, but does mention volcanic forcing.

Figure. Sun spot numbers from ftp://ftp.ngdc.noaa.gov/STP/SOLAR_DATA/SUNSPOT_NUMBERS/YEARLY
Update: In response to an inquiry from a CA reader, Holgate gave the following response on solar/sea level connections:
Holgate’s response:
Many people have tried to link climate variations to sunspot cycles. My own feeling is that they both happen to exhibit variability on the same timescales without being causal. No one has yet shown a mechanism you understand. There is also no trend in the sunspot cycle so that can’t explain the overall rise in sea levels even if it could explain the variability. If someone can come up with a mechanism then I’d be open to that possibility but at present it doesn’t look likely to me.
If you’re interested in solar cycles and sea level, you might look at a paper written by my boss a few years back: Woodworth, P.L. “A world-wide search for the 11-yr solar cycle in mean sea-level records.” Geophysical Journal of the Royal Astronomical Society. 80(3) pp743-755
You’ll appreciate that this is a well-trodden path. My own feeling is that it’s not the determining factor in sea level rise, or even accounts for the trend, but there may be something in the variability. I’m just surprised that if there is, it hasn’t been clearly shown yet.
Reference:
S. J. Holgate, On the decadal rates of sea level change during the twentieth century, url


53 Comments
The story of climate keeps getting curiouser and curiouser. Very entertaining. Every new bit of information revealed makes more of a mockery of the “science is settled” camp every day.
Instead of eyeballing, why not ask Holgate for his data and do a real comparison?
#2 GS
why don’t you just ask phil jones for his data nd methodology and then we’ll all know what a can of worms (euphemism for crock of s**t) the HADCRUT instrumental temperature data is?
KevinUK
#2 GS
And also Gary, would you like to answer some of the questions you’ve been asked please? If you don’t we’ll start to think that your not the real Gary Strand but a pale imitation of Steve Bloom instead.
Kevin
Re: 3 and 4
I’m not interested in folks who are interested in personal attacks and nonsense.
#5 GS
So asking you to answer at least some of questions you’ve been asked on this blog is an ad hominem (or nonsense)? I’ll admit that #3 is an ad hominem on Phil Jones but given the fact that I am a UK tax payer and that he is (IMO deliberately) preventing his data and methods from being audited for fear of criticism, then I think I’m entitled to critise him.
KevinUK
Eyeballing can be deceptive, but it appears that sunspots lead level in the time domain. However, there is likely some low-pass filtering/smoothing of the data which could obviously affect the lead-lag relationship. Otherwise, digitizing the data to evaluate might be worthwhile.
Steve M,
Spectral coherence (phase and frequency) between two time-series is easy to test using R. You should try it on these data. I think the result might be compelling. (If you post the data in a table, I’ll post a script that does the analysis.)
Reminds me of these double-peaked solar cycles.
http://science.nasa.gov/headlines/y2002/18jan_solarback.htm
http://www.space.com/scienceastronomy/astronomy/solar_max_020123.htm
The maximum of 1990 is suspected to be double-peaked, and this seems to be reflected by the fact, that the sea level peak shows a shoulder in 1990, and another maximum later on.
Double peaks also somewhere around 1948 and 1915, it seems.
Very interesting.
Re #5:
Gary, what do you think of Gerald Browning’s suggestion in post 11 of the “Exponential Growth in Physical Systems” thread?
#3. I might, but I’m working on a few other things that are higher in my present priority. You know, it would be nice if GRL actually applied AGU policies on data archiving which, on paper require authors to archive data published in AGU journals (a policy disregarded by climate scientists.)
This is a blog and, if I want to chat about something that I noticed, I often do so. That doesn’t mean that this is my last take on a topic.
Re #7 (a crosspost with #8): a plot of phase coherence will quantify the lead-lag relationship.
Re #2
Gary that would be right. Dr. Holgate might be enthusiastic.
Re #7
Hats off to Hopalong.
The cyclical sea level may be due to slight variation in Earth’s rotational speed.
A solar cycle affects the solar wind, which affects the outer atmosphere, and there is conjecture that this (slightly) affects the rotational speed of Earth. I am unsure of the extent to which this has been established or refuted.
Re: #1
This information, in general, is not necessarily that new and vague references where made in the IPCC summary about decadal variations in sea levels — as I recall. The fact that it was not directly dealt with in that report, however, makes that process, not so much a mockery, since it should appear transparently obvious to most observers what they are doing, but more and more like an adversarial court case where only one side of the case is presented.
re: 14 maybe also look at gravity and the “equatorial buldge” research as well. They are still trying to figure all that out; how it all works and may even apply to sea level changes (?)
re: 14 maybe also look at gravity and the “equatorial buldge” research as well. They are still trying to figure all that out; how it all works and may even apply to sea level changes (?)
Perhaps sea level changes might be extracted from data on rotation changes? Rotation changes are known very well. If they pair up well it would be interesting.
In case anyone finds it useful, I have overlayed the sunspot cycles on the rate of change chart using elementary graphics manipulations.
The coincidence is good except for the last sunspot cycle. Note also that the sea level series are decade mid-point, so the sunspot series should be read as displaced 5 years to the left.
Chart is here.
#15 – Given that the State of California has taken action against car manufacturers for carbon emissions, I wonder whether there’s any way that car manufacturers could take action against the IPCC to provide definitive proof of their claims? Can one actually sue the UN?
Re: 12
Thanks. I understand and agree (and there are other methods for phase determination as well).
My intended point was that if raw data from the two independent sources were processed with different low-pass filtering or smoothing schemes, relative phase relationships could be affected. Raw, unsmoothed data from both sources is needed.
I come at this from electronic signal perspective, where low/band/high pass, etc. filtering is used (and the selection definitely affects phase). I have no knowledge of practices in this area. Perhaps there are standard methods that everyone uses as a convention, so the concern I raise is really a non-issue.
People may, or may not, enjoy my ‘BBC interview’, The Art of Climate Science, which I’ve just posted.
Names have been changed to protect the guilty! See if you can spot anyone you know.
From what little I know of sunspot numbers from another interest. If you are using “smoothed” sunspot numbers they are a 13 month windowed average and have a 6 month delay in the final values. That is a June number will range from December of the previous year to the December of the given number.
I hope that this is helpful.
Interesting thought, and I wonder as well. When filtering a time-domain signal, we signal processing folk have to account for filter delay, do the smoothing operations do the same? Do lead/lag anomalies correspond with filter length in general? Curiosity…
Mark
The relationship is rather astonishing. Thank goodness for some inquiring minds here. I wonder if the current climate science gate-keepers will jump at the chance of making a breakthru in understanding the climate from something like this? More likely they’ll try to censor or just sneer at it.
My first impressions are that the sea level varations are direct thermal expansion of ocean waters and/or changes in global sea-level barometric pressure. Wonder what a plot of global, or at least sea-level air pressures look like compared over the same period?
RE 14: David_S says:
David, that ties in w/something discussed here (and a link to a study of rates the earth’s rotation had changed recently) many months ago — sorry no link. IIRC, depending on the state of the solar/earth magnetic field coupling, the interactions can apply a current thru the earth’s field like a dynamo or motor, torquing it along the magnetic field axis & (very slightly) speeding or slowing the earth’s rotation. The total amount of work done wasn’t insignificant, but to us it seemed like the energy would be dispersed as friction and current hysterzcises in the earth’s molten core, and if so, negligible in terms of heating the atmosphere. But that’s as far as the discussion got.
Smoothing operations are non-causal, Matlab help helps:
help filtfilt
22: LOL
The built-in functions, such as filter or filtfilt with Matlab, do account for phase. I believe Rutherford, Mann, et. al. uses the filtfilt function (been a while since I perused their code).
Causality really isn’t an issue with pre-acquired data, however, as you do have the future data available for a given data point output.
Mark
It would be useful to plot the rate of change in CO2 concentrations and see if there is any correlation. And if there is a correlation does it lead or lag?
#28
Yes, so if filtfilt is used, the problem mentioned in #7,#21, #24 is not an issue, as there is no phase distortion.
True. Zero-phase filter cannot be causal (*), that’s why mentioned the term.
(*) ok, there is a trivial case..
OK – so what? Sea level “pulses” in time with sun spots. This tells us ABSOLUTELY NOTHING about whether sun spots are involved in the long term increase – it only tells us they mey be involved in an ~11 year cycle on top of the long term increase.
The implication in many of these responses that climate scientists ignore solar is amazing to me – of course there are solar signatures all over the climate record, and of course climate scientists are aware of those. But, the question is not whether solar can affect climate (it can) but whether the recent observed increases in temp, etc are due to CO2 (and, as part of that question, not solar). Those are different questions, and they are often conflated on this site.
Re #31 Lee says “The implication in many of these responses that climate scientists ignore solar is amazing to me – of course there are solar signatures all over the climate record, and of course climate scientists are aware of those.”
Lee,
Please enlighten us as to what percentage of 20th century global warming was due to the sun and what percentage for CO2 rise?
Reid, I refer you to AR3, the AR4 SPM, and in a short while, AR4. Meanwhile, since you didn’t respond to the primary issue in my post, let me once again point out that an 11 year solar-correlated cycle superimposed on a long term increase tells us nothing whatsoever about the causes of the long term increase.
I linked to it more than one month ago.
http://motls.blogspot.com/2007/01/sea-level-rise-slowed-down-in-last-50.html
Are you getting Benny Peiser’s CCNet? It’s quite useful, Steve!
re: #33 Lee,
They don’t necessarily tell you anything, but they may. First you have to ask yourself what exactly is the mechanism by which the solar cycle can affect sea levels to the degree demonstrated. The y axis in Holgate figure 2 is in mm/yr and appears to be in the range -2 to +7 mm/yr. This is the equilivant of 3-5 years total sea level rise. Thus it’s not small, particularly when we consider that there’s a built-in sea-level rise which has been going on for thousands of years. I don’t know what the mechanism is, but I think it likely you don’t know either. In that case we need to be careful in assuming that we know hCO2 is the cause of GW which is in turn the cause of sea-level rise.
Re #31 Lee
If there was a common understanding among climate scientists of why these pulses are as large as they are relative to the very small changes in solar output, I would be more likely to agree with you. As of yet the field of climatology is a immature science. I don’t even think we know if these pulses are a solar induced phenomena. The physicists are stepping up to the plate with some major experiments, CLOUD being one of them, that will resolve many of our questions. In five years we might know much more than we do today about cloud cover and climate and the sun.
Large estimates of the impact of CO2 changes are primarily due to the small estimates of the impact of every other factor in climate change. In the meantime lets build safe nuclear power plants, battery powered cars, and hang our clothes out to dry. Plenty of good reasons not to waste!
#35 & 36. You correctly point out that the oscillations are large compared to the mean rise in sea level. It could well be that the slow rise of ~ 2mm/year is due to a secular trend in the solar flux that is in addition to the 11 year sunspot cycle. That would be roughly consistent with the claimed increase in TSI as observed by the ACRIM satellite though there is some dispute about whether the increase is real or a calibration error.
Lee, can you point me to the discussion of Solar influences in the draft AR4? I have not had a chance to do more than look at the Table of Contents, and it doesn’t stand out.
RE: #31 – I ask the following question seriously, I am not being sarcastic.
Other than the “coda” of the great melt of yore, is there in fact a global sea level rise at all?
Follow on question would be, if this “coda” were subtracted out, what would the graphs likely look like?
We don’t care about global sea level rise in Holland, we only care about local sea level rise.
Which was 14 cm in the last century, without an observable accelleration in the trend.
As near as I can tell, the modelers calculate how much of the past warming was due to CO2, as guessed at by their models.
They then declare that the rest must have been from the sun.
If I haven’t miscalculated, then the solar influence on sea level is quite simple:
The mixed layer of the oceans is quite homogeneous for (local) temperatures and is about 100 m (25-200 m) thick.
The 11-year solar cycle is visible in the sea surface temperature (SST) as a sinus wave of about 0.1 K amplitude (mainly as result of changes in cloud cover). For a 100 m thick layer, the change in volume would give a change of about 10 mm in about 5 years time (expansion rate 0.1%/K), or an average 2 mm/year up and down…
The fact that the seawater level increase is higher in the first halve of the previous century than in the second halve points to a higher seawater temperature increase in the first halve. As the first halve anyway is dominated by a firm increase in solar strength, this means that at least halve of the warming of the previous century is solar induced…
Of course, this is a rough calculation, but interesting to compare sea levels with measured sea surface temperatures.
re: #42
Makes perfect sense to me. I wonder if anyone who’s taken the appropriate courses in the subject could say if this is the texbook explanation of what happens or if the topic even appears in a textbook?
RE 31: Lee
Just offhand, one possibile opportunity is to get a better understanding of the scale of the solar 11-yr cycle’s effects compared to other forcings, as some others hinted. But despite whether this ultimately is important or not, you apparently don’t have any scientific curiousity about it (because it’s not CO2-centric?). Thanks for confirming my guess about predictable reactions to it.
Some comments from Simon Holgate via a CA reader, which I’m also going to add into the post as an update:
First on the issue of the difference between the poster and GRL version, he said that the GRL figure simply represented the incorporation of more recent values into the work-in-progress and objected to John Bell’s comment. Under the circumstances, I think that John should withdraw this comment. Holgate:
The reader asked Holgate the following question:
to which Holgate answered:
The reader also asked:
Before pointing to the similarities in my post, I had noted that attempts to find connections to the solar cycle were generally a “mug’s game”, but the low-frequency correlations here certainly looked better than what I’m used to seeing in proxy studies. Holgate’s response:
He also said:
I have two thoughts on the connection between the solar cycle and sea level rise. First, Svensmark has shown a clear mechanism for solar modulated GCR flux to change cloud cover and has tied that to observational changes in cloud cover matching changes in GCR flux. Second, if the cloud cover changes have the expected effect of increasing cloud albedo, then there should be an expected change in oceanic heat content that would follow the changes in GCR flux, althought they would likely lag the solar/GCR cycle by some period of time. Second, if there is a change in oceanic heat content, then the thermal properties of water would dictate that the sea level should rise and fall by some amount in accordance with the change in oceanic heat content. That seems like a fairly simple and straight forward mechanism for the solar cycle to have a causal relationship to sea level change. Everybody has ignored the solar/GCR/Cloud hypotheses since there was no experimental evidence of the GCR/Cloud link. Now that Svensmark has shown experimental evidence of the mechanism from the SKY experiment, I can’t see how climate scientists can continue to pretend that there is no link between climate and the sunspot cycle.
One other thought…since about 1850, the intensity of the earth’s magnetic field as measured by it’s dipole moment has been decreasing at a significantly faster rate than prior to that time, and has declined by almost 10% since ~1850 (See Gubbins et al 2006
).
I am not a geophysicist or an oceanographer and don’t have a specific mechanism in mind, but is it possible that such a weakening of the magnetic field could result in a long term rising trend in sea level?
Re #46,
Here is the graph, comparing ocean heat content and sea levels. As you can see, there is a pretty good correlation between these two, and GCM’s have more troubles to follow the real trends…
The connection between the solar cycle and volcanic at one side and ocean heat content/sea level is not so clear in this graph, but it is only over a few solar cycles…
Sorry, forgot to reduce the size of the picture…
I wonder if one of the reviewers for Holgate’s article told him that policy was that post 2004 data should not be used, like the IPCC embargo on post 2004 data that Gray talks about. That he should assume the trend from 1910 to 2000 continues unchanged, not being able to use post 2004 data to guide him, and that explains the changes in his sea level charts? Pre publication to postpublication that is. I would ask him myself but am not sure this is a reasonable question.
RE 45: Holgate is quoted:
The 2nd sentence seems like a slap in the face of Occam. Coincidence? Come on…
Also, what is he talking about with no trend in sunspot cycles? There are all kinds of VERY well documented trends in sunspot cycles at several scales. Perhaps he can provide more explanation of exactly what kind of trend he is looking for that he doesn’t believe exists?
I am sorry I don’t follow every post. Obviously my #49 was answered in Steve’s post #45. I never meant to imply that Mr. Holgate had reworked the tails of his graphs without reason. If I knew more about sea levels I would have known that 2005 to 2007 are trending up as his answer indicates. That I was shocked only goes to show how unreasonable it was for me to put any faith in a ten year trend and that I knew nothing of the last three years data. I never suspected Mr. Holgate of anything dishonest. It is painful to me that he thought I had implied it and that Steve M. agrees. That wasn’t my intent. Somehow it seems too late to mention that I liked Mr. Holgate’s work.
It is interesting to look at Dr. Holgate’s paper and the draft of the correction to the Lyman et al. [2006] paper up on Dr. Pielke’s site. Do these papers allow us to determine how much sea level rise can be attributed to melt and how much to thermal expansion over time? Perhaps we now have data good enough to make the attempt.
4 Trackbacks
[…] andere wetenschappers vinden een verband tussen het klimaat en het aantal zonnevlekken. Oceanograaf Simon Holgate ontdekte dat de zeespiegelstijging tijdens de 20-ste eeuw sneller ging tijdens periodes van hoge […]
[…] I said it’s been doing the rounds for a while now. It was picked up (among others) by climateaudit, jennifermarohasy and wattsupwiththat. Amusingly, all three had a go at twisting it into […]
[…] zaś gładko przechodzi do poziomu mórz i oceanów. Na podstawie pracy S. J. Holgate’a opisanej początkowo na Climate Audit, Archibald stworzył wykres korelacji pomiędzy ilością plam słonecznych, a 10-cio letnim […]
[…] a copy of the thirty-year-old Woodworth study, and a hat tip to Dr. Holgate and Steve McIntyre at Climate Audit for the lead to the study. Dr. Holgate is well-known in sea level circles, here’s his comment […]