I’ve posted on several occasions on the deletion of the “inconvenient” section of the Briffa reconstruction. Now that the review comments are online, I want to reprise this, just so you can understand the IPCC process a little better. This repeats some earlier material.
As an IPCC reviewer, I
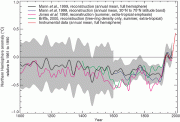
Show the Briffa et al reconstruction through to its end; don’t stop in 1960. Then comment and deal with the “divergence problem” if you need to. Don’t cover up the divergence by truncating this graphic. This was done in IPCC TAR; this was misleading. (Reviewer’s comment ID #: 309-18)]
In response, IPCC section authors said:
Rejected — though note divergence’ issue will be discussed, still considered inappropriate to show recent section of
Briffa et al. series. 👿
Once again, here’s what they were deleting and what they felt was “inappropriate” to show the public – the post-1960 decline in the Briffa index. (I’ve shown the IPCC TAR version here but the same deletion is made in AR4). By deleting the adverse segments, they enhance the rhetorical impression of the remaining series. Any mining promoter that did this would be in trouble with the securities commissions.
 |
 |


45 Comments
How can they defend this as being “inappropriate?” It is “inappropriate” because it goes outside of error bars? It is “inappropriate” because it goes down when it should go up? Why is the pre-1960 Briffa reconstruction more appropriate than the post-1960 reconstruction?
This is rather a strange way for the peer-review process to work, referee say you need to include all your datasets and authors say NO. Typically, a referee would tick the rejection box and then get back to work.
Are referees providing oversight in this process or not?
Re #2
I agree. Reading through the comments in one chapter, I found myself thinking how futile was the remarks of the reviewers. Frequently the authors would decline a comment without any explanation other than the comment was wrong.
There was no compulsion on the part of the authors to deal with substantive errors of fact or (as Steve points out above) substantive errors of omission.
Thus the peer review of the IPCC is exposed as a sham. Why should PhD candidates have to go through so much opposition to substantiate their theses while IPCC authors get away with “Decline. The comment is wrong”
Why any productive scientist would want to engage in the IPCC process is beyond me. There must be better uses of their time than this.
re#3.
I loved the comments on capitalization and English versus American usage of commas.
Some of these dolt reviewers acted like copy editors and cheerleaders.
Notice the enhanced LIA in Briffa as well… They had to delete the post-1960 data: it lends credence to TWO of their “non-issue” topics, divergence and LIA.
Mark
“inappropriate” = “inconvenient”
Do you have a link/address to where the review comments are online?
In the “IPPC Review Comments Now Online” thread.
Mark
re#4.
“I loved the comments on capitalization and English versus American usage of commas.”
Actually reviewers have also to act like copy editors (butnot like cheerleaders). As an Englishman working in the US, trust me, there are lots of fights about spelling in biochem.
I’m curious about the use of the language: “still considered inappropriate”. What was the previous reason it was considered inappropriate?
Monkeying with the original data by the IPCC isn’t confined to tree rings. See this article dealing with sea level changes which is also reprised on the icecap site.
And there’s more to come. Wait to you see what is being done to the Version 2 “adjustments” to the USHCN data; coming soon to an internet site near you.
I was reviewing the differences between the raw data from a couple of stations that I’ve had a working relationship with in years past, comparing it to what I’ve seen of what is purported to be the revised data from these same stations. All through this mind-blowing experience, an old Melanie Safka song from the early 70s kept running through my mind; “Look What They’ve Done To My Song, Ma”
It looks like the tangled web-weavers are unable to control their passion to make data conform to their conclusions rather than the other way round.
What happened to the posting of the graph from earlier today that showed the divergence of the pink and green lines after year 2000? Unless it was an error, please repost. Thank you.
I watched an American PBS television show last night about the Jamestown colony in Virigina. A dedrochronologist took a core sample, and pointed to narrower tree rings as proof of a severe drought – did not mention temperature. This was proffered as a possible factor in the mysterious demise of the colony.
Here is a “web feature” related to the dendrochronologist and the show:
http://www.pbs.org/saf/1301/features/climatology.htm
At page 1 is a nice explication about tree rings with a pic of sample tree rings.
Howeverrrrrr,
The title of the page is “Climatology-Lessons from the Past and the Reality of Global Warming.” Authored by David W. Stahle.
But there is no association here of tree rings and global warming! Well, there are two more pages to the web-posted story, addressing topics having nothing to do with trees or Jamestown.
At page 2 is a discusion of coral reef variability so “we can better understand the natural variability of the El Nino/Southern Oscillation (ENSO), the single most important cause of inter-annual climate variation on the planet.”
Still nothing about anthropogenic global warming.
So later on page 2 “polar archives” are addressed, then too on page three, implying anthropogenic cause of warming, with even a mention of Kilimanjaro.
At the end of page 3 the author wraps up a connection by textual proximity between the tree rings and the other allegations, but without direct statement that tree rings are temperature proxies.
Well worth a read. Shows how “global warming” partisanship seeps in everywhere.
A better question is proving 1 or 2 degrees of change is that bad.
“OF COURSE IT’S BAD, THE CORAL WILL DIE AND THE SEAS WILL RISE ONE THOUSAND METERS BY 2008!”
You must be joking!
“Rejected – reality and actual results are unacceptable and will not be aired here at IPCC.”
If the mainstream media had any real journalists left, they’d be all over this, exposing it for the absolute scandal that it is.
This isn’t science. It isn’t even rampant bureaucracy.
Not funny.
Steve Snip Snip:
You should team-up with David Baines of the Vancouver Sun. He can smell a scam like no other journalist
alive these days. He just wrote a column about these carbon credit scams. You should put a link to his article.
I have asked the oracle at RC about this deletion multiple times. Unfortunately, the oracle refuses to hear my question and it never gets posted.
next week in your theater: “An Inappropriate Truth”
Yes, that’s a good idea actually. Seriously. Why not make a documentary on this, given the funding? Not cheap sensationalist and largely unscientific propaganda like the TGGWS that just plays in the hands of the alarmists, but something that would concentrate on these real questions. It would have to be a long term goal surely? Look at how many million people the TGGWS reached when made available on the net. If a similar documentary was made on these REAL issues, and it got widespread recognition, the alarmist would find it difficult to ignore the points raised, and we might have some real discussion for a change.
No they wouldn’t. They would find tiny things to nit-pick, call us deniers, once again assert the science is settled, and say we need to move on and take action before it’s too late and the forever-sliding ten year window of doom shuts for good.
Harsh words I know, and not the opinion of CA webmasters. Just my thoughts.
[snip – Dec. 2, 2007 the language in this post is excessive and was deleted when brought to my attention].
When things look obvious to me but no one is saying anything (emperor’s clothes?) I wonder if there is something I do not understand. Steve’ graph at the top is a case in point. We now have 134 years of instrumental temperatures that the IPCC tell us are reliable. Yet none of the reconstructions they showed in 2001 or now in 2007 simulate this well for better than 1900 to 1950 ‘€” much less than half the time we have known the temperatures for. Why if they are not in lockstep with the known temperatures do they say they can simulate temperatures 1300 years ago?
RE: #19 – Do it as a viral MP3 then spread it far and wide. Seriously, that’s how I would do it.
#21 Lizi
[snip]
How about Morner’s comments about the sea levels and the sea level satelite data?
How about Reiter’s comments about malaria?
How about the occasionally convenient aerosol problem?
RE13#
“The recession of mountain glaciers has also been particularly dramatic, and the high-elevation tropical glacier found on Mt. Kilamanjaro in Africa may soon disappear completely.”
I can only assume that the author attempts to link ice glacier retreat to AGW, although addmittedly no such statement is explicitly made. This is just another example of “selective literature review” and the unwavering effort to admit uncertainty to the public at large.
#24
Interesting piece by Kevin Trenberth on Nature Climate Feedback.
RE#27, interesting comment by Trenberth:
Why doesn’t Trenberth apply these same rules to hurricane records?
#13
Brian Fagan devoted most of a chapter to this event in his book The Little Ice Age. I do not have the sources on hand, but I beleive a dendroclimatologist from the Univ of Arkansas did a proxy study using Virginia Cedars. He found that the period of the Jamestown settlement was one of the driest North America saw in almost 700 years. That is, the drought occured during the coldest years of the LIA. Spanish missonaries actually settled in the Viginia Tidewater first, but the drought was enough to encourage them to move southward; they eventually settled in Florida.
I also remember reading of a NASA study that blamed the Dust Bowl Drought (1925-1935) on a combination of a negative PDO and positive AMO. In both droughts, Global Warming was not considered a factor. IMHO, even just regional cooling could lead to more drought conditions than with warming. During the LIA, when Northwest Europe was under a positive NAO, the semi permanent Continental High served to divert most storm tracks to well to the south over the Med and N. Africa. During the year 1666, London had very little rain and baked under a persistent Scandanavian high pressure cell. The Great London Fire occured that September. By the next January, it was so cold in Britain that the Oak trees in the Midlands split.
#28
“I beleive a dendroclimatologist from the Univ of Arkansas”
Check out this small print at my link at #13, it indicates the author is from the University of Arkansas.
#28
“I beleive a dendroclimatologist from the Univ of Arkansas”
Check out the small print at my link at #13, it indicates the author is from the University of Arkansas.
There is such a great profusion of information in the various threads of Climate Audit that it is becoming very hard (at least for me) to keep up. I would like to introduce a new issue (at least, I think its new) that I find very troubling. It seems that the Hockey Team is on the verge of a massive effort to replace real data with model generated data. The gridded data provided by the models is so much better than real data, because it is gridded (very convenient). Of course, we already know that the models can replicate the past climate – well, approximately, adequately, etc. – but we don’t seem to know whether the various fudge factors used to model past climate are used in the projections (I assume not because the fudge required to model the 1950 – 70 cooling period would be very embarrassing, if it led the models to show any downward trend. All downward trending runs must be discarded because they are physically unrealizable, and to RC, unreal.) So we are approaching a condition where measurements are meaningless, and shouldn’t even be contemplated. Let’s conveniently forget that AGW was first supposed to appear in the stratosphere (but it hasn’t) and in the polar regions (certainly not at the South pole, where it is getting colder, and South America where it’s starting off as a bad winter – and at the North pole, we are learning that the albedo from space is remaining the same (because of clouds)). The revelation that the Hockey stick was just plain wrong, and that Briffa has a divergence problem (as well as a pretty cool LIA) suggests that, if the Hockey Team is to move on, they had better do it without mixing in unreliable real data. If everything is based on models (almost all of the IPCC data already is, apparently), and all models have positive CO2 feedback and similar climate sensitivity (and the same exponential growth), then they can move smoothly from controlling emissions, to controlling energy, and then to controlling what ? (population ??) These are, indeed, interesting times !
re: #21
The IPCC will almost certainly blame any cooling on China’s industrialization and aerosols.
Please find an appropriate thread for any comments that do not pertain to Briffa.
Steve, it may be beneficial to have forum section of the website. The unthreaded threads are good, but it may be easier to channel commenters’ comments if there were a variety of threads.
That said, thanks for producing this great resources and thanks for your untiring efforts to audit climate-related data.
It’s up to Steve as to whether to host a forum.
Anyone else notice that Micheal Mann seems up set not to see his hockey stick on display?
“The lack of a supporting graphic in the “A Paleoclimate Perspective” section is effectively a slap in the face to
chapter 6 authors. It also sends a disturbing message that AR4 is somehow backing away
from paleoclimate-based claims made in the TAR where the results from paleoclimate
studies were highlighted.”
Anyone else notice that Michael Mann seems up set not to see his hockey stick on display?
“The lack of a supporting graphic in the “A Paleoclimate Perspective” section is effectively a slap in the face to
chapter 6 authors. It also sends a disturbing message that AR4 is somehow backing away from paleoclimate-based claims made in the TAR where the results from paleoclimate studies were highlighted.”
— Michael Mann
RE #36/37,
Denial ain’t just a river in Egypt (and with teleconnections at play, climate conditions in Egypt can be represented elsewhere in the first place!).
Vernon, thanks for the find. I find Mann’s comment very reassuring, because I also thought that this is what FAR was doing in light of their over reaction to the HS in TAR and to low variability temperature reconstructions over the millennium, but when these IPCC people get to equivocating and spinning it is sometimes difficult to conclude what they actually intended. We need to thank MM for pointing out what in effect should be a declaration of at least a partial victory for M&M.
Re: # 37
Mann is a big one for “moving on” and “that’s old news”. Seems possible that the IPCC are moving on from The Stick.
Oh, the irony!
[sigh — Why don’t you read what we have written before making statements like this]
Re #41: LOL!! Beautiful Gavinese!
#32 CK
Sorry Steve I know this is OT but I can’t resist.
snip
RE: #28 – One must also wonder the extent to which the LIA slowed Spanish settlement of NW Mexico and what is now the US SW. You can clearly see where the true deserts of the time were, their extent is equivalent to the current “dry tree line” – for example, as of about 1600, places where there is now greater than 10 in of rain per year, but no trees, such as many parts of the coastal range, the northern San Joaquin Valley, most of Southern Cal’s low land areas, etc, would have looked like the Mojave does today. This is something that irks me about the thick skulled AGW automatons – they just don’t get the association between global (and regional) cooling and long term drought. They portray the opposite association, wrongly, and, if their views were to be believed, the danger signs of an approaching global catastrophe would possibly be ignored.
Why is the pink line so different?
13 Trackbacks
[…] discussion of these issues is at Climate Audit here here here and more recently by Jean S […]
[…] Order Draft, I asked the IPCC in the strongest possible terms to show the decline reported at CA here: Show the Briffa et al reconstruction through to its end; don’t stop in 1960. Then comment and […]
[…] And the fact that McIntyre brought this to their attention as an expert reviewer in the IPCC process: To my knowledge, no one noticed or reported this truncation until my Climate Audit post in 2005 here. The deletion of the decline was repeated in the 2007 Assessment Report First Order and Second Order Drafts, once again without any disclosure. No dendrochronologist recorded any objection in the Review Comments to either draft. As a reviewer of the Second Order Draft, I asked the IPCC in the strongest possible terms to show the decline reported at CA here: […]
[…] Order Draft, I asked the IPCC in the strongest possible terms to show the decline reported at CA here: Show the Briffa et al reconstruction through to its end; don’t stop in 1960. Then comment and […]
[…] 26 Jun 2007: IPCC and the Briffa Deletions […]
[…] line “gets lost” around 1960 and never reappears. McIntyre noticed this in 2005, and raised the issue in a comment on a later IPCC report. His comment was rejected. Page 1 of 2 Next […]
[…] any divergent data, though other subsequent publications (including the IPCC assessment reports [https://climateaudit.org/2007/06/26/ipcc-and-the-briffa-deletions/]) have described the reason for doing so and Briffa’s original paper on the subject […]
[…] graphs appeared to be underpinned by data that mixed apples with oranges. Even in graphs where the actual temperatures were not added, the divergence appears to be artfully hidden as seen in a hockey stick graph […]
[…] het misleidend was om zijn reconstructie af te breken in 1960 om zo de divergentie te verhullen. Show it and deal with it, aldus McIntyre. De reactie van het IPCC (wrs. Briffa) was: Rejected — though note divergence’ […]
[…] other things, the deletion of post-1960 Briffa reconstruction results – see for example here here here, where the lead author (Briffa) justified the deletion of adverse post-1960 results from his […]
[…] discussion of these issues is at Climate Audit here here here and more recently by Jean S here. Jean S and UC report at CA that the puzzling end point properties […]
[…] syntes at blive understøttet af data, som har mikset æbler med appelsiner. Selv i grafer, hvor de faktiske temperaturer ikke var tilføjet, synes divergensen at være kunstfærdigt skjult, som det ses i en […]
[…] regular readers of Climate Audit know, McIntyre had as a reviewer of AR4 asked the lead authors to deal with the divergence problem: Show the Briffa et al reconstruction through to its end; don’t stop in 1960. Then comment and […]