WMO guidelines state that weather stations should be at least 100 feet from paved areas. As we see the USHCN pictures unfold, we’re obviously seeing one site after another in non-compliance with this requirement, a point notably made in connection with Tucson (Univesity of Arizona) site, where the location was particularly gross, but the point is seemingly pervasive. While many of these pictures also show air conditioners, my guess is that the asphalt pavement may prove to be a more substantial problem than the air conditioners.
I notice that GISS apologist Eli Rabett has another post arguing that traditional quality control doesn’t matter – this time arguing that heat rises and thus, for example, nearby air conditioners don’t matter. Perhaps so, perhaps not. Eli’s implication is that WMO policies don’t “matter”, that, in effect, the practical WMO people are just fuddy-duddies, making pointless QC demands that are unnecessary when Hansen’s on the scene with magic adjustment software. While Eli’s implied criticism of WMO policies may be borne out, my own guess is that the WMO guidelines were created for a reason and that they embody useful practical knowledge – that there’s a reason why, for example, WMO guidelines require that weather stations be 100 feet from pavement and perhaps there are even reasons not to locate them near air conditioners.
But today a little more on pavement and specifically asphalt pavement and why it’s not a good idea to locate weather stations within 100 feet of pavement. The radius is relevant since the pavement strongly re-radiates IR and will affect weather stations that are not directly above it.
Asheville NC – ASOS and CRN
Eli has posited the CRN program as essentially a complete answer to the defects of the USHCN record. While I endorse the creation of a valid record going forward, I must say that this by itself does not negate the need to carefully scrutinize the historical record. Having said that, the CRN information can shed light on issues in the historical record. A recent conference paper compares ASOS and CRN instrumentation at an identical site in Sterling VA and between an ASOS station (not a USHCN station) and the Asheville CRN station, only 1.5 miles away. (This paper was cited by a poster at Eli Rabett here.)
The Sterling, VA test showed slight biases between ASOS and CRN measurements under varying conditions of wind, solar radiation etc.
The Asheville ASOS station information here including photo is a site that really looks pretty good in the scheme of things – the sensor is not located directly above pavement, no air conditioners, barbecues or basketball nets.

Asheville ASOS station.
Yet even this very good site had a local warming bias of of about 0.25 deg C, which the authors attributed to “airport runway and parking lots next to the ASOS site” as follows:
At the Asheville site, the effect of siting difference between the ASOS and CRN led to a ΔT_local effect of about 0.25o C, much larger than the ΔTshield effect (about -0.1o C). This local warming effect, caused by the heat from the airport runway and parking lots next to the ASOS site, was found to be strongly modulated by wind direction, solar radiation, and cloud type and height.
The existence of an effect as large as this in what appears to be an exemplary site should give a little pause to GISS apologists for really bad sites, such as Tucson. Indeed, it creates an issue for essentially every weather station which is non-compliant with the WMO pavement policy.
Infrared Pavement Images
Some extremely interesting images and analysis of the infrared properties of different pavements has been carried out by advocates of “cool pavement”. Much of the work has been carried out in Arizona – so the U of Arizona climate scientist who was stumped by the infrared properties of asphalt really didnt have to go very far to find information. Here are two interesting online links pavements4life EPA Cool Pavement Report The images and analysis below are taken from pavements4life.
Here is a remarkable infrared photograph showing parking lots in Phoenix, in which the infrared coloring has a temperature code attached to it.
The first graphic shows the substantial differences between asphalt, concrete and vegetated surfaces in Phoenix. In this picture, there is about a 50 degree difference between the temperature of the asphalt and the temperature of the lawn. In addition to this contrast, note the very sharp difference between the temperature of asphalt and the temperature of concrete, which can be very distinctly seen in the left photograph. Even scrub vegetation lowers the surface temperature. The bare earth has a distinctly lower temperature than asphalt, though not nearly as low as grassy surfaces. As noted in my earlier post on asphalt, the IR emissions (in wm-2) from asphalt surfaces can be extremely high and can hardly be neglected.
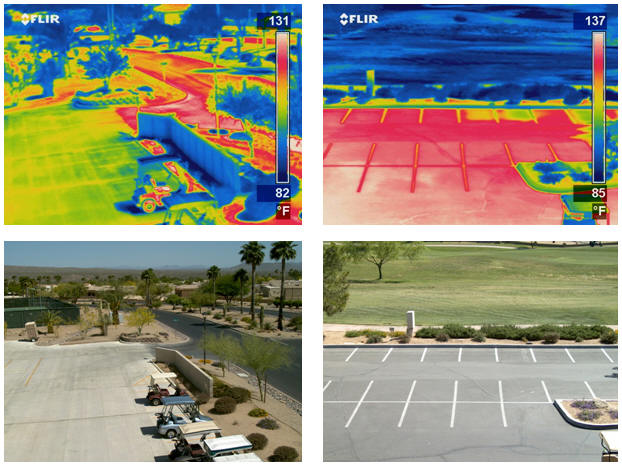
The pavements4life website reported that “asphalt pavement temperatures in Phoenix have reached as high as 172 ⹆.” They showed a marked diurnal cycle in the differential between asphalt and other surfaces in the figure below – a phenomenon that is presumably well enough known in Arizona to have been considered by the University of Arizona meteorology department in locating their weather station not only in a parking lot, but closer to surface than normal.

Another figure at the website shows the effect of wind speed on the daily cycle – in this case, calm is associated with a higher site effect, but the effect is by far the most pronounced on the maximum temperature and NOT on the nocturnal minimum. (Oke is from Vancouver and other effects may well be more important in Phoenix and Tucson.)
Given these known problems with paved areas in Arizona, here, one more time, is the Tucson USHCN station, the site with the greatest temperature trend in the United States. I’ve observed that the temperature history from the Tucson station is very different from the Grand Canyon temperature history and questioned the GISS adjustments.
But the issue here is a little different: I’m contesting Eli Rabett’s implication that WMO policies are, in effect, old-fashioned and that adherence to WMO standards (or not) doesn’t “matter”. And perhaps the WMO rules are not at all that necessary (but this has not been established yet), but there’s not a shred of evidence so far that their rules on pavement are invalid. The Asheville NC measurements show an impact in a very decent site that far exceeds the Jones 0.1 deg C upper limit – the Tucson effect is going to be much much higher.
It should also be noted that the proportion of pavement can vary by city. The EPA study shows the following table, in which Sacramento has a larger proportion of paved (and roofed) area than Houston. So there’s not necessarily one simple formula that fits all cities – population is merely a proxy.


227 Comments
Rabbet should have a good chat with a couple of Turtles I know! 😉
The requirement for a 100 foot distance from pavement needs to be extended to 500 feet when the ground albedo is high, such a deserts or snow covered areas. A few years ago Mims did a study in the desert southwest and found a detectable 0.1 C warming 500 feet away from paved roads. I don’t think this study is still on the internet.
It really “doesn’t matter” that the emperor has no clothes…
The argument that the siting is not important because it is only the trend that matters implicitly assumes that the local neighborhood of the weather station is stable. However, the rachet effect of urbanization means that once an area begins to urbanize it almost always ratchets up gradually to more urban (single family homes get replaced by apartments with a parking lot). But even a piece of asphalt by itself is going to change thermal properties over time as it ages and is then repaved.
As anyone with even a slight trace of life experience will tell you, working next to a building on asphalt is like being in a solar oven compared to working in the dirt lot across the street. Typically the light painted building walls reflect and focus sunlight on your body while the pavement heat radiates up from below. Also, anyone who has piloted an aircraft will tell you about the uncomfortable burble of rising warm air as you cross the fence from adjacent grass to the airport pavement/concrete.
It’s funny that Steve needs to post up a scientific study of what any child or turtle could tell you.
“If Eli is correct, then the implication is that a WMO policy against nearby air conditioners doesn’t “matter”, that, in effect, the practical WMO people are just fuddy-duddies, making pointless QC demands that are unnecessary when Hansen’s on the scene with magic adjustment software. ”
a. There is no standard on WMO standard on ACs. Both Jim and I, the HVAC engineers say that.
b. We spend a huge amount of time here taking pictures and the like and talking about standards, but I’m concerned that we have not even read all of them. Do we have all the WMO instructions? (Maybe we do, I’m just not clear we do.)
Great post Steve! What I find most interesting in the FLIR photos above is that where the parking lines are drawn with paint, the temperature seen by the FLIR is cooler.
Of course Eli and Dano tell us that “photos don’t matter” nor does “paint on shelters” so, umm…well, draw your own conclusion.
I had looked into buying a FLIR at the onset of this project to take IR photos along with visible light ones of stations, but the $10k price tag was too steep for me to ante up on my own since I don’t have funding.
I may rethink that because I don’t recall ever seeing an IR photo of a Stevenson Screen or MMTS in situ and near other potential +/- biases.
RE5 actually there is a standard in the CRN on artificial heat sources, and anyone would agree that an A/C condensor is an artificial heat source. Here is the spec:
Class 1 – Flat and horizontal ground surrounded by a clear surface with a slope below 1/3 (3 degrees.
Class 2 – Same as Class 1 with the following differences. Surrounding Vegetation 5deg.
Class 3 (error 1C) – Same as Class 2, except no artificial heating sources within 10 meters.
Class 4 (error >= 2C) – Artificial heating sources = 5C) – Temperature sensor located next to/above an artificial heating source, such a building, roof top, parking lot, or concrete surface.”
Class 5 (error >= 5C) – Temperature sensor located next to/above an artificial heating source, such a building, roof top, parking lot, or concrete surface.”
Note that you won’t find CRN sites at Class 3, 4, or 5 locations. They aim for Class 1 siting for obvious reasons.
Hmmm, I have an idea, stay tuned.
Great post, the on going effort of Steve and http://www.surfacestations.org should be commended by all.
Also TCO you’ve start using ‘We spend a huge amount of time here taking pictures‘; which would imply you have made contribution; other that sniping what have you contributed. Of course, I would love to see a positive contribution from you, even if it is a fair criticism of the results of methods.
(Maybe you do, I’m just not clear you do.)
As mentioned, concrete and asphalt tend to change over time. Concrete gets discolored (darker) from oil, tire wear and sometimes asphalt tracked onto the concrete – see the top photos, the ones with golf carts, and notice the discoloration already underway at the parking lot entrance. Note the higher temperature of the discolored entrance.
In the U of A photo, note the difference in color between the new sidewalk and the older concrete next to it to see what is probably an aging effect. Also, the adition of the new sidewalk may well have affected the temperature sensor when it was added, based on what is written above.
Conversely, asphalt tends to lighten over time which may introduce a cooling trend.
There are also factors having to do with the contact between the paved surface and the ground beneath it which change over time, generally in a warmer direction. There is a hint of that in the lower photo of the asphalt parking lot.
It’s a mess – the bottom line remains that the sensors should be away from human activity, including pavement.
Anthony, I thought they said “large industrial heat sources” and didn’t define large or industrial. But both Jim and I would not think of ACs as in that class. In any case, can you link to that or give a proper citation? (Steve doesn’t in this essay.)
P.s. Nor does he link to Eli’s blog (or give a citation.)
A point which people should bear in mind – I view the impact of this analysis more on non-US sites than on US sites. For example, here is a graphic comparing US and non-US temperature recently quoted by Eli Rabett. If you visually compare this to the grapihcs shown above, the USHCN-based composite for the US is broadly speaking similar to the Peterson-rural based raw data – warm 1930s, warm 2000s, while the ROW trend on the right is broadly similar to the major city trend in the US.
My impression is that the rest-of-world data in places like China or Indonesia is primarily from what would be “major cities” – i.e. they are at least Milwaukee, Cincinnati size places, and the possibility should be entertained that unadjusted raw data of the type used in the rest-of-world GHCN might be derived from stations that bear a closer resemblance to those in the US “major city” composite than in the US rural networks.
A couple of slight edits to the above post reflecting some of the suggestions above.
Anthony,
PG&E has used FLAIR Cameras in the past to look for energy leaks in homes. Mybe you can borrow an IR Camera from PG&E, or arrange for a home survey and then have them image your shelters. For non California readers, PG&E is our local power company.
It’s a fundamental principle of Quality Management that you can’t test in quality. The system must be designed to produce quality, not adjusted after the fact.
CO2 Theory
The Keeling “curve” shows an annual increase of CO2 of about 0.4% from 1956 through 2004.
Asphalt Theory
Asphalt production in the US is currently growing at about 2.3% annually.
Most sensible people note the rise in temperature measurements over time and attribute some of it to the rise in greenhouse gases. Surely we should likewise attribute some of it to the rise in asphalt too.
Anthony said:
Is it possible to rent one for a few days and highlight a few sites, such as photographing a relatively good site and also a poor one?
Anthony I have access to a good IR camera. Next weekend I’ll drive to the Liberty TX USHCN site and take some IR photos. That site, though, is rather mundane but who knows what might pop up under IR.
If it works well then I’ll consider bringing it with me when I do some of the lower Mississippi Valley sites later this month.
“a phenomenon that is presumably well enough known in Arizona TO HAVE BEEN considered by the University of Arizona meteorology department in locating their weather station not only in a parking lot, but closer to surface than normal.”
Does that mean, “that it should have been” or are you implying that the site was deliberately constructed to have contamination?
Also, the location of the asphalt research in Arizona is irrelevant (people learn from the net). Perhaps, based on living in Arizona, and feeling the hot asphalt on your toes or the heat on your face when walking off of grass to road, is what you mean?
Sorry, for the style comment, but something about the way you write, makes it really dense and hard for me to engage in without parsing it all. (Also that if I “get it wrong” and counter-argue, you will be exasperated, so that I have to ask all these clarifying questions, first.)
Does anyone have access to something identical to USHCN instrumentation? That’s mobile? Request permission & find a spot (preferably a park) near that U of A site. (Heck, knowing universities there’s probably a spot on campus.) Going through the group that’s already doing studies of asphalt might gain the necessary access.
I’m going to go read the conference paper and the asphalt reports. I know Steve hates style comments, but this is a very dense essay and something about how he writes makes it hard for me. I’m kind of straining to define/understand what it is.
What’s with the stuff on air conditioners at the beginning? Is the main objective arguing with Eli (and why is not the first reference to this offending post linked then?) or making an observation on site issues? And is correction the main point or asphalt heating itself. There’s kind of too much stuff in here, if you really get into it. And how does any of it tie back to Eli taking Shleissen pictures of burn barrels or air conditioners? (That’s what his latest post is about.)
Not that it matters, but I wonder about the anonymous poster who made the Eli comment with the conference proceedings. Nigel rides again?
I am not sure that the FLIR photos are correctly indicating temperature. The emissivities of the various substances vary quite a bit. Black asphalt is probably very close to 1 while the grass may be only about .85 or so. Unless the individual areas have all been compensated for emissivity the asphalt will appear hotter even when it isn’t.
I’m not saying that the asphalt isn’t hotter, I’m saying that it probably isn’t as much hotter as the FLIR indicates.
What the FLIR does show is the huge difference in radiated heat from the different substances. After looking at this it’s hard to argue that a temperature indicating device wouldn’t be affected by such a difference in radiated energy, even if the Stephenson box or the MMTS has a nice new coat of white paint (which surveys show is not the case). The effect of the lower emissivity of the latex paint with respect to the older whitewash is magnified by the proximity to highly radiating surfaces.
It would appear that the worst case would be a combination of a bad paint job over an asphalt parking lot and we have found many of those.
Asphalt comes in a great many varieties: subsurface, with for example aggregates from 5-25 mm size, flexfalt with a bitumen fraction of at least 30C higher melting point than the other qualities, used for fixing edge pavingstones and manhole covers. The top surface is usually covered with a 5-15 mm aggregate/bitumen mix, thickness varies, but is always over 30 mm. This layer can be made with light colored basalts which shows up when the bitumen wears off by the traffic. Road surfaces like these, can be almost white, But they store heat and radiate it just as efficiently as the darker types.
TCO, come with me on the job when weⳲe out laying asphalt this summer, you’ll eat those words about Arizona, and I’m in Denmark, on the same latitude as Prince Rupert BC
Funny you’d post about asphalt today, Steve! This morning, I had another conversation with my friend who works at the (Colorado Springs) airport. Items that emerged:
1) Someone questioned whether a temp gradient could be seen within the 100 foot WMO radius. At the airport, they have a string of five sensor pairs (on each side of the runway) over several thousand feet. They can easily see more than a degree of change (measured in tenths) over a thousand feet… so it’s logical that 0.1 or more degree would be detectable in 100 feet.
2) Just to confirm, asphalt color, age, buildup, etc can have a HUGE impact on temperature. Interestingly, they see a wide variety of both heating and cooling effects. The most surprising one for me was that tire-tread-wearoff builds up in the landing/braking section of the runways, and at this (lightly used) airport, the buildup lowers the runway temp.
RE18 David, perhaps I can suggest a couple of alternate sites there within driving distance?
Not that it matters, but I wonder about the anonymous poster who made this pathetic cheerleading comment over at Eli’s blog:
“bunny: nice photos. and thanks for answering Anthony’s camera question.” Thanks for answering _Anthony’s_ question…
The member of the hoi polloi is using the name TCO 😉
http://rabett.blogspot.com/2007/08/trashburning-dynamics-heat-flow-by.html#comment-6128728671316919418
Re #25 Certainly, and I sent an e-mail to you for suggestions.
24-1 makes no sense to me. What is being alleged?
#28,
Mobile temperature measuring stations introduce bias?
http://phoenix.about.com/od/wacky/qt/fryanegg.htm
Can You Fry An Egg on the Sidewalk
From Judy Hedding,
Your Guide to Phoenix, AZ.
FREE Newsletter. Sign Up Now!
Is It Hot Enough in Arizona to Fry an Egg?
There are lots of jokes and sayings about the heat in Phoenix. “It’s a Dry Heat” is one that you’ll hear fairly often. Honestly, when it’s 115°F outside, knowing that it’s a dry heat is not all that comforting!
Another common saying is “It’s so hot in Phoenix that you can fry an egg on the sidewalk.” I always wondered about this one–is it really true? On a hot day in May, I set out to find the answer.
Is It Hot Enough in Phoenix to Fry an Egg on the Sidewalk? Watch this Video!
(Turn up the sound to hear the narration.)
Steve McIntyre
I’m doing a marketing survey and I’d like to know how much you would pay for “Troll-Off”? You spray it on your blog and it automatically repels trolls. In addition, it would make other blogs seem more attractive to them, like say, RealClimate.
Hey SteveM, Thanks. I posted a quote from this study on rabbetts blog this am. Did nt know if
it made it through.
Bloom really ticked me off with his comment about CRN data being available on Rabbetts comments. One afternoon
I sat there trying to download crap month by month.. Anyways, I decided to stuff the
CRN study up the bunny snout. Glad you found it and enjoyed it.
Now, at some point I’d like the bigger brains to take a look at the Oke paper ( oh i cited that
as well over there)
I’m reading it now. It’s dense. I don’t have a week to spend getting up to speed on all the referenced literature or times series statistics themselves, but will spend a few hours giving it a thorough read. We can talk then.
TCO.
I made of couple of anonymous posts this AM on Rabbett. I don’t post there and anonymous worked
for me, so I used it. My posts sited the CRN study ( steveM links above) and I cited the Oke
study on another thread. It was not Nigel. It was me. I think I cross posted one of these to Anthonys
site this morning indicating that I had posted on Rabbett. So don’t blame others.
I didnt post anonomous out of fear, its the only way that worked for me on rabbett.
Next time I will sign off as Mosh-pit when I post there and say something charming so you
will know its me. I could get a google account, I suppose.
TCO RE 34.
Are you refering to Oke? His cooling ratio statistic first struck me as odd, but he made a fair case.
I found the Hurst rescaling interesting.
My interest was having bigger stat brains comment on the approach. Of course I like the conclusion,
but a critical review would be nice.
You asked me to read it, I’m reading it. I can’t comment on Hurst methodology. Can just say where I have questions on parts of his study.
RE 37.
Ok, I was just checking. I will reread it.
RE 20.
You dont have to do that there is a CRN site site at Senora desert.
For grins I went to the CRN site to pull data ( see my comment 33 above)
It was a frickin pain. here is a taste. Quoting myself from the other thread
So, I thought it would be fun do a spot check of sorts.
The new CRN has a station in Tucson at the SONORA DESERT MUSEUM. Its been in operation since 2002.At some pointt somebody needs to
write a program to scrape data from CRN. I did it manually and it’s not fun.
So, anyway. I was thinking How does the New network compare to the old? Since I can’t download the whole record for CRN
I thought I’d just compare 1 month for a few years. Anyone who can figure out how to scrapethe data\from CRN can do amore
complete job.
To wet your appetite Month of June.
University of AZ, Tucson Int (airport), CRN
2002 31.3 31.1 NA
2003 30.3 29.7 29.6
2004 30.0 29.5 29.
2005 NA 29.9 29.2
2006 NA 31.4 30.8
2007 NA 30.1 29.5
So, that is only one month ( we need to write a program to download this stuff)
I picked June for obvious reasons because that is when I expect to see the
assfault signal at its highest
RE 39..
Strike the last word and replace “earliest”
RE 5 and 7.
TCO, The link to the CRN guidelines is below. The passage anthony quotes is
round about page 10. also one can find guidelines for taking photos,
cable length, etc etc.
ftp://ftp.ncdc.noaa.gov/pub/data/uscrn/site_info/CRNFY02SiteSelectionTask.pdf
I have not located the paper cited ( Leroy 1998), but the Noaa document did not have proper
footnotes ( sorry I had to point this out)
There are other gems to be found on CRN site. but I’m not yet inclined to stuff them up the bunnies nose.
Ordinarily he makes me laugh, because his name is Josh ( sorry american idiom joke). I will shut
up now and not risk snippage by the Mohel. ( that’s a joke)
TCO, Here are the “footnotes”
Hmm perhaps some more gems?
Leroy, M., 1998: Meteorological Measurements Representativity, Nearby Obstacles Influence.
10 Symp. On Met. Observ. & Instr., 233-236.
Background: The on-site survey is required to evaluate the pieces of property for suitability and
acceptability, when the Host Organization identifies potential instrument sites.
Local Site Representativity Evaluation (Classification Scheme)
Reference: Leroy, M., 1998, and WMO, 1996.
Local environmental and nearby terrain factors have an influence on…
Leroy might be an intersting read TCO
The effect of rural variability in calculating the urban heat island effect for Phoenix, Arizona, was examined. A dense network of temperature and humidity sensors was deployed across different land uses on an agricultural farm southeast of Phoenix for a 10-day period in April 2002. Temperature data from these sensors were compared with data from Sky Harbor Airport in Phoenix (an urban station) to assess the urban heat island effect using different rural baselines. The smallest and largest temperature differences between locations on the farm at a given time were 0.8° and 5.4°C, respectively. A t test revealed significant temperature differences between stations on the farm over the entire study period. Depending on the choice of rural baselines, the average and maximum urban heat island effects ranged from 9.4° to 12.9°C and from 10.7° to 14.6°C, respectively. Comparison of land cover types of the agricultural farm and land cover percentages in the Phoenix urban fringe was performed with satellite imagery. Classification of the entire urban fringe by using satellite imagery allowed for the local farm data to be scaled to a regional level.
Yes, I think you are doing entirely the right thing to make sure that such stuff is read. We can’t miss a trick that is rather obvious. Would also think it would be helpful if Anthony did an interview with an expert or program manager at WMO. I don’t have a specific complaint, but just a sort of impression that he’s rushing ahead with the census and has not looked at the reference documents and guidance and calibrations, thoroughly.
I’m not going to do it, though. Too tired.
They showed a marked diurnal cycle in the differential between asphalt and other surfaces in the figure below – a phenomenon that is presumably well enough known in Arizona to have been considered by the University of Arizona meteorology department in locating their weather station not only in a parking lot, but closer to surface than normal.
Just back from vacation and VERY far behind. But I am laughing again, big time. ROFLMAO.
TCO: your negativism is outweighing your ego. Read awhile and then post.
Hans Erren # 30
If her thermometer censor was on the blacktop at 3:45PM on a sunny day and it only measured 111 Deg. then it must have been in March when the air temperature is in the 70’s. Let her try the same experiment in August when the air is 111 Deg. and the blacktop is 150.
Okay, it was in May. Let her do the same in August.
Triple Digit Facts for Phoenix (from http://phoenix.about.com/cs/weather/a/weathertrivia_2.htm)
The highest temperatures ever recorded in Phoenix were:
122°F on June 26, 1990;
121°F on July 28, 1995;
120°F on June 25, 1990;
118°F on July 16, 1925, June 24, 1929, July 11, 1958, July 4, 1989, June 27, 1990, June 28, 1990, July 27, 1995, and July 21, 2006.
The average number of 100°F or higher days in Phoenix: 89
The fewest number of 100°F or higher days ever recorded in Phoenix: 48 in 1913
The greatest number of 100°F or higher days ever recorded in Phoenix: 143 in 1989
During the years 1896 through 2000, the first occurrence of 100°F or higher:
The earliest occurrence of >= 100°F: March 26, 1988 Latest: June 18, 1913 Average: May 13
The last occurrence of >=100°F: Earliest: September 2, 1904 Latest: October 20, 1921 Average: September 28
For 110°F or higher:
The first occurrence of >= 110°F: Earliest: May 8, 1989 Latest: August 9, 1915 Average: June 20
The last occurrence of >= 110°F: Earliest: June 5, 1912 Latest: September 15, 2000 Average: August 9
Egg-frying is a distraction…
#5, TCO:
For the record, I’m not an HVAC engineer. I WAS a commercial / industrial HVAC technician for a number of years before I moved into sputter / thin films engineering. Recently, I went to law school.
I don’t think I said there was no std re: A/C, I believe I said the std Steve M posted on the other thread didn’t appear to apply to normal A/C units.
There is no standard on blast furnaces either, but I doubt even TCO would recommend siting a sensor inside one.
It says “large industrial heat sources”. So yes there is.
The sun is large and hot. A blast furnace is small and cold. Air conditioners are insignificant.
What qualifies as large, and why do you believe that air conditioners aren’t?
#53, Mark W.:
Some A/C units are ‘large’, but most are not industrial. The word industrial implies a heat source used for some business purpose such as mining or manufacturing. It would generally be process-related. A blast furnace would be a perfect example of a “large, industrial heat source.” A 500 or 1000-ton chiller would be an example of industrial HVAC. Industrial is a much more ‘heavy duty’ word than the alternatives for HVAC: ‘commercial’ and ‘residential.’ All of the 22 A/C units in the prior thread were residential-type units. They don’t don’t even really merit the moniker commercial, let alone industrial.
Another difference between industrial heat sources and commercial or residential heat sources is that industrial heat sources are often on 100% of the time [except for maintenance…]. Commercial and residential heat sources are likely to be more itinerant in nature.
It appears that the particular standard mentioned by TCO would disallow mechanical heat sources if they mimic other non-mechanical heat sources. If they’re on all the time [i.e.-industrial], in the same way that you can’t ‘turn off’ the contribution from asphalt or a building, then they’re taboo. If they’re on once in a while [commercial or residential], then they’re OK.
That’s not a horrible distinction, IF data are recorded and stored with a 10 to 15 sec time resolution. That would allow a researcher to distinguish the A/C cycling and make a decent correction for heat contamination – if any was discernable. I’m still not saying it would be optimal, but I can see why a distinction could be made between industrial and commercial / residential heat sources.
This is silly.
Last winter, I purchased a US$50 1 million BTU flamethrower (connects to a BBQ propane tank) for use in melting ice after the blizzards, and for weed control. Works great — lightweight, small (the head is only 4 inches in diameter and 8-12 inches long; the “wand” part is about a meter long)… easy to use for hours on end.
According to TCO, because this is not a large industrial heat source, I should not be concerned if we were to discover such a device in regular use for cleaning up the weeds near measuring stations?
#57, Mr Pete:
I suppose TCO can speak for himself, but I think you’re trying to speak for him. I haven’t read that he said you shouldn’t be concerned. I thought he said its use wouldn’t be constrained by that set of standards. That seems quite different to me.
If somebody were using your flamethrower every day at noon at the base of the Stevenson screen at Point Barrow, Alaska, I’d be concerned. If somebody used it once a year, making one bad data point out of 365 – I wouldn’t get that excited about it. [That assumes it didn’t fry the electronics !]
Rules are rules and language has meaning. You don’t get to criticize people for breaking a rule they didn’t break. You do get to criticize people for failing to use common sense when they write the rules, or failing to see the obvious need for a non-existant rule.
Should temperature be measured near A/C units ? No.
Are most A/C units “large, industrial heat sources” ? Absolutely not.
Are A/C units “artificial heat sources” [see #7, above] ? Absolutely.
Are A/C units the type of “artificial heat sources” meant to be covered by the standards detailed in #7, above ? I have no idea.
#36 Stephen Mosher
IMHO, the Oke paper could have benefitted from some good technical statistical advice. Their ratio statistic R seems notto be the best choice. Ratio statistics suffer from a number of issues. Their distributions are often difficult to calculate and they can be very unstable if the denominator is small. Finding confidence bounds (which are typically non-symmetric) and developing solid statistical tests becomes a problem – you will note a lack of these in the paper. As well, there is the problem that switching the numerator and denominator does not produce a correspondingly symmetric situation.
My suggestion would have been to make a simple logarithmic transformation and use ln[R] instead of R. The value R = 1 will become ln[R] = 0 and the resulting statistic has a much better behaviour. There is now a natural symmetry and it is easier to solve the problems mentioned above, in particular, those of developing formal statistical tests and confidence bounds. It is also interesting to note that the average of ln[R] is equal to the log of the geometric mean of R indicating that that statistic might be a better choice of center to use for describing R itself.
This post is not about air conditioners; it’s about stations being located near paved areas. Please talk about asphalt and not air conditioners.
BTW in virtually all pictures where there are air conditioners, there is also pavement within 100 feet of the sensor.
MarkW:
My point is in reference to the people who say that they are just looking at what sites meet the written standard and what don’t.
I agree with you that industrial is an unnescessary limiter (except for the reason that Jim has about usage). Also that large needs to be defined. That near needs to be defined.
Capise?
Sorry, Steve. I meant to post 49 only as I felt TCO’s #5 was an inaccurate description of me and my views. It’s late and I expect I got soft in the brain. Please remove #58 before somebody responds to it, It has no value. Asphalt is bad.
60. Steve, sorry. I will avoid it, in this thread. Even if the MarkW ilk asks unanswered questions in this thread. I commend you on narrowing the scope as this post had too many themes in it. Your “by the way” commentary on Eli had brought in ACs implicitly (Eli’s post talks a lot about them) and explicitly (second para).
I’m fine with deletions of all my AC stuff also.
RE 59. RomanM
The statistics of ratios is very near and dear to my heart. especially when the
denomnator goes to zero!! ( the application was exchange ratios in combat… where
exchange ratio is defined as Number_of_dead_bad_guys/Number_of_dead_goodguys.)
Rice has a nice exposition on ratios in “Mathematical statistics and data analysis”
the biggest issue in estimatin the varience of Z, where Z=X/Y was the tendency for
small Y values to lead to wild variation in Z. If BIG X is cross corrleated with Small Y, you have a major
explosion in varience. essentially the varience is impacted by the correaltion
coeffifienct of X and Y. If the are negatively correlated it leads to rather
Substantial CI. I can’t reproduce the formula here ( math symbols problem) But
Since Oke used a ratio metric and since I’d been bushwacked by this kind of metric before..
It rung an ancient bell in my head. Maybe I’ll figure out hwo to Put Rice’s formulation
out, or if somebody else is more apt they can do it.
#53 Jim,
So the AC connected to Al Gore’s mansion would not qualify, since it is residential? Even thought the space being cooled is larger than some factories?
This (along with the fact that the don’t define their terms) is just more evidence that little thought has been applied to the creation of the surface weather network.
Steve McIntyre, I think you’re referring to Ashburn, VA, not Asheville. Unless we’re talking about a different Sterling, VA, not in Loudoun County, VA. I lived in Ashburn, VA for just over 10 years, and went to community college and work in Sterling. There’s no Asheville in the area that I’m aware of, and google maps doesn’t show one either. Probably a small nit, but anyone looking for an Asheville, VA near Sterling won’t find it.
Ashburn and Sterling, VA on Google Maps (Sterling is just to the east)
THe site is the one discussed in http://ams.confex.com/ams/pdfpapers/71791.pdf
Dear all, just got back from a 2 week holiday in the Algarve.
Very nice too. I have been going there for the past 15 years and this was the first time we were able to do without AC to get to sleep at night (for at least some days). Strangely I am reading that Southern Europe is in the grip of a heat wave.
Anyway been catching up on what been added to the site.
One thing struck me and that was TCO. Even when presented with literally mountains of evidence demonstrating poor siting of climate stations, clear evidence of UHI, (s)he continues to to deny the obvious.
Perhaps we should coin some new terms; “UHI Denier”, or “Quality Control Sucks Denier”
I also ask myself just what on earth does this person do for a living?
Writes Al Gore’s presentations?
#69. Poor siting does not per se show that the temperature record from a particular site has been affected by UHI. However, the information does enable a much better appraisal of potential UHI in temperature records. PErsonally, I doubt that it’s a coincidence that the USHCN station identified in advance as having the largest trend (Tucson U of Az) proved to have a particularly poor site.
However, the results to date certainly indicate that there’s no reason to assume that HAnsen and KArl adjustments are necessarily up to the task of recovering actual signals from the data.
I gotcha steve. Did you update the main post to say Asheville, NC? Or was my skimming that bad. At any rate, the statement “A recent conference paper compares ASOS and CRN instrumentation at an identical site in Sterling VA and between an ASOS station (not a USHCN station) and the Asheville CRN station, only 1.5 miles away.” is misleading. The stations are are several hundred miles apart.
The quick answer is put it into a gif file. Otherwise you Latex it.
#65 Stephen
I don’t know why one would want to bang their head into a wall dealing with the original ratio when a simple transform makes life easy just having the difference of two variables (correlated or not). If I wanted to make a decision about whether a change occurred at a particular time (due to paving, etc.), it would certainly be desirable to be able to calculate a p-value or two for the purpose. if you want confidence limits for the original ratio, just transform back. Calulating variances for ratios is usually an exercise to make life miserable for grad students.
And I like the idea of having graphs which have symmetry about zero since it makes comparison of values of ln[R] below zero and above zero (ratio less than one and greater than one) visually simpler and more meaningful.
Let’s find a suitable thread to discuss Runnals and Oke or go to Unthreaded. Doing so here would be thread-jacking. I have some initial impressions to share, based on partial reading.
Steve, sorry I was not attempting to conflate poor siting and UHI (Poor siting does not per se show that the temperature record from a particular site has been affected by UHI.), rather that when presented with hard evidence that;
1) climate stations are poorly sited
2) You elegantly show that Petersons (2003) conclusion that there is neglible difference in trends between “rural” and “urban” stations (thus no UHI) is a bag of nails.
All TCO can do to hold the alarmist line is to ramble on about whether ACs are “industrial heat sources”, or blindly parrot Hansen.
Talk about not being able to see the wood for the trees.
Or, given that AGW seems increasingly faith-based- “There are none so blind as those who will not see”
#75. TCO is not an “alarmist” sensu strictu. His brand of trolling is sui generis. How about that – two Latin tags in 14 words.
How do you site a sensor in an “urban” environment, anyway? Is there a WMO standard for such installations?
Or is what really happens that when an urban environment encroaches on a station, the station moves to the airport?
While asphalt does lighten over time, regular maintenance of asphalt tends to darken it. The maintenance can take the form of pothole repair, utilities work, sealing, and repavement. In the tucson_looking_NW photo on Anthony’s site I see evidence of utilities work in the foreground (note the large, rectangular “patch” that is slightly darker than the surrounding pavement).
I would think that asphalt maintenance adds irregular, “spiky” noise to the temperature of the asphalt. I would also think that identifying when the asphalt changes were made and adjusting properly for the temperature spikes is near impossible (for those cases where stations are located close enough to asphalt surfaces to influence the temperature readings).
Even though asphault lightens as it ages, it still has a higher heat content than either dirt or grass.
#11 TCO said:
“Nor does he link to Eli’s blog”
yes he does…see “josh halpern” in “weblogs and resources” above. the halpern/rabbet connection was discussed during your posting hiatus.
#81 paul graham:
I agree in principle. But the practicalities may be difficult. 100 ft from blacktop or concrete? Over grass? Away from air conditioners? Assuming an urban siting standard can be developed, do we not then lose comparability with rural sites?
I believe studying urban temperatures is worthwile, but not for the purpose of developing correction factors to apply to urban areas to derive their AGW component; the correction factors are likely to dwarf the AGW, especially whem applied like GISS does, with ramps and discontinuities over arbitrary periods of time. Better to stick to rural sites or possibly ocean temperatures for that purpose. Urban temperature studies can tell us how energy inputs from human activity distribute themselves into the environment under a variety of conditions, and how far from an urban center a site needs to be to be defined as “rural”.
Here is the guidance given to NWS people responsible for placement of stations (NWSM 10-1315 Appendix B section 3.1).
There is a clear message in these instructions…thermometers should be placed in an place typical of the area. In urban areas, asphalt is now typical of the landscape. On one hand, this makes sense given some of the customers of the data are utility companies and local media. On the otherhand, this doesn’t make sense if the data is used in climate change studies.
If I was doing a study on climate change, I would make sure that I limit data to proven rural stations to eliminate the UHI variable. Correcting for UHI appears way to complex given all of the factors that cause it and given that it changes with time. (How does one figure out the asphalt surface area in my city 50 years ago?)
I also got out my hand held electronic thermometer and took some crude measurements over new asphalt and over grass 10 feet away from the new asphalt. Again winds were switching from calm to from the NE, so I could not get an estimate of the impact of the asphalt on the measurements over grass. While on the asphalt I can feel myself bake when the wind was calm. The thermometer readings rose from 80.0 degrees to 82.0 degrees in about a minute (Thermometer was eye level and shaded from the sun.) Then the wind kicked in and the temperature dropped back down to 80.0 degrees. The same occurred over grass, but not to the same extent (1.5 degree change instead of 2 degrees). Clearly when the winds pick up, it was a part of the mixing process between the cooler air above the city and super hot air near the ground. Is it not the cummulative UHI effect of the city that warms the cooler air above the city? It could be possible that UHI effect of the city has more impact on the temperatures over grass than asphalt 10 feet away? Something to think about.
83# if only TCO would ask challenging question rather than trolling http://en.wikipedia.org/wiki/Trolling
85# or at lease educated enough to Google it.
88# I agree that correction factors are difficult to understand and remove, but certainly not impossible, or at the least improve the quality. Maybe the real use would be in the broader context of climate study; as climate models are affected by land use. However if we are going to truly understand climate change we, cannot ignore urban temperatures; especially as I can’t see GISS, NOAA…. just agreeing to drop them.
Anyway, if science was easy everyone be part of the hoi polloi’.
Virgil,
WHile asphault may be common in urban settings, I’m not sure that you can call it typical.
Just how to determine “typical” in an urban setting is quite problematic.
For an urban setting, you can have primarily shopping centers in one direction, primarily factories in another, primarily apartments in another, or primarily individual houses, with varying sizes of yards.
Worse, the what is “typical” in any given direction can change dramatically in just a few years.
How would you make the area within 100 feet of sensor typical of the urban center. Make sure that you have X% of area covered by flat, tar covered roofs. Y% young asphault. Z% old asphault. A% single family homes. B% swimming pools. Etc.
The problem is probably solvable if you want to devote enough time and energy to it. But when you add in the amount of resources that will be necessary to keep up with the rapidly changing urban environment, I doubt it is worth doing.
Mark,
RE #95
The instructions given to NWS employees are quite subjective, as you have noted. I bet if you get 20 opinions on what “typical” is for an urban area, you will get 20 different opinions.
If you ask the various users of the data, they would all want the station sited in different places. The AGW community didn’t become a “user” until about 10 years ago. As Steve and Anthony note nearly on a daily basis, the AGW community has been ignoring how the data that they use has been measured. This is very problematic to many of their conclusions .
Virgil
re 97:
“the AGW community has been ignoring how the data that they use has been measured”
Yep, all that analysis and correction for inhomogeneity is based on “ignoring” possible problems with the raw data.
92 VirgilM and 95 MarkW: Virgil’s excellent points and MarkW’s examples of the futility isolating the measure from the environment brings focus on the issue that we are trying to use the same data for disparate purposes.
I thank you both, because it was not quite so clear to me until just now.
Utilities, to name one group of agencies, need to project 24 hours in advance, and need accurate temperatures relevant to their service areas, including the effects of AC exhaust on neighboring temperatures. Staggeringly large amounts of money swap hands in the event of errors.
Climate people want the data to be free of the exact same effects that utilities and consumers need to know about.
It seems clear that everyone cannot continue to use the same data. We should be using data appropriate to the need, not adjusting data to fit a purpose different from that for which it was acquired.
I wonder (in a completely curious sense) what the impact of micro-site issues is on regular weather forecasting.
#19 IIRC the conversations on the blogs, the U AZ person explained the sensor was purposely put over asphalt because it had heat charisteristics that were more like the ‘native rocky sw terrain’ or some such. So there’s not a reason to doubt the sensor was put over asphalt by accident. The only thing I’m unsure of is if the person actually knows, or is guessing. But the real question is if asphalt acts the same as a rocky hillside or not. (And I’d guess not.)
All that aside, I have said it before and I’ll say it again, about asphalt (or any other substance): All we are doing is measuring the thermal properties of the material x feet above the ground and how it mixes with the air at the thermometer location. I doubt I need to mention that humidity, wind and materials around that area also have to be taken into account. And although yes we are worried about anomaly values over time, materials do age and change thermal properties….
re 16 pat: I bet asphalt does a great job of putting heat back into space. It’s just that it whacks the thermometers on the way by.
RE101, there has been an “official” response from U of A over on Pielke Sr’s blog regarding the Tucson weather station:
http://climatesci.colorado.edu/
Re: #92
Your comment brings to my mind a consideration that I believe we have not really discussed in this context. We want temperature measurements, or at least those measurements used for measuring global trends, to be free of urban effects because we want something representing the global area of which only a small fraction area-wise is urban.
If, on the other hand, we were interested in temperatures that people must endure and adapt to, then we would be very interested in determining those temperatures that the urban dweller experiences since those people make up a significant portion of the global population. Perhaps that is something in the zeal to get a global average that we are neglecting here. Assuming the UHI effects are real and relatively large, but that urban temperature measuring sites are chosen to avoid them, as suggested by Parker, then are the official records doing a disservice to the urban dwellers in terms of looking at the real temperature trends that they are experiencing? There are other questions left unanswered such as: Is the urban trend increasing or decreasing.
If we simply were concerned with a temperature increase in terms of AGW, we have urban dwellers that have no doubt already faced it and probably at a rate many times greater than GW or even future GW. One might even ask, if simple temperature increases were so adverse, why our cities have not been abandoned. Warning: You have just read a wrought sentence that might be considered by some to be overly wrought.
#100: Obviously the impact is significant because the forecast today for our area has been for thunderstoms since 1PM and here it is almost 6PM and…nothing. The local Coop stations (none USHCN) are located in a variety of areas, including the middle of a regional airfield (right between the runway and parking area, with a huge mall parking lot – I mean BIG – spitting distance away), control stations for several hydro dams, and a sewage plant. The local forecast never seems to be right…always predicting higher temperatures than what we get, no rain when it is raining, etc. etc….whine whine whine.
It makes no never mind, for climate change issues, whether a given station measures 4C warmer or cooler than it would if it were out in that open field over there. What matters is the trend over time, and whether a spurious trend has been overlain on the actual trend. Looking at a picture taken today tell us nothing about the history and the changes and when they happened, and the possible effects on the trend.
But looking at the actual data that does record the effects of such changes – the temperature record itself – and comparing them to spatially related sites and including relevant metadata issue, such as time of day when relevant, CAN do so – and this is what is done. A modern picture taken at a single time point is going to perhaps give us some more info about some possible reasons why there are inhomogeneities IF they exist and have been identified, but they aren’t going to identify inhomogeneities themselves – they are useless for that purpose.
The surface stations project seems to start from the unstated assumption that badly sited stations, which certainly may have “incorrect” absolute temps, are ALSO perforce going to have incorrect trends. And then they/you bash the analysts for ignoring QA – when in fact the analysts have been applying huge amounts of QA to finding bad trends, using the best available QUANTITATIVE historical data, which is the actual temperature record.
Steve should take note that the surface is not direct asphalt, but rock gravel (you can sorta see it now). Of course there is adhacency to a parking lot. But the area itself is a rock garden. If the 100 foot to parking lot is a conservative standard and direct siting over asphalt is needed for a strong impact, then this station may need to move off the gross list to the mediocre list.
You could get temperature readings in cities without asphalt, air-conditioners and whatnot at golf courses. However all geeks must wear plaid pants.bb
VirgilM:
Lee:
I think most of us here realize that these statements are not mutually exclusive and lead us to the question: Correcting for what?
I think a better question would be how the temps (or soil conditions) at the old Polo Grounds (previous location) compare to that currently. Of course, we should really be talking about this in the thread a few days ago on this site specifically. But Anthony posted his note about the official response on this thread.
re 109, “correcting for what?”
If this is an honest question, my honest answer is that you might start with Hansen et all 1999, and Hansen et al 2001.
If this is a rhetorical question designed to imply that the corrections are being pulled out of someone’s behind, then my answer is still that you might start with Hansen et al 1999, and Hansen et al 2001.
Honest question. And after previously reading about Hansen’s corrections. Specifically how do Hansen’s corrections take into account the obviously unacknowledged non-compliance of an unknown number of stations? Or put another way, what assumptions of compliance are required to make proper (Hansen) corrections and how would it affect the stated uncertainty of the measurements? Put another way, why write site specifications if they are not important and if they are important why the lack of quality control?
Perhaps you can provide some insights beyond a link to references that I have already read.
“Specifically how do Hansen’s corrections take into account the obviously unacknowledged non-compliance of an unknown number of stations?”
Short (and obvious) answer, directly from those two papers – by using networks of spatially related stations to look at possible jumps or spurious trends in the data from individual stations. And by looking at metadata to correct for known issues, such as teh tim eof day problem. IOW, by looking at whether there are problem with the trends in the actual data – which is, of course, the point under discussion. In fact, ths is the precise reason they limit their analysis to post 1880 – prior to that, the spatial density of stations is too sparse to allow comparisons of spatially-related stations for this purpose.
A badly sited station matters ONLY if it causes a spurious trend or jump transition in the data. Such a spurious trend or jump, IF it exists, will show up in the data, not in a photograph taken on one date in July 2007.
#111 Lee,
They have an exact (undisclosed) procedure for pulling numbers out of their exhaust.
Quite scientific.
Beyond question or reproach.
Quite convenient.
lee said:
“A badly sited station matters ONLY if it causes a spurious trend or jump transition in the data. Such a spurious trend or jump, IF it exists, will show up in the data, not in a photograph”
please forgive a layman’s question…
your position is that the quality of the sites from which data are collected only matter if a “spurious trend or jump” occurs? other than that, the quality is unimportant? really? how would one determine a spurious trend if the quality of data collection is poor?
115, sigh…
“by using networks of spatially related stations to look at possible jumps or spurious trends in the data from individual stations.”
Anthony, #103… Great!!!! Nice to know somebody’s paying attention. 🙂
Lee, #113… No, badly sited stations do matter, regardless of anything else, because of the fact that they don’t meet the standards set out to make sure the data is as accurate and meaningful as it can be. The details are both unknowable and unimportant.
As I’ve mentioned before, if the standard is not met, we don’t know and can’t figure out how the data is corrupted. There shouldn’t be a need to adjust for AC units, asphalt, concrete, shade, ground cover, paint, lights, and so on. It’s not that something may corrupt the data or not. It is that those things are adding many other levels of complexity to an already complex chaotic MIMO system, and that just obfuscates something too complex already into something that can’t be understood at all.
As has been said before, if this is a high quality network, then better siting, better records and a more complete photographic history should have already been there. The details (how much does factor x and that interaction with factor y, ad infinitum, ad nauseum), shouldn’t even be up for conversation in the first place. I believe that it is up for conversation at all speaks volumes, in and of itself.
lee…no need for the condescending sigh. i read the post.
what if a significant part of the network is poorly sited? how would one ever know, if one never goes out and looks?
also, what is the definition of “spatially related” (not in your words, but in hansen’s, in a peer-reviewed paper?) all too often, the team seems to decide on this type of issue post hoc.
Regarding the value of siting and meeting standards put forth by the WMO and NOAA, I have two points:
1) Read a March 2006 paper in the Journal of Climate by K.E. Runnalls and T.R. Oke points out, “Distinct régime transitions can be caused by seemingly minor instrument relocations (such as from one side of the airport to another, or even within the same instrument enclosure) or due to vegetation clearance. This contradicts the view that only substantial station moves, involving significant changes in elevation and/or exposure are detectable in temperature data.” I have it posted on my website for anyone that wishes to read it, here is the URL: http://gallery.surfacestations.org/main.php?g2_view=core.DownloadItem&g2_itemId=18104
2) The fact the the new Climate Reference Network (CRN) has already adopted some very stringent siting standards point to a realization that siting and possible micro-site effects do in fact matter.
From the USHCRN manual:
The USCRN will use the classification scheme below to document the “meteorological measurements representativity” at each site.
This scheme, described by Michel Leroy (1998), is being used by Meteo-France to classify their network of approximately 550 stations. The classification ranges from 1 to 5 for each measured parameter. The errors for the different classes are estimated values.
Class 1 – Flat and horizontal ground surrounded by a clear surface with a slope below 1/3 (<19deg). Grass/low vegetation ground cover <10 centimeters high. Sensors located at least 100 meters from artificial heating or reflecting surfaces, such as buildings, concrete surfaces, and parking lots. Far from large bodies of water, except if it is representative of the area, and then located at least 100 meters away. No shading when the sun elevation >3 degrees.
Class 2 – Same as Class 1 with the following differences. Surrounding Vegetation <25 centimeters. Artificial heating sources within 30m. No shading for a sun elevation >5deg.
Class 3 (error 1C) – Same as Class 2, except no artificial heating sources within 10 meters.
Class 4 (error >= 2C) – Artificial heating sources <10 meters.
Class 5 (error >= 5C) – Temperature sensor located next to/above an artificial heating source, such a building, roof top, parking lot, or concrete surface.”
Such a procedure will pick up the larger spurious jumps, but not smaller ones of the order of say 0.2 C or less. If there are lots of these small jumps, it can add up to a significant portion of the trend. The Runnals and Oke paper shows that not all inhomogeneities are picked up using current techniques.
Anyway, there is no unique and error free way of calculating the spurious jumps and trends, so it is better to use well sited rural stations that have been that way for a long time, as Urbinto points out.
re 73 &74
Yes perhaps we go over to unthreaed.
I see no reason for Oke to stay with a ratio ( Maybe he thinks It won’t diverge much from unity.
Plus the R1 and R2 should ( ha ha) have a zero correlation which is better than a negative
correlation) I was ORDERed to use a ratio, fun that!
Look, OF COURSE station siting and history matters. This is precisely why the inhomogeneity corrections are necessary, and why Hansen et al devote so much work to trying to identify and correct problems in the data. And OF COURSE it would be good to have a homogeneous network designed and maintained for climate monitoring over time. It would be better if that network existed going aback 100 years – or even better, a few thousand years. No one disputes that.
But what we have is the extant data. It is drawn from stations put in place for other purposes, and it has problems. We know it has problems – that is why we need the corrections. But it is the data we have – it is the BEST data we have – and it is being subject to intensive analysis designed to extract the best possible record from it. And the best analyses to date of the best data we have shows the warming that it shows.
A picture of a station does not, and can not, tell us if there are inhomogeneities in the data from that station. Using single-date pictures as if they tell us something about the trend at that site, good or bad, is simply IMO naive in the extreme.
The CRN will be a great resource, going forward. The fact that we are designing a network that works better than what we have in place, and won’t require the inhomogeneity analysis and corrections needed for the current data set, is a good thing But the fact that we can do better if we design for this purpose, does not invalidate the current analyses of the current data set.
BTW, the first paper Watts cites in 119 implies that even those historical ‘perfect’ sites out in the middle of flat fields, are potentially problematic, and require inhomogeneity analysis in the historical data.
If surface stations had said, ‘we want to add to the analysis, but partial result aren’t going to tell us anything until we get reasonably complete coverage, and correlate that with the corrected station data for each station, and look to see if identified siting issues correlate with patterns of data trends, so don’t jump the gun until we get to that point’ that might have been useful. Right now, the surface stations site is prematurely, and WITHOUT ANY FRICKING DATA ANALYSIS OR CORRELATIONS WITH SITE DATA AT ALL, being used to argue that the surface record is useless. And Watts is not, as far as Ive seen, doing anything to combat that misuse of a terribly incomplete and utterly un-analyzed partial data set. In fact, the only station data Ive seen at the site, is the UNCORRECTED data at two seemingly cherry-picked sites, leaving an impression that IS NOT SUPPORTED BY ANY ACCOMPANYING ANALYSIS. And Macintyre is actively contributing to that meaningless misuse of these meaningless (in the absence of correlation with data and analysis for patterns) pictures. Which I an only interpret as acquiesence and contribution to that misuse of an at-this-point meaningless ‘data’ set.
Lee’s #106 and #113 have a logical contradiction..First 106
Now 113 Caps are highlighted by me.
Perhaps the metadata adjustment only handles known issues, and the pictures shown, unknown issues. But instead of just “looking”, let’s recall what Hansen and others (Karl) stated about the network data.
Finally in terms of human capibility. Yes a comptuer program can help with correlation, bad data and all sorts of ill, but it can’t really tell if it is “good” site or a “bad” site. It will only do and show what it has been programmed to do. However, people with only minimal training with a good science or technical background, can look at air conditioners, asphalt, etc and see potential problems. From Lee’s own comment of how it is a single picture at a single time, the extent of a given false bias may be unknown. Unless the Hansen metadata adjustments can be verified to correct for not just this snapshot, but rather a history of changes, then it is of questionable value. Its real valvue will depend on what is found. That is what most are indicating in their posts.
I wouls also like to correct another piece of misinformation…
This is untrue. From the pictures, one can make a list of potential changes. Also, if the photographic record is of good quality, estimations of age, cost and other factors can be determined. From this and records of changes, financial records and even other pictures from different dates can be used to establish time-lines. In fact, with a good specific picture, ariel photos from other sources can be used and approximate dates set. And of course, if a site went from grass to asphalt, and an audit found that Hansen used this data to correct a site without problems, wouldn’t this imply that the homogenity of Hansen induced a bias?
My question, would any of this be reasonable to look for, attempt to find, or even be worth the trip to a local station, if the pictures had not been made available, and caused this discussion?
If it only accomplishes a closer more thoughtful look at the data and methodology, it will accomplish much. However, the IR photo that Steve has posted, makes the comment about a little bit of gravel to represent natural conditions is more than a little stretch. Probably the worst stretch is if the typical land in that area is a combination of sand and rock with sand tyically covering most rock. The specific heat capacity for sand is much different from rock. We have a substance (gravel) known to have a high heat capacity, surrounded by asphalt that is about 55F hotter than the air, assuming similar conditions. I would think that the athering of microsite data would be appreciated by all. If we have enough of a database and could match the sites with Hansen, choose a rmdom sample with good known microsite problems that have been documented, perhaps we would verify that Hansen and others actually did a great job with the data adjustments. I would assume such a verification would be desirous and useful to the science.
re 106.
Read Oke’s study.
re 111.
Read them both. I do not find a METHOD. Read Oke. He shows a method for detecting
1. Hansen: I have this method that identifies and corrects. no you cant see the code.
2. Oke: I have a method that identifies: HERE IT IS.
Reproducability. Simple. Hey Hansen could be right. Sad thing, you can’t show it.
Oke could be wrong. You could show it.
The short and obvious reply is that such a process assumes that most of the network of spatially related stations are in compliance and, of course, how one defines a spurious trend. Another complication is that the calculation of spatial error or uncertainty in the data assumes, I would think, a given number of spatially distanced and independent measurements, but how does that work when a number of sites become dependent on others for trend adjustments.
re 115.
The right question to ask Lee or Hansen is this.
Orland hasnt moved in 100 years.
It is rural
There are no instrument changes ( CRS to MMTS)
The site is in a feild.
The elevation hasnt changed.
Homogeniety adjustments imput a 1C warming trend to this site, by cooling the past.
A well sited site gets adjusted? How and why?
The answer is not ” we adjusted for several factors” the answer is:
1. HERE IS OUR CODE, check all you like! we are confident in our code.
The pictures are only evidence of a lack of quality control. The next question, which has not been answered here or by the involved scientists, is how much will this lack of quality control affects the ability of people like Hansen to extract a valid signal from it with reasonable estimates of the uncertainties involved? What do these corrections/adjustments assume? One can obviously pose a completely out of control measuring system that would not allow for valid adjustment procedures so at some level and point quality control is important. Pointing to over wrought statements about the situation will not change it. The pictures beg some very important questions and particularly so in light of the claims Hansen has made about the control of the system and the need for a well controlled system.
re 126:
“such a process assumes that most of the network of spatially related stations are in compliance”
Not, it does not. This post illustrates precisely the error so may here are engaged in. You are assuming that lack of compliance with siting standards necessarily means that there is a false trend in the data from that site. When in fact a perfectly sited station can have a spurious trend, perhaps from time of day issues, or thermometer changes, or moving the thermo from one side of the box to the other, and a badly sited station might have a trend perfectly in accord with actual temperatures. One CAN NOT TELL simply from looking at pictures, and one CAN NOT TELL simply from whether the site is in compliance.
The comaprison method DOES NOT CARE if the sites are in compliance. It does care that data from a mix of different sites, often different kinds of sites, in spatial proximity to each other, are consistent fro site to site, and corrects if they are not.
re 128:
“The pictures are only evidence of a lack of quality control.”
Yes, but not in the way you imply. There is a lack of quality control in the extant temperature records – that lack of QA goes back over the history of the entire data set.
It is NOT a lack of quality control by Hansen et al. The cornerstone of their work is to apply QA analyses to the extant data, to try to pull out a good analysis from data known to have problems. Hansen cant go back and change the station siting over the last 127 years. What they can do – and are doing with CRN – is create a homogeneous network going forward – and then y’all use that as evidence that the extant data is useless. What they can do – and are doing with the homogeneity analyses – is try to remove spurious temp deltas from the temperature record, to the best of the utility of extant data analysis methods – and photos of siting issues are NOT going to identify spurious trends, not by themselves.
Slighty off topic, b ut I wondered how someone would site a system to measure Asphault.
There are standards!.. I’m not going waste much heat on this, but the curious might
find something here, it’s better than watching “The view”
http://ops.fhwa.dot.gov/publications/ess05/ess0509.htm
this one was fun
Click to access Statisticalmodel.pdf
this one studies the climate impact on asphalt. ( nice twist)
Click to access SHRP-P-621.pdf
Re 129
Since we don’t have the actual code used you are making a statement that is unsupportable. Using sites that have biases in them to adjust a site that is not biased will only contaminate the better site. If you really follow your logic the final answer is that because of the lack of quality control at these sites they are worthless for climate trend studies.
Of course it matters if stations are badly sited by encroachment of development, or moved to bad sites.
It matters precisely because temperatures are presented as continuous time trends in the data. If researchers were honest enough to place an asterisk beside encroached or moved sites, and were honest enough to drop such sites from continuous time trend data, perhaps it would matter less.
re 133 –
please use a name that distinguishes you from me.
post 133 is not by me, the long-time Lee here at CA.
The comparison method must compare something in question to some standard of comparison. That most readily available is the output from the other sites with are assumed to have a spatial relationship to the one in question. How does one determine that the standard of comparison is correct. I believe it was Jones in his adjustment paper who freely admitted that unknown biases can exist for which one cannot make adjustments.
What if, hypothetically, one had poor or no quality control of sites and most of those in a spatially connected area included the effects of, lets say, asphalt proximity to the sensor. The few that were “correctly” sited had detectably different readings. Which sites would be adjusted?
Further I believe one would run into a deadend arguing that compliance does not matter because then one really has no definition of what it is one is measuring or atempting to measure.
I’ve deleted some bickering posts that had nothing to do with science content which has affected the numbering, some of which were Lee’s posts but were also the contra bickering as well. I really don’t want this sort of bickering.
Lee, I do not want to appear to be The Commanding Officer here, but I think since you appear to have considerable confidence in those adjustments that Hansen makes, perhaps you could take us all through an adjustment example and what that adjustment must assume. You could generalize your explanation as much as you felt comfortable doing. You could even conjecture what you think Hansen’s process is as long as you let us know that is what you are doing. Otherwise I am afraid we are punching air here.
No, Kenneth, we’re not punching air. I am punching the assumption that adherence with siting guidelines tells you much of anything at all about the quality of TREND data from that site.
The methodology that Hansen et al use to detect and correct inhomogeneities is a different – and valid – question. But what is being defended here is the assumption that violations of siting guidelines automatically render the trend data suspect – and that adherence with siting guidelines might render the data capable of being accepted without challenge.
The fact is, adherence to siting guidelines does not guarantee homogeneity, violation of siting guidelines does not guarantee inhomogeneity, and pictures of one instant in time do NOT detect inhomogeneities, much less allow one to estimate sign, magnitude, or time period of an inhomogeneity.
The fact is, in an inhomogeneous *network*, one must look at the data to detect inhomogeneities – because the metadata and history are always goign to be incomplete, and the effects of the history are goign to be difficult or impossible to assign. My point aoubt the inhomogeneity analyses and corrections is not that hansen et al do it perfectly, but that a strategy of that kind is the only way to approach the data.
And therefore, the surface stations data, as it exists and is currently being bandied about to dispute the surface record, is utterly useless. As of now, it tells us absolutely nothing useful. A bit above, I go into more depth about what is necessary to make it useful – perhaps SS is going to go there. But they havent, even for the extant pictures – and so, pretending that the pictures to date tell us anything useful at all is simply incorrect.
Lee, can you explain why Hansen switches to USHCN raw on Jan 2000 discussed in a recent post? Can you identify a page in the articles in which Hansen reports this switch?
Lee, why even have gudelines? Why should measurements be subject to standards?
jimDK, have I ever said those sites should not be sited according to standards? It would of course be much preferable if they were.
But many of them are not, and that has been true for the entire history of those stations.
This is historical data – one can not go back and change the history. What one can do is try to extract as much value from flawed data as possible. Doing so is not in any way derogating the importance of standards – it is simply recognizing that there are violations of standards in data that one can’t go back in time and generate again, and dealing with that issue.
RE 129.
The US is oversampled relative to the rest the world.
Dump the bad sites.
[snip]
re 127 – No, I cant. I haven’t looked into that issue.
SteveM, can you please respond to my point about the minimal usefulness of simply looking at siting adherence, to the analysis of the data from that site? Its a lot more on topic to this thread than your Hansen question, and you do keep pushing us to keep the threads on topic.
mosher,
which are the ‘bad’ sites re temp trends? Please explain how you know?
Lee, how can there be ‘data’ if there is a violation of standards in measuring? It’s not even data if the the process of measuring is flawed. That is the issue
#88, TCO asks
I offer this for your consideration from the FW office of the NWS…
Now, I have no idea what, if any, micro-site issues may exist at the COOP stations they used (unspecified). However, this is clearly a case that if the COOP sites do have micro-site issues affecting temps, these issues are affecting the general forecast for that area by raising the forecasted high temps.
re 130: I would argue the rest of the world is undersampled. I think my home state of Connecticut is undersampled. There are only four USHCN sites in the state. There are many more co-op sites, but none located near my home. My local temperature reports are from Danbury, but the temperature I measure at my home is never as warm as the Danbury reading (it is 2 to 10 degrees cooler). How is my town or neighborhood average temperature factored in if there is not a co-op station anywhere near us?
Lee’s argument would be right if the stations had been built out of spec and then the environment been kept exactly as built. The photos don’t look like that. They look more like a series of changes have been made over time in the immediate environment by guys who were not thinking about the stations at all, but just running a site which happened to have this funny little device stuck in the middle of it. The problem is not just that they are out of spec, but that not adhering to spec means the environmental conditions have been uncontrolled. The main reason for the spec, were it being adhered to, is that it would stop this sort of thing.
For Lee’s argument to be valid, he has to demonstrate continuity of whatever the spec is (whether compliant in the first place or not). Just looking at the photos, it seems like a lost cause. Is not the right conclusion that if it is out of spec now, throw out that series? Because you have no idea of its history or exactly how to correct for its history?
RE 126
Actully Oke and Others have shown this. They have shown that microsite
issues corrupt the record. The CRN study shows that asphault imposed a
.25C bias at one site.
Further the picture of orland ( and metadata), a site that hasnt moved in 100 years
tells us volumes.
1. No Station move adjustments required ( metadata)
2. No elevation adjustments required. ( metadata, confirmed by visit)
3. No UHI adjustment required. ( metadata, confirmed by visit)
4. No standard Violation adjustment required ( cnfirmed by photo &visit)
5. NO AC unit adjustment required ( Confirmed by photo & visit)
6. No asphalt adustment required ( confirmed by photo & visit)
So, dirt simple question. Do You trust a homogeneity adjustment
methodology that adds 1C of warming to a high quality, photo verfied,
unmoved, rural, site.
Homogeneous with WHAT? With sites that moved, sites, that sit by pavement,
sites under trees, sites by swimming pools, by water treement plants,
on the ROOFS of buildings. Homogenized with THAT!
So, Lee, when you explain the adjustment of orland, specifically, then
we have a rational discussion.
And I leave you with Oke
You go have look at Hansen’s “metadata” go ahead. Have a look
Tell me if you think lights=0 is detailed.
#131. Are you disagreeing with what I said about this in #70?
Lee, the point that Steve Mosher made in the previous point refers back to a post in which it was shown that “good” data at Orland was adjusted to better match seemingly bad data – this is in the USHCN adjustment stage prior to GISS adjustment.
As to the quality of GISS and USHCN adjustments, these are very poorly described, there is no available source code, the statistical methods used are not mainstream statistics, but local climate recipes not known to mainstream statistical civilization. My impression is that the adjustments are problematic. Having said that the US data with an attempt at adjusting for station problems has a much lower trend than the ROW where no such adjustment is done – raising questions about the ROW as well.
re 133,
I once measured tracer radioactivity from a set of difficult to obtain samples on a scintillation counter that was improperly calibrated. Those measurements were obtained through a process that violated standards.
I was still able to rescue that experiment by recalibrating after the fact, and correcting the measurements by comparing the old to the new calibration.
It is simply incorrect to state that there is “no data” if some set of standards aren’t met. The data may (may) be contaminated by some spurious data set, or offset by a constant – but it is still data, and if the issues can be analyzed, can often be corrected and used. But you cant do it by just looking at the dials and saying ‘ these are set wrong.’
Peter, that is true of every single station on the planet. Even those ‘perfect’ stations out in the middle of a field, like the one at Orland. We don’t know whether the thermo was replaced with one that reads high or low, whether the measuring device was moved from one wall of the screen to another, and so on.
In the absence of perfect historical records – good luck – one MUST approach this from the data side, because one can not assume that ANY station is contaminated or not contaminated with a spurious trend signal.
Your approach would argue that we throw out any data that isn’t perfect, always and ever – and that therefore we must in general throw out all data, and cant know anything about past climate at all.
I find it interesting that the defense of surface stations seems to have been abandoned, in favor of attacks on hansen.
re 135, Goetz,
Your town is factored in because the temperature anomalies are highly correlated over pretty broad differences, even if the absolute temperature vary by quite a lot. The official stations might not closely match the absolute temperature at your town, but the temperature anomaly will match much more closely the vast majority of the time.
Lee, I think that you keep missing my point which is that the pictures show a lack of quality control and poor, or, at least, unknown adherence to compliance standards, both currently and in the past. You seem to keep repeating what Hansen and others have valiantly done in efforts to extract some trend information from the data by comparing it within itself. That’s all well and good. Kudoos to Hansen, et al. The questions, however, remain that you have not attempted to answer: What would noncompliance to a large number of stations, in current and past times, do to the assumptions that are made in the Hansen adjustment process? What meaning does a measurement have that cannot be defined by specifications for the sites? Again simply taking us through the process with an example could help us all understand better.
RE 142.
He’s only taking pictures. What is to defend? It’s harmless fun, don’t mind us. ( click click)
Pictures show Nothing…oooh except Nightlights pictures!. Nightlights are comforting.
Nightlights show us that sites are rural!
and Nightlights show us that urban sites are in parks… err somehow.
RE 141.
Asking Hansen for his data and methods is not an attack. It is his responsibility to provide them.
oh Jones has a similiar problem.
Lee but it was not data until you recalibrated your test equipment. So the historical temp record is not really data because you can’t go back and recalibrate those sites
I did a study of IL temperature anomalies over a period of the past 50 and 100 years and found that relatively nearby sites could have anomaly difference significantly larger than the global anomaly over the same period of time. I used fully adjusted USHCN data. I have wondered if I am looking at real spatial differences or measurement errors.
Re 142 Lee:
I’m not sure it is all that correlated. I am seeing two to ten degree differences, and I cannot yet predict when it will be two, or ten, or something in between. If a storm comes in it will be closer to two (meaning five is possible but ten is highly unlikely).
I only live ten miles from Danbury. I am wondering…is my temperature more representative of the area or is the Danbury airport’s?
Meanwhile, speaking of trends:
This is with July data for 2007. Arctic sea ice minimum happens in September. I’ve read but not confirmed the claim that “pretty much all of what’s left of the thicker multi-year ice is piled up against Greenland and the Canadian archipelago, meaning that there much of the remaining pack is eminently meltable thin first-year stuff.”
And the two lowest winter ice packs were last winter and the winter before. The ice is melting away in summer, and not recovering in winter.
Must be badly sited surface stations at work.
Lee, why in the world are you posting that on this thread? There are plenty of threads on ice you could have posted it on. Or post it on unthreaded, but show a little common sense for a change.
Dardinger, this is [snip] on topic – a reminder that alleged temp trend issues arising from the siting for the surface stations is NOT making all the warm go away.
Net ice loss from Greenland and Antarctica, widespread glacial retreat, northern movement of plant zones – there’s a lot of warm out there, and this discussion isn’t causing it to cease to exist.
It is one thing to discover that the reading curve for your meter is off, and re-plot the proper correlation of reading to actual radiation. It is quite another to blindly (in the sense of having incomplete metadata) ferret out the source vibrating its way down the table, (or other slow movement), the introduction of multiple other sources of varying size nearby each the meter, and the source (thereby both adding to the radiation themselves, as well as increasing the radiation of the original sample), the door to the radon-filled basement opened intermittently, the wrapping of the source in gold foil; all the while assuming the immediate environment stayed the same.
Apparently you have the same inability to understand the purpose of this and other threads as most of your friends do. Nobody, least of all Steve M., is claiming that siting issues will “make the warm go away.” Nice strawman, however, but the purpose is, and has always been, simply to audit the stations. The claim that they are “high quality” has been proven false. What effects this has on the temperature has not been investigated so any claims, yours or otherwise, are off-topic and immaterial at this point.
You, like your brethren, just don’t get the purpose of science. Your belief system is being challenged and you have to come up with a way to save it by bifurcating issues and constructing strawmen in hopes others aren’t smart enough to notice.
Mark
I live in a fairly urban area and I just took my friend’s dog to a place where she could chase a ball around. Many hundreds of feet of grass, with some locations that a temperature sensor could be placed in a fenced-off area without causing park-goers too much inconvenience.
Here in Sydney I would say that Centennial Park could make an excellent location for weather equipment. It’s large, with many grassy areas, fairly close to the city but without high density housing directly around it, fenced off and closed at night, there are park rangers (who could take the measurements), etc. Certainly a much better place to measure temperature than the airport or observatory hill I would imagine – the two locations I am aware of where temperature is measured.
re 153,
Thank you,MarkW, for acknowledging about the surface stations data that; “What effects this has on the temperature has not been investigated so any claims, yours or otherwise, are off-topic and immaterial at this point.”
Would that include everyone in this and other threads who is speculating about the impact of this on the temperature trends?
The fact is, the global surface data has been telling us we’re seeing temp anomalies right at as high as we’ve ever measured – and right at the same time, we’re seeing broad glacial retreat, sea ice loss, ice cap mass loss, northern movement of plant zones, earlier springs and later falls, greater than we’ve seen in that period. This seems to me to be confirming evidence that those ‘about as high as we’ve seen’ temp anomalies cant be too far wrong. Despite that siting issues photographs, and the accompanying lack of any evidence (you are kind enough to point out) they bring to bear on the temperature record from those sites.
re 155 – Mark T, not Mark W. My apologies.
Lee, you know as well as I do that the major argument here is the ability of the network to accurately measure a trend when numerous adjustments have to be made (which inevitbaly introduce new errors).
Now your changing your argument to: “we can argue all we like, but we still know its warm.” Thanks for that, i would never have noticed.
And you say:
Lowest since when?
Lee, what in God’s name does ANY of that have to do with asphalt and micro-site issues?
If you don’t want to discuss the topic, why don’t you go post somewhere else? Thanks.
By the way, here is a photo I took of the Sydney CBD. Plenty of convenient locations in that photo to put a properly sited temperature sensor. I don’t imagine it’s so hard to find similar locations in other cities, if someone really wanted to take high quality measurements. Obviously UHI will still be an issue, but getting rid of micro-site problems would be a big step up.
also re 153:
“You, like your brethren, just don’t get the purpose of science. ”
Actually, I do. The purpose of science is to arrive at understanding of natural processes. The way that is done by scientists is to do some science. If a scientist sees some science that s/he thinks is wrong, s/he then does not simply say ‘that work is flawed – we don’t know what the work says we know’ and build a career around showing what we DO NOT know.
The scientist whos is actually doing science goes and does work to investigate and add to what we DO know. That is precisely what this site does NOT do. It is precisely what SteveM says he is NOT doing. He is “auditing.” He is arguing that we don’t know stuff – one isolated thing at at time, and any cross-confirming stuff is off topic and gets yelled at – and then stopping there. Stopping right at the point where someone actually interested in science would be clamoring to go and DO something, SteveM stops.
If this site was about doing science, then SteveM, or others here, would not be racing after Hansen for his alleged failures. Y’all would be taking the data – it is available, SteveM has Hansen’s data – and doing your own study, the way you think it should be done, with argument about and justification for why you chose different methods than the extant literature, and then reporting the results. THAT is what science looks like.
#110 Lee,
Sure all we have is bad data (comparatively) so let us just say that any signal less than X can not be counted on. That adjustments and when and where to apply them are guesses. That the whole thing is a mess but from here forward we can straighten things out and in 100 or 200 years we may have some real data.
Until then we have numbaz. Lotsa numbaz. Lotsa fun wit da numbaz.
158, Nicholas,
STeveM said in 70 of this very thread:
“However, the results to date certainly indicate that there’s no reason to assume that HAnsen and KArl adjustments are necessarily up to the task of recovering actual signals from the data.”
Much of the discussion subsequent to that has been at least implicitly on whether the station siting permits a reasonable recovery of the relevant signal. SteveM has participated in that discussion, including offering me specifically a challenge regardign Hansen.
If my responses to all that are off topic for this thread and it bothers you, then why on earth are you attacking me for it, rather than SteveM and others who have been keeping that injected into this thread and making many of the post to which I am responding?
You just don’t get what falsification means, Lee. Audit has a very specific purpose which is completely lost on the likes of you. In your petty world it is OK that there are so many flaws in the “science” that is presented to us. You don’t care because it fits your view. If you truly understood science, you’d be as appalled as I am at the serious issues that are raised by Steve’s audits. But no, you continually defend the indefensible because it challenges what you “know” to be true.
Do you even understand the simple steps of the scientific method, namely falsification? If Hansen is so golden, his work would stand. But it isn’t standing because it’s flawed. You don’t care, do you?
Mark
MarkT, I am hard put to think of a piece of science I have ever read that wasn’t flawed. Finding flaws or incompleteness, isn’t “falsification’ in any sense of the word. For a scientist, what it is, is an invitation to go do better work and learn more about the world.
Hansen’s work is an imperfect attempt to use an extant flawed (but the best we have) historical data set to extract a critically important piece of knowledge about the world. Pointing out in a slightly new way that the data set is flawed in ways that aren’t any surprise, and disagreeing with the way that Hansen dealt with flaws in the data set, is nto falsification – in the absense of attempts to do it better, it is specious obstructionism, and a deeply anti-scientific attempt to argue that we cant know anything.
Implying that no one cares about the issue regarding this work, as many in this thread have done, while in the SAME DAMN THREAD we have been discussing the CRN as a new experiment being set up precisely to deal with the inhomogeneity issue going forward, is worse yet.
Adn decrying as off-topic outside qualitative lines of evidence that themselves show that temps are reaching new recent highs, and therefore are confirmatory evidence that it is unlikely that Hansen’s ‘near-new’high’ recent trend is certainly not overstating the temps by much.. well…
#159 Lee,
What is being done here is trying to find the limits of what we know. Define the error bands.
Properly defined error bands have lots of uses. It is good to know the signal to noise ratio. That helps define the confidence level of any signals found.
How many decimal places are good? Always a good scientific question.
No, Simon, that is NOT what is being done here. The Surface Stations project data that is PUBLISHED already on the web, is useless in its published form for any purpose except to denigrate the extant analysis, without any countering analysis or basis. Ther si nothign quantitative – nothing that adds to understanding of “error bands.” There is a nice handwaving opportunity to say the surface temp record is useless – and not a damn thing more, so far.
And its being PUBLISHED on the web in this state, without even a warning statement that, hey, this information is USELSS in its current form, before analysis and corelatin wit hthe temperature records at each site, and checking to see if the siting issue actually have an effect on the temp record, and so on. People ARE using it, increasingly widely, to say the surface record is meaningless.
That isn’t science, that is propaganda.
As I have been recently pointing out, there is a lot of qualitative confirming data that temps are moving into new modern-era regimes. If anything, that confirmatory data is implying that Hansen is, if anything, UNDERREPORTING the actual temp increase. Ignoring all that is ALSO not science.
Re: #94
Assuming your post is an accurate assessment, then why are any adjustments made to the raw data? According to your assessment, the trend will still be there. AFAIK, no one’s disputing a warming trend’€”it’s been warming since the end of the LIA, just as it always warms after any ice age. The question is whether or not the additional CO2 is the main cause or if it’s mainly natural.
#163 Lee,
critically important piece of knowledge about the world.
You are telling me that a system that varies over a range of 120 deg F in a year’s time is going to be seriously disturbed by a predicted 5 deg F change? You are telling me that the biota will not adapt? That adjustments will not be made?
There seem to be some scientists who predict we are going into a cooling period. You know those silly solar magnetic people. Could they be right?
You are telling me that we must assume a signal which is less than the noise because a signal which is hard to find will have big effects on the system? Doubtful. That 120 F yearly variation and 20 F daily variation tends to anneal out the effects of very small very low frequency variations at least until they get significant relative to the yearly variations.
Lee, you wrote:
Wouldn’t those sea ice extents still be at record highs if the record high was, say, +0.2C anomaly rather than +0.8C? Wouldn’t the sea ice extents also continue to decrease if we remained at a record high anomaly, even though there had been little change from that anomaly for a number of years?
Record low sea ice extents are a proxy for record and sustained temperatures. They aren’t an indicator of how warm it is, which is something we need accurate meteorological station data for. And they aren’t necessarily an indicator of increasing record temperatures, due to the inevitable lag. This is why we are discussing the ability of the network to measure trends, and why the introduction of sea ice anomaly to the discussion is a complete furphy.
#165 Lee,
Am in complete agreement. The data is not very good. A truly sad state of affairs. My condolences.
#165 Lee,
I’d love to put an error band on it but I’m not yet sure of how bad it is. When I have something more definite I will get back to you. At this point all that can be said is: “I hope the rest of the network is better than what we have seen so far.”
168, woods
It is one line of evidence. I did list others, and could have listed more. Among other things, large scale spatial coherence of the anomaly data, with different degrees of warming in different places but similar degrees of warming across large areas, argues that the patterns are not from siting issues – unless you argue that the effect on temp trends of siting issues also shows large scale spatial coherence. The parts of the US that show little or no warming – the lower MS valley and southeast, for example, are also the places that show no change or little change in dates of spring and fall frosts, for example -arguing that the calibration of the temp ‘zone’ of little/no change to zones of little/no qualitative climate change is reasonably close.
Simon, if you don’t think a 5C temp change would have significant impacts, you need to talk to a few farmers, or water engineers, or electrical grid engineers, or very likely, people living less than a few feet above sea level – which is a LOT of the world’s population. Or any of a very large number of other people, including a hell of a lot of field biologists.
I thought that claim had died a not-so-graceful death some time ago. It is even sillier now than when I used to see it more often.
re 170 –
“I’d love to put an error band on it but I’m not yet sure of how bad it is.”
At this point, yo HAVE NO IDEA WHATSOEVER if siting problem have damaged the Hansen analysis. None whatsoever. – because the site photos are not in themselves information that can be applied to that analysis, and all you have are photos.
Lee,
You can only properly adjust the data when you know the error.
What is the adjustment for cement? Over time? vs distance.
#173 Lee,
Totally agree. What is needed is to install 40 or 50 more sensors at each site so we can get a better idea of if there are problems and if so what is causing them and by how much.
We need to get on this right away before people start believing that the proximity of 20 or so air conditioners is in any way significant. Or that trees matter. Or nearby buildings. Or parking lots. Or radio transmission towers Or any of that stuff.
I propose we vanquish the deniers with data.
Get some.
Lee, as you point out, the Arctic sea ice is decreasing.
Globally, on the other hand, there has been no change in the sea ice since 1980:
Perhaps you’d be so kind as to explain why one pole warming and the other pole cooling is evidence that “temps are reaching new recent highs” …
w.
#171 Lee,
If people want to live close to variable geography that is fine with me.
My advice to people living close to the shore? “Run for your lives before it is too late” the IPCC predicts a 3 mm per year rise in sea level. That is one foot in a century. Think of the devastation that wave would cause if it happened all at once. A one foot wave is unprecedented. It will be the end of civilization as we know it. OTOH “surf’s up”.
Lee,
Is the current temperature ideal or should it be adjusted up or down? By how much? How much variability ought to be allowed?
If it starts going down by too much what should we do?
Who decides?
Lee,
So all the work put into adjusing the UAH satelite records was just a pointless waste of effort because it was simply an auditing exercise the brought nothing new to “science”?
Your argument seems to be that in the end this whole surfacestation effort, which is not costing you anything, will be pointless because all the errors will cancel out and the trend will remain essentialy unchanged. So why worry? Are you afraid someone will latch on to a small amount of data and make some ridiculous claim about how all life on the planet will not be coming to an end?
Not everyone can make major scientific breakthroughs but replication and verification can be important as well.
#94 Lee,
So you are seriously claiming that there has been no increase in urbanization and resulting concrete and asphault around these sensors in the last 100 years?
How can Hansen correct for microsite problems when he has (by his own admission) never examined the stations?
ALL of his adjustments are done by comparing one station to another, making the assumption that the “rural” station has no microsite or UHI issues.
As Anthony has demonstrated, that assumption is not justifiable.
#104 Lee,
You can only do that if the nearby stations are free of microsite issues. That is quite clearly not the case.
U of A states that the sensor is on a site in which asphault has been covered by gravel.
1) gravel is not the same as rock and sand.
2) I doubt that for most of the region, bedrock is only a few inches down.
3) Unless the asphault is thermally isolated from the rest of the parking lot, the heat gathered by the uncovered asphault will be conducted into the asphault under the sensor.
Lee,
read up on PDO and AO.
As you note, the ice varies in thickness. Looking at how much of the water is covered by ice is a meaningless number. It tells you nothing about the total amount of ice in the system.
Lee,
That’s an interesting argument you’ve got there. You go straight from acknowledging problems with the surface temperature network, to claiming that this same network is showing us that the world is warming.
These are incompatable statments. If there is problems with the data, you can’t make any claims regarding what the data is showing.
The extant of sea ice in the arctic has as much, if not more to do with which way the wind is blowing than it does the temperature.
Blow one way, and the ice is pushed into the Atlantic. Blow another way and it piles up against Canada or Russia. When the winds blow fast, the sea ice is piled up against a continent and get thicker, which results in less total coverage. When the winds are less strong, there is less piling up and greater coverage.
Before you can claim that sea ice coverage means anything, you have to account for the other things that have changed.
Which takes us back to the surface temperature network. We are documenting that the many factors that affect the temperature that these sensor read, have not been held constant. You claim that it is possible to tease out the real data from the noise. But the only evidence you have presented to support your case, is the claim that Hansen has managed to do it.
RE 165. Is the surface station data as published useless?
No. The data in some cases confirms the metadata and in
some cases disconfirms.
For example, elevation data is confirmed by a site visit, coordinates
are confirmed and improved. AND where sites are designated as Rural
but found to be infected we can disconfirm the lights=0 theory.
Very narrwly, surface stations is a audit of metadata and potentially
and improvement. ADJUSTMENTS to the ‘land record’ come much later.
So watts has put the nighlights out. I know it’s discomforting
Lee, I am disappointed that you chose not to or could not reveal how much Hansen’s adjustments assume some degree of compliance of the sites and how an incorrect assumption of that degree might affect the adjustments and the uncertainties involved. I get a feeling from your reaction that you may be embarrassed for those who have made claims of quality about these sites and are attempting to minimize the repercussions of that and over reactions to that by noting that Hansen valiantly attempts to extract a trending signal from the measurements.
When exposures such as those made by the pictures come to the fore it is not unexpected that there will be over reactions on both sides. The best counter to that is an improved understanding of the effects and processes involved.
We do have satellite measurements that also detect a warming trend and at some point I would think the scientists involved would chose a standard there and then perhaps rely less on the surface stations. In the meantime I would think the adage for the surface stations would be if we are bothering to making a measurement why not do it according to some already agreed upon standard.
For the historical record it would seem that the pictures would initiate an effort by the involved scientists to show how much (or little) their adjustments depend on the assumption of compliance to a standard. Remember that adjustments to the temperature records, at least for the US, make up a large fraction of the warming trend. Another problem with making adjustments to poorly measured data is that with sufficient errors in the data one can look for those errors (and legitimately find them) that “correct” a trend in one direction when in fact errors could be more random than that and need someone looking for them in another direction.
Well, I see that Lee has successfully hijacked this thread. If everyone would just ignore the trolls, they would be much less effective at disrupting the discussion at hand.
Kenneth,
What Lee is saying is that it doesn’t matter how crappy the sites are, Hansen has developed a super secret method for extracting the data from the noise.
And if we aren’t willing to take Hansen at his word that his “method” works, and is perfect, then we just aren’t real scientists.
Before this ship breaks up, I would like to reiterate the point that the various data takers have differing purposes, which notion was new to me. Climate people want data uncorrupted by UHI effects. Emergency responders, utilities, and weather reporters want worst case measures, so the more asphalt in the summer the better and the more wind in the winter the better. Aside from the much discussed and appropriately maligned adjustments, the only useful suggestion I saw was to split the data sets. If that leaves us with no data younger than decades, is that better or worse than creating erroneous data?
176, willis,
as you know, while Arctic sea ice is shrinking, Antarctic sea ice is not changing. The slope of the Antarctic trend is slightly positive but not statistically distinguishable from zero. That slight positive slope for Antarctic sea ice extent is itself trending toward zero as we’ve added the last few years data, as those years have each shown steady but slight reduction in ice extent. Too early yet to tell if that is a trend, or just annual variability.
The Southern Ocean is warming strongly, as is the Antarctic peninsula. Coastal Antarctica is neutral to slightly warming. Interior, with the exception of the zone on the Antarctic Plateau, nearly right at the pole, there are regions of slight cooling and of slight warming – much of the interior antarctic shows no overall trend.
There is a really interesting anomaly right at the pole, on the Antarctic Plateau – which is geologically completely distinct from the arctic. Ground/ice surface temperatures in that one region show strong cooling since the early 80s, and it is not understood. Hypotheses include a strengthened southern vortex, increased precipitation due to increased evap from the warmer southern ocean and then condensation into snow at cold higher altitudes, or effects from ozone depletion.
Overall, the southern hemisphere from the southern ocean down is neutral to slightly warming. That breaks into a strongly warming overall pattern, mostly neutral in the antarctic interior, with one really interesting strongly cooling spot on the Antarctic Plateau, at the pole, superimposed on that.
None of this is at odds with the claim that overall ““temps are reaching new recent highs” or that all of those things I listed, including arctic ice loss, are consistent with this.
a general comment – I am simply not going to be bothered to respond to the people who wont read what I actually said, and who instead respond from their their fantasies about what I must really be saying.
Re:192
Lee,
Having in fact read the points you make in #192, could you pls explain/comment on the extreme lows that have occurred during the 2007 SH winter so far [e.g. snow twice in Santiago de Chile; first snow in Buenos Aires since 1918; people dying of extreme cold in Peru; lowest temps in Brisbane, AUS since foundation; coral bleaching due to extemely low temps along the Great Barrier Reef, etc.]? Much obliged.
re 194, tetris.
“could you pls explain/comment on the extreme lows that have occurred during the 2007 SH winter so far”
Sure. Be glad to. Weather is not climate.
I think I’m going to throw up.
LOL. Now, just WHY did you have to add that statement? “There is a chip on my shoulder, and I DARE you to knock it off.” LOL.
165, Lee says:
Would you please point out some of this “qualitative confirmatory data?” Which posts? (BTW, did you mean quantitative?) I won’t hold my breath.
When it’s warmer than average, weather is climate.
When it’s colder than average, weather is not climate.
It’s really simple.
Re: 195
Lee
I trust you’re not trying to convince me that the Ross Shelf showing an 0.2C p/a upward trend from -60C to -59C is somehow indicative of climate change, but that the Brisbane historic record lows and the coral bleaching due to record cold water, etc., are merely freak weather phenomena? When does approx. 10 years worth of satellite-based surface temp trend data since 1998 [NH stalling and SH down] become part of the climate record?
200, tetris,
You’re playing the cherry-picking game.
You can not simply arbitrarily pick an exceptionally warm year as the start point of your period, compare everything after that to the one exceptional year,and pretend the entire prior record does not exist.
Well, you can, but it does not give you valid answers.
Lee,
Why not? The alarmists do it all the time. Like when they tell us that the Arctic is the warmest in the last 50 years, without letting on that the Arctic was warmer than today back in the 30’s and 40’s.
Re: 176
Willis:
I’ve seen that graph before and tried to follow the link to the data, but it did not work nor could I find the data anywhre on the KNMI site. Would you be so kind as to repost the link?
Thank you,
Ken
MarkW – I’ve seen willis claim to that effect. Making that claim requires him to limit his analysis to 70-90 – a latitude band with EXTREMELY sparse sampling going back in time.
Here is willis’ analysis:
http://www.warwickhughes.com/cool/cool13.htm
Look at the graph for 1880 – 2004. Please note immediately that willis has not included error bars or bands. Uhh.. willis? How many times have you knocked others for this?
Now, look at what Stoat has to say about this. Note that in his graphs (including the 70-90 graph, the latitude band willis used) he included error bars, and also includes a measure of the percent of surface represented in the sampling. For 70-90, it is EXTREMELY sparse before about 1950. climatologists don’t tell us the arctic was warmer then, for 70-90, because we don’t have the data to tell us so, one way or the other – willis’ attempt to ignore basic statistics notwithstanding.
http://mustelid.blogspot.com/2005/11/arctic-temperature-trends-and-data.html
And finally, look on page 35 of this report – its a PDF, and it includes temps for 60-90, where we do have data, going back to 1900. it also has no error bars, and it of necessity under-represents high latitude portions of that band in earlier data – but it certainly does not represent hiding data more than 50 years ago.
Click to access ACIA_Ch02_Final.pdf
Here is a review of the 3 surface temperature measuring systems (NOAA, GISS and HadCRUT) 2 radiosonde systems (RATPAC and HadAT) and 2 satellite systems (UAH and RSS).
Re: 201
Lee
Cherry picking? Don’t think so: 1998 remains the pivot; even Hansen’s fans have stopped trying to work their way around that one. No, the real cherry picking was done by those who are wizardly good at that [watch the movement under the silk kerchief and poof, no MWP and no LIA].
What about the decrease in NH temps from the 1930s to the 1970s, and the upswing between the mid 70s and late 90s? Are we merely dealing with oscillations in weather patterns?
some pivot:
Re: 207
References/source? Data for the period after 2002 would be important in order to see what the mean does based on the past 5 years. Are there any reliable sources that mesh this latitude data with a longitudinal analysis [i.e. 23.6 N-23.6 S through, say, 1 W-123 W]? This material is not particularly convincing. As is, graph [b] looks flat after 2000 and [c] looks down. The “Global Temeperature” graph is completely meaningless and illustrates the single most salient falacy in the AGW-morph-Anthro Climate Change storyline: there is no such thing as a global temperature [just as there is no average of the numbers in a telephone directory; -55C on the Ross Shelf cancels out +55C in Timbuktu..].
tetris, you’re hopeless. You LOOK at a graph and start cherrypicking parts that match your notions.
BTW, there is no global temperature in those graphs. There is an area-adjusted global temperature anomaly. But I’m sure you knew that, and just offered the irrelevancy about global temperature out of a sense of whimsy.
Ugh, I’m going to stop using numbers…
–
John Pittman, you are right on with what pictures can help us do. Probably why so much loud screaming about how they are worthless….
–
Lee, I agree with you on most of that paragraph.
However, it is not the BEST data we have; it’s the only data we have. And if the sites are ranked as to how much we can trust it then we can exclude the sites that have corrections for things that are a) uncorrectable or b) unknown as to effect. For example, if all stations are 5 feet high on the sensors, sensor sites at 25 are removed. It’s simple. Not time yet. I totally disagree with your last paragraph that the web site is doing anything like ‘arguing the surface record is useless.’ and I think it’s obvious that ‘we won’t know anything until we get reasonable coverage and analyze everything’. As Kenneth said later, “The pictures are only evidence of a lack of quality control.”
You are over analyzing everything, and I think you’re drawing all the wrong conclusions. Maybe not from some people, but I don’t remember much of anyone (if anyone) claiming that ‘the surface record is useless’ because of the stations themselves. What the data means is another issue, and regardless of the answer to that question, we still need to identify which sites are or might be corrupted, and remove them if we can’t understand how to reliably correct them! What is so difficult to understand about that?
–
I’ll give everyone an example of what some of this all means. Imagine you have some network traffic you want to rate limit. So you want 100K at most going through a circuit. So you put a 100K rate limiter on it. You send through 130K of traffic, and 130K goes through! It’s not rate limiting. Hmmm, you think, things are broken!
Well, no, you just didn’t understand that that “100K” was an average, that different sized packets (between 64-1518 bytes in size) were limited differently, as were packets limited by either addresss or port or type or some mix of those. So in actuality, with your traffic, you had a 50% margin of error. You had to exceed 150K in order for the rate limit to take effect and even then, there’s still around a 10% variance between requested and actual rate limit.
–
And S. Mosher is exactly spot dead on once again. The answer is not “we adjusted for several factors” it’s “HERE IS OUR CODE, check all you like! we are confident in our code.”
Until that happens, there is no reason to trust.
Re: 209
Lee
Possibly a bit difficult to convince. Comes from 25 years of experience, I guess.
As per my previous response, could you pls provide reference/source for the graphs.
Is there reliable data pertinent to the 5 year temp anomaly mean for each a, b and c that covers out to 2006 or better yet out to Q2, 2007?
Are there reliable studies pertinent to temp anomalies that intersect the latitude based sections longitudinally?
The latter would be very useful as it should enable us to better understand large regional climate dynamics. Keith Tremberth recently stated in a Nature blog that without a better understanding of climate at the regional level, climate models [IPCC endorsed or otherwise] are meaningless. We sorely lack this type of data, let alone relevant analysis. I think he is spot on, and my argument stands that any data [be it anomalies, actual temps or anything else] and attendant analyses or models that purport to tell us anything at the global level are complete nonsense.
tetris,
are fyou for real?
You baldy state that anything I post on global temp changes, you will treat as complete nonsense – and yet you ask me to post such stuff?
Once more today – the url for those pics is available via any modern web browser.
This is standard analysis from the usual suspects. If you can’t find, or don’t already know, where that came from, you really don’t have enough information to have any business pronouncing as if you know something on this topic.
In firefox you can right click on the pics and hit properties. URL is displayed.
[off topic]
Ken Robinson, the KNMI data is available here.
w.
Lee, you say:
Sorry, Lee, but I don’t know that. I have given you data with a citation that shows your claim is not true. Perhaps you have a citation showing that the Antarctic sea ice cover is not changing … until then, I’ll believe the data over your bland assertion.
w.
O.7% +- 0.8% per decade
http://nsidc.org/data/seaice_index/
and you can look at the monthly Reynolds sea ice data, for -50 to -90, 180 – -180, 1981-now.
http://climexp.knmi.nl/selectfield_obs.cgi?someone@somewhere
I thought this thread was about whether measuring temperatures near asphalt is a good idea or not. How annoying. I’m struggling to find historical pictures of my airport, so I can determine how the coverage of asphalt changed since 1934 (the year records start). I know it has changed, but the extent is difficult to measure (Google Earth wasn’t available in 1934). If I am having trouble (and I live in the locale), then certainly NCDC haven’t spent the time researching land use changes around this observation site. I would not know how one would “correct” this data to get useful information out of it.
My airport (Billings Logan Intl Airport) is showing a warming trend (not a USHCN site), but a site 20-30 miles to the east (Huntley EXP Station and a USHCN site that is rural) is showing a cooling trend. I am pretty certain that there has been land use changes around Huntley that affect temperature records…namely irrigation of crops (cooling effect?) How would one figure out how much irrigation was done from year to year and how would that translate to a correction to the trend?
I don’t believe that data can be corrected for land use changes around an observation site.
Virgil
Re: 212
Lee
I am very much for real, as a good number of people in business and science would tell you. It’s just that over the years I’ve developed very sensitive arm waving detectors [Steve M has asked that we use nice language], which is what I have been getting from you all day.
I don’t prima facia accept the data you put in front of me. Happens. And incidentally, URLs are not the issue.
I ask you some straightforward questions about the possible existence of other relevant and useful data. Nothing unpleasant there I would have thought.
I refer to Trenberth’s argument that we absolutely need to develop a proper understanding of regional climate dynamics before we get lost in [in his opinion] completly meaningless “global climate models”, an argument which makes good sense to me, and I get yet more arm waving.
If you can’t or don’t want to deal with my questions or the issues I raise, just say so. Preferably with a coherent explanation so the others on this blog understand why. That’s OK.
If you don’t agree with Trenberth, say so. That’s OK. Publish a rebuttal on the Nature blog if it makes you feel better. But please, no more highminded arm waving and ill disguised ad hominems.
Look forward to your answers to my questions.
As posts 204 and 207 are still here, perhaps I may be permitted to follow their digression…
re 204: ‘cool13’ The reference contains one of those ‘we know it’s not, therefore’ arguments I dislike. ‘The 1880s warming occurred before CO2 levels rose, therefore it’s not man-made warming’ is a rough summary. No, we know it’s not CO2 warming — we don’t know what caused it (or, allowing for chaos we don’t even know if it just happened). There are other possible anthropogenic causes for global warming.
re 207: final graph. I really hate this graph. It contains a gross distortion, the ‘bucket correction’. Until some enterprising climate scientist sorts out the SST record from 1910 to 2007 then we will have very limited understanding of what was going on.
Good data is the only path to truth. But if some bright young thing sets up a website and begins to collate all westerly facing lighthouse data to recalibrate the SSTs, there will be defenders of the paradigm who will bitch about his or her motives. Follow the data. It doesn’t matter if it refutes your favourite theory, it doesn’t matter if your house of cards falls about your ears. If you’re a scientist then all that matters is the truth.
Mind you, I would say that: I can see the Kreigesmarine effect on the anomaly graph on Warwick Hughes site…
JF
Anthony, does your copy of the CRN standards contain a cut and paste error, or is the definition for class 4 and class 5 actually verbally identical?
I looked over your surfacestations site, and I thought I’d seen this previously linked to, but can’t recall where it is. Thanks.
There’s an interesting article on Phoenix here. A quotable quote:
And UHI has no effect on the weather data? Really? Eight degrees of urban warming in fourteen years …
w.
Willis, perhaps it is not UHI so Urban Sinking — with the additional population, Phoenix is sinking. Three degrees per thousand feet, isn’t it? 😉
Maybe it’s just that my math is weak, but I could have sworn that 8C is greater than 0.05C.
Maybe we should ask Mr. Jones about that?
And that’s assuming that there has been no contamination of the Casa Grande National Monument station in the last 57 years. From what we have seen of the development in and around other parks, I would not be quick to assume that there has not been any contamination.
223:
Yeah, and note the definite TREND there. The anomalies can’t wipe this out.
My bad, I was half asleep last night, should have been 8°F of UHI warming in just over 50 years, with a quarter of that warming happening in the last seven years.
w.
… still half asleep, but it’s the other half …
One Trackback
[…] http://www.climateaudit.org/?p=1862 […]