Ray PH reported at RC an AGU session describing the very interesting recent discovery of organic material disgorged from a retreating glacier N of 70N on the east coast of Greenland, with radiocarbon dates around the MWP.
To put things in perspective, I should first mention the talk by Tom Lowell, on work in collaboration with about a dozen other authors, concerning organic remains from the Istorvet Ice Cap in East Greenland. These are organic remains recently uncovered by the retreating glacier. Dating them tells you when the glacier had last retreated that far. Carbon-14 dates put the date of this earlier glacial retreat to between AD 800 and 1014, bracketing the time of the Norse colonization. Insofar as glaciers are primarily sensitive to temperature, that does indicate that in the Middle Ages this particular place, at least, was probably as warm as at present. It is an indication of some kind of regional warming in the area in the Middle Ages. Thus, if Greenland were taken in isolation, one couldn’t confidently say that what is going on there just now is completely unprecedented in the Holocene at least not yet. However, as Tom would happily tell you, the Middle Ages were not as generally warm as the present, and Greenland shouldn’t be taken in isolation. It is the rapid melt in Greenland today, taken as one of a vast constellation of signatures of unusual warming, that gives one cause for concern.
The abstract for the AGU presentation entitled “Organic Remains from the Istorvet Ice Cap, Liverpool Land, East Greenland: A Record of Late Holocene Climate Change” by Lowell, T V, Kelly, M A, Hall, B., Smith, C A, Garhart, K,: Travis, S, and Denton, G H states:
Radiocarbon dates of emergent organic remains along the western margin of Istorvet ice cap (70.8°N, 22.2°W) indicate a time when the ice cap was smaller than at present. This ice cap, similar to others in east Greenland, exhibits “historic” moraines ~1-2 km in front of the presently retreating ice margins. At Istorvet, ice margin retreat has exposed a thin (~8 cm) organic horizon and in situ plant remains in bedrock cracks lie less than 10 m away from the present ice margin (453 m asl in 2006). Clusters of multi-species vegetation also were found on two nuntaks (to 719 m asl) located ~3 km from the historic drift limit. All organic remains were located in protected bedrock lees. On the west side of the ice-cap, vegetation is sparse but present at elevations near the ice margin. Both the ice cap geometry and the presence of overrun organic remains indicate past temperatures at least as warm as those at present. At Istorvet plant remains yielded 12 number of radiocarbon dates. These ages, when converted to calendar years, range from A.D. 400 to 1014, with the largest concentration from A.D. 800 to 1014. This work hones the conclusion of Funder (1978) who reported general climate deterioration since 800 BC. Moreover, it indicates warm conditons at this latitude at the time of Norse colonization of Greenland.
I emailed Dr Lowell asking both for a copy of the presentation and the proxy basis supporting Pierrehumbert’s statement that “Tom would happily tell you [that] the Middle Ages were not as generally warm as the present”. He promptly and cordially send me the first but not the second.
The dated organics are located in 4 sites near Scoresby Sund (70 45N 22W) on the east coast of Greenland. The reported dates are from a site near Istorvet, Liverpool Land. The majority are from 1040-1190 BP; a couple earlier 1380, 1590 BP. The dates are somewhat early relative to usual MWP concepts and Lowell is mulling over explanations and possibilities. The presentation states clearly that the organics are “within 280 vertical meters of ice cap summit” and located “where comparable modern assemblages do not exist”
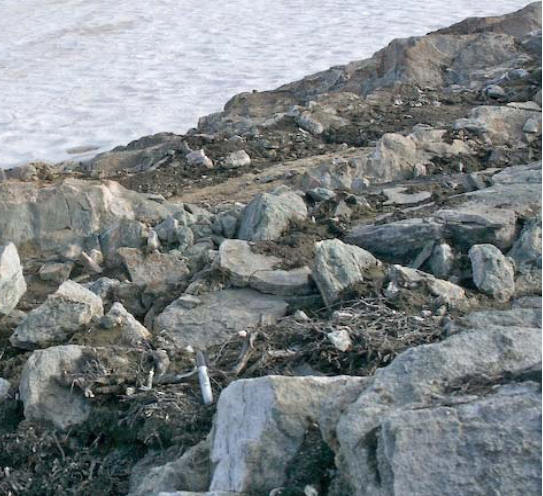
Here are a couple of pictures of the organics from the AGU presentation:
 |
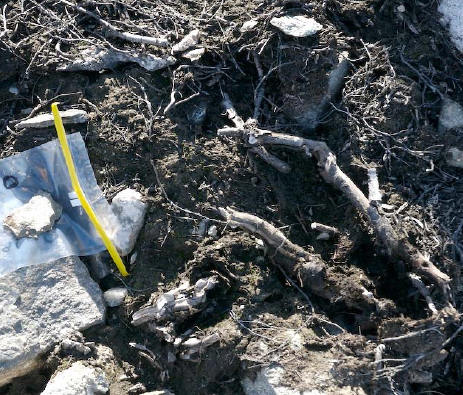 |
Two pictures of Istorvet Organic Material from Lowell et al 2007.
There are a few things to think about.
First, the dating seems a little earlier than one expects (or that Lowell expected.) In ocean sediment studies, one sees radiocarbon dates routinely adjusted for reservoir effects: could something similar arise here so that the dates are adjusted by, say, 200 years. Just a thought.
Second, over the past few years, when organic material is disgorged from retreating glaciers, people sometimes ask: where is the MWP material if it was supposedly as warm as the present? If one is looking for an example from Greenland with impeccable provenance, Lowell and coauthors have provided one. Whatever climate yielded the Istorvet organics would have applied to other parts of Greenland and the presence/absence of dated organics in any individual site would then be a matter of happenstance.
As to what amount of Arctic sea ice would be consistent with the observed MWP glacier retreat at Istorvet, east Greenland, I’m sure that we’ll hear about it.
In his comment quoted above, Pierrehumbert said that Lowell would “happily” say that the MWP was merely local to Greenland. As noted above, Lowell did not respond to my inquiry about this and so we are left to wonder about whether he actually holds this view and, if so, what the basis of this view is.
In 2000, Lowell wrote an interesting article for PNAS entitled: As climate changes, so do glaciers.
In respect to the MWP, Lowell stated:
A recent Northern Hemisphere temperature reconstruction indicates an oscillating temperature drop from A.D. 10001850 of about 0.2°C with a subsequent and still continuing warming of nearly 0.8°C (3).
You can easily guess what reference (3) was. So once again, we see the continuing application of MBH99 in hidden contexts: how do we know that “the Middle Ages were not as generally warm as the present”? MBH. It supposedly doesn’t “matter” but here it recurs once more to excuse inconvenient facts.
In Lowell 2000, the dominant view is that glacier changes occurred more or less concurrently around the world – a view illustrated by the Little Ice Age, the Younger Dryas and an episode prior to the Younger Dryas. Lowell stated:
Additional examples would confirm that, during the Little Ice Age, glacial systems expanded in concert and then withdrew together Because many glacial margins began retreat (A.D. ‘18501900) before the introduction of significant amounts of human-induced greenhouse gases, at least the initial part of the warming is a natural swing in the climate system. The continued warming and subsequent glacial retreat have uncovered buried forests in the Canadian Rockies (8) and elsewhere that are several thousand years old, which would require that these glaciers were once smaller than their present size. Such observations help define the range of natural climate variability.
and in connection with the earlier changes:
Do glacial systems respond to global climate changes? In addition to the global behavior during the Little Ice Age, two major glacial events at the end of the last Ice Age showing similar patterns from the mid-atitudes in both polar hemispheres and from the South Pacific and North Atlantic basins suggest that they do. … Before the Younger Dryas at the time of maximum continental ice volume (and hence the approximate low stand of global sea level; ref. 15), glacier systems made one final push…. along the eastern side of the Pacific, glaciers pulsed together, indicating a common climate forcing.
The entire tenor of Lowell’s article – that there were more or less synchronous changes – is inconsistent with the usual Team argument that the MWP was a dog’s breakfast of regional ups and downs, with negligible overall impact. To the limited extent that Lowell 2000 expressed an opinion on relative medieval-modern warmth, he merely cited MBH – hardly a high or independent authority. It’s possible that he holds this view and that he has alternative reasons for holding this view, but, to my knowledge there’s no evidence of him holding such views or providing an argued basis for them. So I don’t know whether Pierrehumbert had any basis for putting these words in Lowell’s mouth or whether he just assumed that Lowell would adhere to the RC party line.


92 Comments
What do they use as justification for the assertion that any melting today is any faster than in previous warmings ?
Excellent argument Steve. There is so much qualitative and guantiative evidence published in the journals that periods during the Middle Ages were as warm or warmer than today all across the globe. Reconstructed globally averaged temperatures should reflect all that research. [snip]
#2. The argument isn’t conclusive or else the matter would be settled. I’m more inclined to think that much of the proxy “evidence” is inconclusive as opposed to holding that it definitively shows the opposite. Here I’m commenting on the on-independence of Lowell’s citation of MBH as evidence of a cool MWP.
Steve writes,
That doesn’t work. The plants were fed by airborne CO2, with about the same C14 as the air that fed the trees that were used to dendrocalibrate the raw C14 ages. Seawater has older C14 on average, because a lot of its carbonate is redissolved shells, runoff from limestone, or stuff that’s been in the foodchain for a long while, whence the reservoir adjustments. The reservoir effect can vary a lot with location, however. (I actually read an article once on complications of Arctic C14 dating for reasons unrelated to AGW.)
For what it’s worth, Craig’s corrected reconstruction (which doesn’t look much different than the published one) shows a global warm spell starting around 600 AD, though it gets even warmer c. 820-1040. My se’s show that most of the latter period is significantly warmer than the bimillennial average @ 95%, but a little of the 7th and 8th c’s are significant as well.
Of course, Greenland could have just been a little warmer than the global average early on as well.
In other words, Greenland’s an exception that we can’t draw general conclusions from, so we can draw the general conclusion from Greenland that the present is exceptional.
So, Manns CO2 adjustment has been corroborated by glacial response. Interesting to see these connections.
I’m confused. in the MWP greenland was an isolated zone, teleconnected to nothing.
But today it’s the carnary in the coal mine?
How well does greenland work as a proxy for the global temp? Better than a bristlecone or worse?
hmm
Ah, nice to see some use for Mann’s CO2 adjustment.
Further evidence that the “Green” in “Greenland” was more than a 13th century real estate come on trying to dupe suckers into buying into a God forsaken place. I even hear a so called “conservative” talk host a few days ago putting down a caller who said Greenland was Green in the day. The meme of “the MWP was local” is difficult to overcome. It’s just like the “local (to US) warm 1930s” meme.
It strikes me that the temperature at an ice field margin where organic material has just been uncovered is likely still much cooler than the temperature that prevailed at that location when the organic material was actually growing.
I think comment 10 makes logical sense to me. If the material found there indicates anything surely it is that if the temperature then was even AS WARM as today why nothing growing today? The suggestion that it was warmer then given that the material discovered was growing there at that point seems logical to me.
Can anyone comment on how accurately we are able to measure the mass of Greenland’s ice sheet? Supposedly, approximate 280 cubic km of ice melted in the last year . . . from an ice sheet containing approx. 2,800,000 cubic kms.
This works out to a loss in mass of about 1/100th of 1 percent.
I asked this question a few weeks back on Eli Rabett’s blog (foolish me :)) and, as expected, received no comment.
Is the state of the science on measuring ice sheets so accurate that they can measure it with confidence to 1/100th of 1 percent? What are the margins of error in these measurements?
Thanks!
I think it is interesting that the early MWP behavior is similar to what we see in Loehle 2007. If you look at Loehle’s plot, note that before the main peaks of the MWP, there is a rise above the zeropoint going all the way back to shortly after 500AD.
That is: Some slightly above normal temperatures between 500 and around 1000 (at least in Greenland). Then the classical MWP as an even warmer period – as opposed to the Mannian blip.
Let me see if I have this correct.. Dr Lowell and company find organic material that dates 200 years prior to the peak of the MWP. There is no organic material growing at that site now. Now it is to cold for plants to grow. Plants were growing then. to my uneducated mind this would indicate that 200 years prior to the peak of the MWP that it was warmer at the site of study than it is now. I think that temp recon indicate that it was warmer at the MWP than 200 years before it peaked.
My pea brain can’t comprehend how that if plants are florishing then how could it have been colder than it is now. Perhaps I am confused but that is not logical to my thought process.
Am I confused.
Bill
http://www.climateaudit.org/?p=1602
Greenland temps over the past 2Ka as directly measured by the GRIP borehole. Since it is local Greenland temps we are talking about, I think that the borehole data is incontrovertable, except that it is forced to an average over time and one can assume that there was more and more variablity that shown the farther back one goes. It does indeed show that temps started rising in Greenland well before the MWP. Interestingly, the Dye-3 and GRIP differ in recent decades. This ongoing process, if the glacial retreat continues, should hint at which is correct.
Presumably, where we are in the process of melting Greenland currently is somewhere on that upward slope which led to vegetation growing where it can’t today. It will be interesting to see how long this goes on. Because, if the MWP was truly not warmer than today, then the vegetation should run out pretty quick or get dated to sometime in the Holocene optimum. That is if the normal logic applies.
Steve: the borehole data is far from “incontrovertible”. I haven’t discussed it much but the inversion is very hairy.
12 Paul
It’s not even that. While the ice may be melting at the edges of the Greenland ice sheet, the interior of the ice sheet is increasing in depth. No wonder you got no answer from the Rabett warren.
I guess that was a little strong, but at least it is an actual temperature measurment, even if it is not perfectly dated and the higher frequency variations are lost. I don’t think you will get flat climaters claiming that it represents precipitation, for example, rather than temp.
#4. If one looks at the calibrations (as opposed to raw radiocarbon), the calibrated ages are typically almost 100 years less and the spreads nearly double. See https://c14.arch.ox.ac.uk/oxcal/OxCalPlot.html On a calibrated basis, many of the samples are not excluded from early Viking voyages.
Reported Sample OxCal(AD)
1090 30 OS59636 892-1015
1040 30 OS59703 920-1033
1170 30 OS59637 776-966
1190 30 OS59533 769-944
1050 30 OS59529 920-1027
1090 25 OS59579 893-1013
1090 35 OS59667 890-1017
1130 25 OS59680 827-987
1140 24 OS59679 782-980
1180 30 OS59580 771-965
1380 30 OS59582 606-681
1590 25 OS59581 416-540
So, am I to assume that warming weather (which is good for most all living things) is actually a deterioration of the climate? Because, I don’t think so.
#14 Bill, AFAICT you are not confused. To get a fair comparison you would have to include the establishment/migration time for a comparable temperature-sensitive plant species to recolonize those areas. As it stands the comparison between then and now is unfair. Wait 10, 100, 1000 years [?] and the plants might again be there.
According to Thompson some of that plant material dates to the great melt ~5200BP. The mid-Holocene thermal optimum might not have been global, but in large parts of the NH it was warmer than the MWP by an [uncertain] number of degrees. Far warmer than today, to say the least.
Please correct me if I am wrong, but are there not similar organic materials (similar as per age) being uncovered in the Alps and in the Columbia Ice fields?
Re: #12 – such statements are based on before-after “measurements” and subsequent data interpretation based on satellite remote sensing. If I were unscrupulous or sloppy, I could easily end up reporting a change in Greenland ice whether or not there really was a net change – or I could report a change the opposite of actual.
There is a photograph of a White Spruce (Picea glauca) taken by Professor Ritchie and included in Lamb’s Volume 2, “Climate: Present, Past and Future” radio carbon dated at 4940 years (±140) B.P, located on the tundra north of the current tree line and as the caption notes “…shows wider growth rings than the nearest present-day spruce forest 80 – 100 km farther south, near Inuvik in the lowest part of the Mackenzie valley.” I understand conditions at least 4°C warmer than at present are necessary for such a tree to exist at that latitude.
Dear Steve, thank you for you excellent post. But I am not amazed. I have seen before a researcher concluding something in contradiction with a prior paper from the same researcher. Instead of telling to the world “hey folks, this is shocking, isn’t it?” they desperately look for bizarre explanations. I can point you to a biology paper recently published at PNAS where the authors try to correlate the mortality of plants with the temperature. No correlation is found. Conclusion?: there must be something wrong. Why? “in light of unprecedented global warming….”, ” maybe the noise of the data has hidden the mortality caused by the warming effect…” , blah, blah, blah.
best
When Ray PH reported on Lowell’s paper that:
he seems to be unaware that the use of term such as “rapid” means that you must be comparing the rate of melt to something else. I would be very interested in hearing what technique one would use to determine previous rates of melting so as to be able to state that Greenland glaciers were melting in the past at a less rapid rate than they are currently.
Have the folks at RC built a time machine?
Jeff Norman (Post 21),
Regarding previous recessions of Alpine glaciers, you’re right. Here’s a paper by some guys at the Uni. of Bern, Switzerland on the subject.
Abstract: Subfossil remains of wood and peat from six Swiss glaciers found in proglacial fluvial sediments indicate that glaciers were smaller than the 1985 reference level and climatic conditions allowed vegetation growth in now glaciated basins…
Re: 12
Paul S,
The topic of measurement errors seems to have been forgotten or ignored in recent years.
I would not expect your average reporter covering scientific topics to be able to perform an error analysis on the papers about which the reporter writes. I would expect that the scientists who write these papers to not just be able to perform an error analysis on their work, but also to do it. I do not see this happening in climate science today.
Green Alps also discussed at CA here.
There should be a mix of Holocene Optimum plant material with MWP. When we will know that we are warmer than the MWP is when the MWP stuff disappears rom the mix and we have only the Holocene Opitmum stuff.
Well, Y, if that spot is representative more generally. Look to the magma. Ice is froth on chaos, and responds locally, first.
=======================
I found a really cool article. Check out Wang, X et al. (2006) “Interhemispheric anti-phasing of rainfall during the last glacial period” in Quaternary Science Reviews. It’s the same people that did the speleothem record from that cave in China (Hulu). Now they got a speleothem record from Brazil. They show that the Holocene Optimum was just in the NH and that rainfall in the SH was anti-phased due to precessional changes in insolation.
Of course, this data is on much longer timescales… but would this type of argument hold for the MWP? Maybe that’s why people say it’s local???? Greenland may get warmer, but the SH gets colder…
This is unusual warming?
From RC:
Perhaps the organic material was planted there by Exxon for the scientists to find?
On the subject of Greenland it is worth pointing out that temperatures have been higher than they are now much more recently. According to Jason Box (Int J Climatol 22, 1829-1847), “The warmest decades in Greenland over the last century were the 1930s and 1940s”.
You can also see this in the NASA GISS data. There aren’t many sites with long records but look at Angmagssalik, Kap Tobin, Godthab Nuuk. They all show 30s and 40s as warm
What is remarkable in the Box paper (Freddy, #1, Brooks #25) is the speed of the earlier warming, 3-5 degrees over 20 years at some sites. #32 Carrick, this is unusual warming!
Steve (#18) wrote,
The first column of your table appears to be raw C-14 ages BP. I’ve converted these to raw C-14 dates AD in the last column below by subtracting from 1950 (year “0 BP” for C-14 dates):
Reported Sample OxCal(AD) Raw(AD)
1090 30 OS59636 892-1015 860
1040 30 OS59703 920-1033 910
1170 30 OS59637 776-966 780
1190 30 OS59533 769-944 760
1050 30 OS59529 920-1027 900
1090 25 OS59579 893-1013 860
1090 35 OS59667 890-1017 860
1130 25 OS59680 827-987 820
1140 24 OS59679 782-980 810
1180 30 OS59580 771-965 770
1380 30 OS59582 606-681 570
1590 25 OS59581 416-540 360
I don’t see how they got either 400AD or 1014AD out of this, using either the raw dates or the midpoints of the Oxford Cal AD dendrocalibrated date ranges, but indeed the raw dates are roughly at the bottoms of the calibrated ranges. Is this their choice of dendrocalibration, or yours? I can’t get the Oxford site to run for me, but it does offer a choice of several dendrocalibration curves, which could make a small difference.
However, this shift is not a “reservoir effect”, but just a reflection of the fact that the atmosphere turns out not to have C14 that was constant at 1950 levels, as had originally been assumed. This is one place, at least, that dendrochronology has actually proved useful.
The reported 30’s, 25’s, etc, are probably standard errors (1 sigma), while the calibrated ranges are likely 95% confidence intervals, i.e. +/- 2 sigma ranges. This would account for why the calibrated ranges are often about 4 times the second column. Because the calibration curve does not always have a unit slope, or even constant slope, when they take the reported age +/- 2 sigma and calibrate the upper and lower limits, the width of the calibrated range can differ substantially from 4 sigma, and the point estimate of the date may not be quite at the center of the 95% CI.
Greenland is a huge place, and I don’t know how close this site is to the two boreholes (GRIP and Dye-3) whose plot is on the CA thread Yorick linked above at #15. However, that plot (pace Steve’s reply in #15) is consistent with considerable warming at even the earliest of these dates. Note that Greenland wasn’t settled until 984AD, even though it was evidently habitable well before that date.
Bill (#14) seems to be under the misimpression that the cold directly suppressed vegetation after these dates. In fact, the abstract says that this area had been under ice until just recently, so that the glacier must have also have receded by at least this much when the vegetation grew. The vegetation was only saved from being swept away by the intervening advance of the ice by being protected in rocky clefts.
But for all we know, there may be even more vegetation even farther under the ice, showing that during this period the ice receded even more than it has at present. Of course, we don’t know that there is such vegetation. But this evidence should not be construed as showing that the ice had receded as far then as now, but rather that it had receded at least as far then as now, as early as 416-540 AD, and maybe even farther, particularly in the later even warmer period.
Everytime I see the title of this thread I think it’s a food or grocery review.
Here’s a description of the very different 19th c climate:
The cold coast o’Greenland is barren and bare,
No seed-time nor harvest is ever known there,
And the birds here sing sweetly on mountain and dale,
But there isna a birdie tae sing tae the whale.
There is no habitation for a man to live there,
And the king of that country is the wild Greenland bear,
And there’ll be no temptation to tarry long there,
With our ship bumper full we will homeward repair.
— George Scroggie, http://www.rampantscotland.com/songs/blsongs_tarwathie.htm.
It is impossible to tell the general conditions around the photographs used here. The material is mixed in with broken rocks in a way that looks like they are the result of a rockfall or some mass movement. The amount of meltwater, freeze thaw conditions, potential for solifluction all create very unstable slopes and conditions around glacier peripheries. In addition, we need to know about the advances and retreats of the glacier to determine if this is material pushed into the present location rather than formed in situ as suggested by the research.
38, would it be safe to say that it’s more likely to have originated at a higher elevation than lower?
Hu, #35, last paragraph: that is an important point. Hypothetical: If we speculate that the ice will continue to retreat, and further speculate that they continue to find vegetal evidence that the retreat is not unprecedented, then must we conclude that we will never know the full extent of the retreat way back then? That we can only say that the retreat now is equal to the one that occurred then? Or is there some way that they could measure the extent of the retreat of the glaciers at the end of the first millenium?
alternate hypothesis: shifting magma delivers heat to southern tip of greenland, melting the ice, plants grow, a viking wanders by, magma shifts again, place freezes, a millenia goes by, repeat. People make all sorts of incorrect conclusions about MWP, C02, climate, etc.
Reminds me of a star trek voyageur episode where invisible advanced dinosaurs were following two crewmen, and coming to all sorts of incorrect conclusions based on infitesimal evidence, but confirming their pet theories.
Hu McCulloch December 19th, 2007 at 10:35 am ,
I was very into sea chanties as a youth. Thanks for reminding me of that one.
Gunnar, #41 writes,
Actually, this site is way north, half way up the E. coast and N of Iceland. Try 70.8°N, 22.2°W in Google Earth.
Hey M Simon did I hear you on that climate debate the other day asking a couple of questions?
>> Actually, this site is way north, half way up the E. coast and N of Iceland
Plugged it into GEarth. That spot is very close to Iceland, a volcanic island, and is suspiciously very green. Both suggest a magma hot spot. I wonder if it’s the same spot as this article is talking about:
http://www.livescience.com/environment/071213-greenland-magma.html
My point is that this paleoclimate stuff is a stretch.
“to my uneducated mind this would indicate that 200 years prior to the peak of the MWP that it was warmer at the site of study than it is now. ”
I would suspect that the material actually lived much farther back under what is still ice and was transported to its current location. That there is a moraine tells me that there is (or has been) movement and so this movement would have brought this material along and some of it was trapped in various cracks and crevices in the rock where we can see it today when the ice recedes.
I read the stuff on RC, and even if the remains of the lost city of Atlantis were found under the ice of the Antartic Peninsula, they would still say and believe that this was just a regional anomaly. AGW and CO2 are their unshakeable belief.
Another thing, At RC they are all so miserable! and worried, at least this site has some self mocking humour and a bit of life!
47, if you were named Gavin or Raypierre or Rasmus (let alone Rabbet or tamino), you’d be rather humorless, too…
RE 47. Humour is about disrupting expectations. Consensus is about maintaining equilibrium.
Power is about maintaining control. Humour is about disrupting control.
It’s not a personal thing.
RE: #47 – RC – Puritans. CA – normal folk.
#20 Bender
Thanks for your explanation I can except that the plants may not have had time to re-establish them selves at the site of the study. My question would then be how long was it warm when they were established before. This works both ways if it has to be warm enough to melt the glacier and maintaing the warmth for an indeterminate time to allow the plants to become established would still indicat to my uneducated mind that it was very possibly still warmer then than now. With respect Bender I am not a scientist and certainly not a climatologist.
#35 Thanks Hu,
I think that you and Bender are telling me the same thing only in different ways. I agree that the area under study has been protected by the ice of the glacier. again this would seem to indicate that the area was warm for quite some time befor the advancement of the glacier.
#46 Crosspatch thanks it helps,
I agree that there would have been movement of the material as the glacier moved and this material now being found might indicate even further reduction of the ice than the current level of melt.
My logic still indicates that if not warmer in the past it was at least as warm and for an extended period of time.
Perhaps Gunnar has found the source of the heat.
Bill
Am I the only one who thinks the stick on the right, (in the picture with the plastic bag above), is shaped like…
… a hockey stick?
🙂
re 50. Have you read Pynchon?
#52 We have found the Bristlecone Pines Mann sampled. Its all clear to me now, they were hiding under the ice, thats why things are getting warmer.
#51 Bill, you’ve got it exactly right. I just expressed it differently to confirm that I understood what you were saying the first time. Once enough time has passed and climate has warmed sufficiently (assuming AGW trend) THEN you could conclude that temperatures of the day are finally equivalent to temperatures of the past. Not until then. i.e. We’re not there yet.
RE: 45
I doubt there is a geothermal aspect involved. Iceland is smack on top of a spreading center, 450 miles away. Greenland is more of a stable craton. There are is no recent volcanic activity in this area, and the rocks are 200 million years or older, as best as I can tell from this geologic map.
http://www.geus.dk/program-areas/raw-materials-greenl-map/greenland/gr-map/kost_1-uk.htm
A new technique involving radar from low-flying airplane combined with Navy satellite date about the crust demonstrates thin areas in Greenland where magma might be contributing to ice melting, presumably without the need for actual vulcanism.
============================================
re 53
There look like there might be some Tertiary felsic intrusives in East Greenland (Map 12; unit 53?). I think this is the same area (Scorsby Sound) where the wood debris was found. From the time scale these are on the order of 35-40 Ma old, so rather unlikely to be a geothermal heat source. Still, I wouldn’t rule out younger volcanics or intrusives in this area.
Sorry, that should be re 56 not 53
The extrapolation of a handful of tree-ring proxies (sometimes one or two?) across the globe provides proof that current warming is unprecedented. Extrapolation of the Greenland warming evidence is wrong!??
Perhaps a good test would be to tunnel up the ground level from the low point of a glaciated crevice to see what has been trapped from past warmer era’s? Remembering the frozen prehistoric traveller that was found in the Italian Alps a few years ago, a populated, and likely travelled route/area could be good.
#46 and others:
It was my understanding that debris from such formations could actually be much further back. The first cause is that as the ice thickens and the weight increases, it forces movement at the base out ward, such that material that is pushed away from where it actually was originally. Next, when melting, also due to pressure, water comes from underneath the ice and travels from the same physics (gravity and pressure). Both of these extend the linear distance beneath the ice that the materials came from. I also think that is why when you read the article it speaks of “in situ bedrock cracks.” I woud have stated that “it is assumed that the material is in its place of origin”, but I believe that is the intent of that section of the work. They say:
So, the assumption is that the material was protected and the nearby growth indicates that growth is likely. Therefore, the authors conclude that this expanse is at nearly the same temperature as during the time periods radiocarbon dated. Otherwise, due to the above reasons about detritus travel, supportable conclusions could hardly be asserted.
#60
If it supports CWP > MWP teleconnection distances of thousands of km are tolerated.
If it supports MWP > CWP teleconnection distances of tens of km are tolerated.
If it supports CWP > MWP spatial databasing errors of thousands of km are tolerated. (The rain in Maine …)
If it supports MWP > CWP spatial databasing errors of even one kilometre are not tolerated.
Do all glaciers move? I am certainly aware that many do. If so, this suggests that the organic material found would have been well inland when it was growing … Which in turn suggests that the
glacier’s extent would have been far less than it is today and therefore the MWP must have been significantly warmer than today…
Re #64
That’s certainly possible, however there are other interpretations, for example suppose that same glacier is in a state of retreat today and that we keep conditions the same for 50 years say, it’s reasonable to suppose that the glacier might continue to retreat until it reaches an equilibrium position?
Therefore it could have been the case that the glacier in question had been at the same temperature as today for a prolonged period allowing plants to grow there and the glacier to be stabilised further inland, and then a change in climate (temperature or precip) which favored growth of the glacier caused it to overrun the area in question.
#56, 57, 58
kim is obviously right, the lack of a vulcanism certainly does not imply that it’s not a hot spot. If you look at Google Earth, the area is very close to this spreading fault that goes through iceland. Also, it’s quite far north to have a big green spot, ie there is plenty of ICE to the south of it. If this warm spot was the result of climate, why isn’t it warmer further south? Try 70.8°N, 22.2°W in Google Earth. It’s a very suspicious green spot.
>> Do all glaciers move?
Yes, by definition, since a glacier is a river of ice. However, this could simply be melting ice pack, which is stationary.
>> well inland
Again, take a look at the GE image. If you did, you would see that there is no inland. It’s on this big peninsula, surrounded by water, which could also be a warming factor. The chunk of ice is isolated, not even connected to main Greenland ice pack, not even close.
I guess folks are just desparate to make some conclusion about climate, MWP, AGW. Next, they will be telling us that AGW is causing yellowstone lake to get really hot.
http://www.proliberty.com/observer/20031219.htm
Nearby, at 70deg 50’N, 22deg 24’W, Google Earth has a photo of an old bull musk ox (yak?) who is evidently finding something to graze on.
That the glacier had rexpanded, or that conditions had in some way become unfavorable by 1000 AD, does raise some questions. If the mwp peaked early here, did it end early as well? Perhaps gunnar is right.
Re # 34 paul m and that graph
This is Climate AUDIT. It is preferable to state the source of the data and any reservations that you know about it, like other authors commenting on it. Intuitively, I disbelieve that graph. I cannot comprehend of a mechanism that would produce such large T changes in some parts of the island and much lesser in others. Can you suggest a mechanism that is natural and likely to be correct? Do you know of another part of the world of similar size with similar diversity of T change? Do you know if these are raw or adjusted data?
Auditing does not mean the automatic acceptance of the published data of others. It is more concerned with the confirmation of it (or its rejection) by the available means.
The volume of the previous partial melting of glaciars on Greenland could possibly be estimated by looking at locations where the ground is rising after the ise age. If one assumes that the general rebound speed can be estimated as a function of time then the changes in sea level could be estimated. In places where the ground is fairly flat (western finland around Vasa) it should be possible to see the shore line moving with different speed depending on the level of the sea. The location of the sea shore is used in for example Finland to date old habitation for archeological purposes. If the melting was globally significant around AD 1000 this should be possible to see a partial stopping of the rise of land. If the melting was insignificant no such stopping should be visible.
Geoff, I thought it was clear enough from my post, but maybe not: that graph is from the paper by Jason Box I cited, Fig 3. He is a reputable scientist and it’s a reputable journal, so there is no reason to doubt it. Box describes it as a ‘3-5 degree warming at western Greenland sites’. Furthermore you can check by looking up these stations eg Jakobshavn and Upernavik at NASA GISS: that shows rises of about 4 degrees, both before and after adjustment, and it’s consistent between different sites. So as far as I’m concerned it passes the audit – what do you think? DYOR.
I agree the graph is really surprising, that’s why I posted it. And it’s relevant in the light of the ridiculous remarks about present day ‘unusual warming’ made by Ray Pierrehumbert and others. Mechanisms – well a guess would be maybe there was some warm current flowing up the west coast of Greenland? But note that there was a similar sharp rise in Iceland at the same time (Box has a paper on that too).
The paper can be found at Box’s interesting web page.
Steve, do you know what the scale in the Lowell pics is? It looks like fairly substantial branches. And is there a preprint anywhere giving more info?
Re #69 & 71
As is quite clearly discussed in the paper it’s attributed to the influence of the NAO. As I understand it the NAO is in the cooling phase now which is counteracting the more general warming, he also shows a significant difference between the east and west coast behaviors.
RE #34, 69, 71, I thought PaulM’s graphs were very interesting and adequately documented. The very rapid local warming they show between 1914 and 1940, with relatively constant temperatures since, would suggest to me that the current Greenland recedence is not due to current warming there, but rather is the gradual effect of this established warming, which has been slowly eating away at the glaciers for the last 70 or 80 years.
It would be nice to see them continued past 1990-1995. Why do they all stop then?
The photos of the recently uncovered material show well-developed woody material, assuming the plastic bag is approximately 1 gallon. In the several photos of the vicinity on Google Earth, eg the one I mention at #67 above, however, there is no vegetation there now that is more than a foot or so tall. Evidently the MWP was mild and/or extended enough to support at least good sized bushes. I wonder what the species of the woody stuff is, and if that would tell us something about the climate.
#74 From what I can remember about reading about the Norse settlement, the predominant ‘tree’ were species of Willow and Birch. See Jared Diamond’s “Collaspe”.
Apparently the birch trees were up to 6 meters tall in the areas of Norse settlement, which they then promptly removed.
>> birch trees were up to 6 meters tall in the areas of Norse settlement, which they then promptly removed.
They were probably just earning some extra money with carbon debits: http://www.carboncreditkillers.com/
If we’re now finding these trees unharmed, that means some poor hapless norskie got ripped off.
#75, the “Eastern Settlement” was in fact just west of the southern tip, some 10 degrees
farther south than this, while the “Western Settlement” was just a little ways
farther up the west coast, so the vegetation may well have been quite different.
The story I heard was that Greenland was so devoid of trees that the Greenlanders
had to sail to Labrador (“Markland”) for wood. But maybe this was after they
had stripped it of what they found.
I wonder if the woody material has enough growth rings to obtain dendro dates?
#77 Hu, I’d be fascinated to find that out too. As I understand it, the Norse both Iceland and the areas of Greenland where they settled of trees. The trees in Iceland are only now beginning to recover, and haven’t yet in Greenland. They traveled to Markland for trees for as long as the climate allowed them, but then the LIA started to kick in and that was the end of that.
the Norse STRIPPED both Iceland and Greenland. Now the sentence should make sense.
re: #77 Hu,
How could you create a dendro date sequence with any degree of accuracy? It could only be ‘teleconneced’ to someplace with a tree sequence running to the present if there were a sequence of say regional volcanic eruptions which would imprint tree growth over thousands of miles. Are there any in the time period in question?
#80. I suppose you’re right — dendrochronology must require a sequence of local treerings to compare the material to. It would be a long stretch to compare this to trees Labrador or Norway. Unless the material is really stunted, it doesn’t have many rings to compare to in any event.
There seems to be some misconception about glacier dynamics and the significance of the organic debris.
1. Glacial ice ALWAYS flows downhill, just as water, unless dammed, as water would be.
2. Finding organic material under pre-existing glacial ice would indicate that at some period in the past, dated by the organic carbon, the substrate was not ice covered but sustained a viable organic community.
3. This would imply that the area now/recently covered by ice was not covered by ice in the past dated by the organic carbon and therefore, if current glacial retreat means global warminf, prior glacial retreat means prior global warming.
4. By the way, retreat does NOT mean a glacier is flowing uphill. Retreat means the summer minimum terminus of the glacier is further upslope than previous termini. See #1 – Glaciers ALWAYS flow downhill. Any debris entrained in the ice flow will be carried downslope.
Roger
#82 Ice can flow uphill. See for example:-
Glacial Erosion: Sheet Glaciation: thick ice moves over entire landscape; greater erosion of high ground reduces relief: ice can erode while moving uphill to create irregular topography with over-deepened rock basins.
Tony Waltham, Foundations of Engineering Geology 2002
Steve,
Looks like Tom has some nice wood samples ideal for radiocarbon dating and much preferable to marine shell dates.The reservoir effect contrary to a previous writer, has to do with the residence time of CO2 in the ocean system, and varies around the world depending on circulation in the various ocean basins. However, uptake of “old” carbon is an additional problem with shell dates.
Steve,
Toms wood dates are much more reliable than marine shell dates.
The reservoir effect is highly variable worldwide depending on the residence time of CO2 in the ocean basins.
At times with limited NADW production like the Late-Glacial this effect may even be less predictable.
CO-author George Denton showed that the Younfger Dryas was a synchronous, worldwide climate event, with dating of moraines in New Zealand.
Maybe, this is just a semantic thing, but ‘disgorged’ and ‘exposed’ have very different implications.
Plant material exposed by a retreating glacier implies it is in situ, that is, it grew there.
Plant material disgorged by a glacier implies it was transported by the glacier and was deposited at its melting terminus (or transported by meltwater under the glacier). Note I didn’t say retreating glacier. Glaciers melt at their terminus irrespective of whether they are advancing or retreating, and hence disgorge material irrespective of advance or retreat.
The study says the material is in situ, so exposed is probably a better word (IMHO).
I don’t want to compete with experts, but as a mere engineer, might I suggest that ice can only flow “uphill” if a large part of the ice sheet is at a greater elevation than the portion flowing “uphill”. Since the total ice sheet can be assumed to be continuous, then the “uphill” effect is only resulting from a higher and heavier portion pushing it. So, uphill? Not really.
Phil, I was trying to keep it simple. As with water, ice will flow “uphill” with the proper hydraulic difference. My simple point is that ice was here recently, has melted, was covering organics (growing in place?) of a certain age, it was as warm or warmer in that past age.
Can it be proved that Greenland’s middle age temperatures were not isolated but part of a general NH or even global climate, surely with all the glaciers now in retreat there should be plenty of organic material being exposed which could be carbon dated. I remember reading recently about about a Canadian glacier’s retreat exposing 7000 year old tree trunks. Carbon dating of remains of plants and trees that were originally covered by ice could be the key to finding out if indeed the temperatures were global.
I saw an article about old trees in the swiss alps.
Tony #87 You are quite right, the over all movement of ice is down slope, upslope movement can occur, but it is always a local effect.
Roger #88 Agreed. Have you seen this comment with its enclosed link to the AGU abstract?
Watts Up With That?
In their abstract the authors are confident that the plant remains, located in bedrock cracks, are in situ.
Phil.
Did Lowell’s paper ever get published? It sounds like it would tie in with the recent Svalbard ice core discussion.
2 Trackbacks
[…] McIntyre: “AGU: Lowell et al on Greenland Organics“. En: climateaudit.org, 19.12.2007 Share and […]
[…] http://www.freerepublic.com/focus/f-news/886494/posts , http://www.climateaudit.org/?p=2514 […]