You have to get up pretty early to be first out of the blocks on monthly temperatures. This month, Climate Audit is first out of the blocks with June 2008 monthly temperatures.
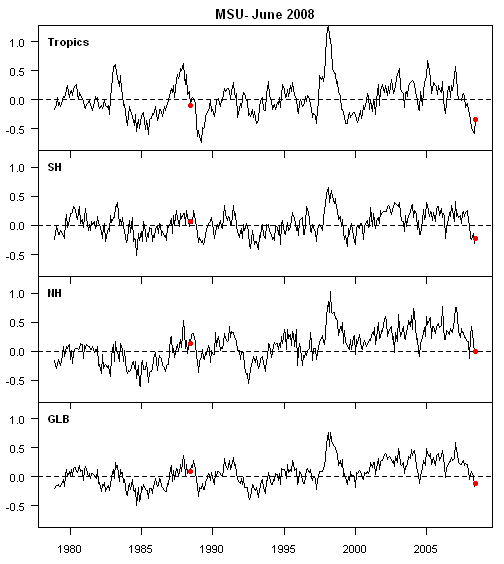
June 2008 MSU results (anomaly deg C), coming soon at http://vortex.nsstc.uah.edu/data/msu/t2lt/tltglhmam_5.2, are GLB: -0.114 (June 1988: 0.100), NH: 0.004 (June 1988: 0.140), SH: -0.232 (June 1988: 0.060), Tropics -0.334 (June 1988: -0.090). Here is a plot with the current month and Hansen’s June 1988 testimony month shown as red dots.
Update (evening July 2): RSS June 2008
June 2008 from RSS shows: 70S-80N 0.035 (June 1988 0.091); SH -0.089 (June 1988 0.012); NH 0.154 (June 1988 0.166); Tropics: -0.116 (June 1988 -0.141). So UAH shows the tropics as going down by 0.24 deg C (RSS by 0.02) and similar large discrepancies elsewhere.


117 Comments
UGA VI* died the other day so maybe this is the cause for the delay.
*UGA Mascot ( a bulldog)
Ooh, Steve’s getting fed up. Who slipped the sock puppet into Climate Audit Admin. to simulate Steve? BTW, I always thought Hansen’s pet Bulldog was Tamino.
CoRev, editor
http://globalwarmingclearinghouse.blogspot.com
It’s just a flesh wound.
CoRev, I’ve been thinking maybe a impish spirit has taken over our fearless host of late. Maybe it was all that snow in TO this past winter?
Do the SH and NH include all of each hemisphere, or only the extra-tropical areas?
Feeling snarky today, gracious host? 😉
Has anyone noticed the drastic reductions in the number of stations employed throughout 2007 in GISSTEMP analysis on the way to their conclusion that 2007 was the second-warmest year on record? And now the number of stations is no longer displayed.
Steve: Station numbers have been discussed here on many occasions.
Why is this not in the press?
Can someone tell me how given the above anyone can defend AGW, or am I really missing something obvious?
anyone trust hansen to adjust june 2008?
Steve,
showing your fangs there, mate.
If I can find my PP username and pword. I’ll be sending a donation in the next day or so.
It is not as apparent in Steve’s graphs, though it is there if you know what to look for, but there’s a divergence between the tropics and NH even in the satellite temps. It is, however, more pronounced in the land-sea series. Here’s a chart I did a few days ago in which I overlaid smoothed versions of UAH tropics and NH over the HadCRUT data.UAH NH begins to diverge during the 1990’s at about the same time as HadCRUT’s Northern Extra Tropics. The latter is probably accentuated by the station number issues, UHI effects, and station quality issues. But these wouldn’t affect the UAH’s NH trend. So what’s besides all the issues that probably bias the land-sea NH record, what’s causing the NH warming, relative to the tropics, seen even in the satellite record?
Dang! You beat me. That’s what I get for taking a bath instead of monitoring the UAH incessantly! Oh well, I usually get GISS first because so many people are prejudiced against them and ignore that data.
(One of my readers suggested we set up a betting pool to predict May’s GISS Temp when June’s came out. 🙂 )
Did you get Roy Spencer to email you the data? I cleared cache and I don’t see June.
Steve: No.
(Just for fun, I’m answering your question in litigation examination for discovery mode.)
Yes, but if you add up the numbers in the year (2008 = 10) and take away the number of letter in the month (4), divide one by the other you get the adjustment you should add; so its an extra 0.4 degrees.
re 12. thats, funny. was it predict may 2008 when june 2008 came out?
or predict may 1934
Did I miss some sort of hilarious joke? I don’t see June in the data yet?
Are the red dots cherries?
lucia,
Don’t knock yourself too much. UAH isn’t actually “out” yet. Notice that Steve said “coming soon.” He must be getting the daily data, and ginning up a monthly anomaly estimate of his own from that.
Basil
Steve: Nope.
#13
That’s funny. I’ve been there, done that. Not just in discovery, but at trial, I make the cross-examining attorney earn their money by answering “yes” or “no” and nothing else, to the extent possible, forcing them to follow up. It really flusters them if you answer “no” to a question they were sure they were going to get a “yes” from. But often there is no way you can answer “yes” without qualifying the answer, and they will try to prevent the qualified responses (“Just answer ‘yes’ or ‘no,’ dangit!”) This then forces them to follow up, giving you the chance to qualify your answer. I once had a cross-examining attorney “object” (and that’s rare, the objection coming from the attorney asking the questions) that my answers were not “forthcoming.” The judge, who was sympathetic to the other side, agreed. That may be the only time in history an expert witness was chastised by a judge for not talking enough, as opposed to talking too much.
Convenient link to Hansen’s 1988 testimony:
Click to access ClimateChangeHearing1988.pdf
Figure 3 (last page) is worth a look.
You agitatin’ my dots?
@13 with follow up 18.
Ok… I laughed.. twice! 🙂
Clearly, I need to improve my methods to scoop others in future!
Steve moscher– The bet was to predict May 08 when June 08 came out. The previous month seems to jump around the most, and so makes the most interesting bets.
Tilo Reber and I have a “brownie bet” on whether the 6 month Giss trend from now to Dec. is higher or lower than the 6 month trend based on other sets.
re 21. I like his error estimates of .1 degree from data that was basically measured to the nearest degree even leaving out any biases. We are starting with a minimum of .5 degree errors + bias + uncertainty. Bias I estimate from the Station Survey to be close to a degree and i will assume the uncertainty to be what he showed for a .95 error estimate of 1.6 degrees.
–
Okay, so who was it that threw a badger at the witness?
oops re 20
Thanks for posting that link, Sean. A few days ago I was looking for a graph which showed just that, a prediction done in 1988 forecasting for 2008 the expected increase in temperatures. Temperatures ranging from +0.5 to +1.5 degrees Celsius in three proposed scenarios. All completely wrong and thereby the notion of AGW. I suspect that in the past 10 years, Hansen has been working with the records solely to maintain the validity of his predicted trend, and his professional reputation. I wonder if he is aware of the extent of the damage he has done with the public regarding credibility of the GISS.
Steve, did you get it from RSS data, which IS out here
…and then calculate the offset to arrive at UAH? They both use the same source data, but different methods of processing it.
Steve: Nope.
You beat me on RSS !
I’ve posted up info from RSS. Are they 4 days earlier this month than last month?
#12. GISS May temperatures are out now. When did April’s come out?
Odd, RSS is usually second, UAH first, GISS third and HadCRUT last
Typically UAH is out by the 4th, RSS by the 7th, GISS by the 10-15th, HadCrut usually by the 15h, though last month it was the 18th.
I cry uncle on how you got UAH. I scoured their website looking for misplaced data files and the like, and saw nothing.
So I must conclude the data appeared in front of you via “teleconnection”.
Steve: C’mon, gumshoe. Read the transcript of the cross-examination. You’re thinking too hard. The answer should be obvious.
RE28 Steve, Last month RSS came out on the 6th so yes, 4 days earlier this month
Someone not Spencer emailed you the data?
OK it must be (or had been and taken down) on his new “coming soon” website
http://gavinschmidt.com/
I guess he just could not get enough talk time on RC.
Spencer on his blog posted update for UAH temperatures for June 2008, but without details Steve provided here for Tropcis, NH, SH and so on.
Steve, there’s a kind of a graph that you or anyone else could make that would present the changes in a dramatically better visual manner. I’ve seen it in the blog of Mr. William Briggs, the statistician, where he plotted the CO2 increase in such a fashion, here
The trick is to plot the points of monthly avg temperatures and only connect the same months in a sequence of years. There will be 12 lines, each one for a single month and it will run for the decades of data available. January 1999 connects with jan 2000 and jan 2001, etc, while feb 1999 connects with feb 2000, etc. You get the idea.
In this graph, seasonal changes are diminished greatly. One can be left with a much better grasp of the changes whe are going through the last years and specially this year.
Anyway, it seems a refreshing kind of graph and I wonder if any mathmatician in here is interested.
You’ve launched your own satellite? Must visit the tip jar, that’s going to cost you quite a lot more than the bristlecone safari, unless big oil’s helping out of course:)
Wisconsin?
=======
Steve is in very fine spirits, having fun with us over this mystery of how he scooped everybody. I think someone should file a FOI request on Climate Audit and audit his emails and sniff around his hard drives.
Oh, wait a minute. That only works to try to get the truth out of public, or quasi public, official bodies. And it doesn’t work all that well. Steve is just an ordinary citizen.
There’s what looks to be a mid latitude sunspot group on the far side of the Sun right now. Just in time to save the ice melt forecasts, if not the entire global warming franchise.
#29 Steve
I think Lucia is referring to the new May value when June comes out. The modifications to history begin immediately. Remember the ruckus over the high GISS March anomaly? March has come down every month since.
Data from UAH is now official:
http://vortex.nsstc.uah.edu/public/msu/t2lt/tltglhmam_5.2
John Goetz
Yes. That’s what people were joking about betting on. Whether the previous month’s data rises or falls seems like a crap-shoot, so that makes for good meaningless bets.
#13. Lucia asked:
I answered:
I’m surprised that no one asked about Spencer’s co-author, which would have received a different answer. 🙂 I told you that I was answering in litigation mode just for fun. #32 was on the track, but arrived after I went to bed.
I self-snipped a couple of snarky sentences in the post.
Could someone please identify the column headings in the various tables of temp anamolies?
Also, the values definitions (e.g. measured temp minus ave temp over period A to B)
Thanks
Dr. Spencer’s website reports that the June 2008 MSU data are still below normal…
http://www.weatherquestions.com/Roy-Spencer-on-global-warming.htm#satellite-temps
snip
UAH
1. year
2. month
3. Globe, self explanatory. RSS lists this as -70 to 82.5 referring to latitude
4. Land, Land area only, global
5. Ocean, sea area only, global
6. NH, northern hemisphere only. RSS lists this as 0 to 82.5
7. Land, NH land only
8. Ocean, NH sea area only
9. SH, southern hemisphere only, RSS 0 to -70
10, 11 same as above
12. Trpcs, tropics. RSS -20 to 20
13, 14 as above
15. NoExt, northern extra-tropics. RSS 20 to 82.5
16, 17 as above
18. SoExt, southern extra-tropics. RSS -20 to -70
19, 20 as above
21. NoPol, Arctic. RSS 60 to 82.5
22, 23 as above
24. SoPol, Antarctic. RSS -60 to -70
25, 26 as above
27. USA48, contiguous 48 states. RSS Cont. USA
Since UAH provides northern extra-tropics data, I’m surprised Basil didn’t include it in his plot. Maybe HADCru defines extra-tropics differently.
42 (Steve): I should have guessed, as I know you and John have had e-mail correspondence before. And here I thought you were making stuff up.
RE: #35
This is not a new idea. Andrew Masterman did this several years ago for the CET records. GO:
http://www.usefulinfo.co.uk/climate_change_global_warming.php
Check out the table of numerical data with the t-tests. Note that for several months the annual mean temp has remained more or less constant for 300 years. Not much change in regional climate in central England for three centuries. How could the fellows at CRU not know of this study?
His analyses would have be even better if he had analyzed the Tmax and Tmin metrics seperately. All temperature records should be analyzed by his method. According to Roger Sr, Tmax metric is the best one to use.
Harold #48
I have plotted all the CET figures myself and tabulated them by hand and Mr Masterman is not always accurate with his monthly charts and comments. In particular his winter ones seem off, and I wonder if he has plotted the calendar year-jan feb dec, rather than the consecutive months dec/jan/feb
Very many of the records for warmth still remain from before the modern era-not surprising as regards cold, but more surprising for warmth, as this is all supposed to be in the (intermittent)Little ice age. The similarity with the 1730’s in particular is very marked. The overall analysis is fair enough though, in as much the average mean temperatures are broadly similar over the centuries, but that is because of a shifting of the characteristics of months. For instance we don’t tend to have the cold winters any more and October is generally warmer than ‘normal’ but counterbalanced by other months changing their traditional form. This was observed way back in the Anglo Saxon Chronicles whereby the winters had ‘less bite’ and summers became ‘hot and dry’ (the latter condition a situation we in the UK can only dream of!)
Tony B
Steve (re: #7),
Since I’m new to the vast domains of CA, would you please point me to the most thorough discussion of the constantly varying number of stations used in GISTEMP analysis. I’m in the process of compiling a spectral climatology of the 20th century from a FIXED set of vetted non-urban stations and am frustrated by the failure of GHCN and/or GISS to update many perfectly good, long records (e.g., Sitka, Sydney NS, Sochi(Russia), to pick just one letter of the alphabet) to the present. The first purge appears to have taken place ca. 1990, when most of the non-urban Chinese stations were dropped. This was followed by a massive purge of small-town US stations in 2005. And in mid-2007, an equally massive purge of updated stations was made globally. It seems GISS is intent on using only urban records with very questionable homogeneity adjustments in seeking “ground truth” about surface temperatures.
Any suggestions for finding complete non-urban records would be helpful.
Steve,
For someone who is well versed in statistics, it makes me wonder why you are so fixated on two data points. Given the noise in the data, it is really a statistically meaningless exercise. Your dislike for Hansen seems to be getting in the way of your grasp of trend analysis.
To be perfectly correct, most small-town US stations were purged AFTER 2005.
#51. Look through the Surface Record category (left frame). A couple of things are going on. In the US, there are two different USHCN versions, with NOAA being more up to date than CDIAC. GISS used a stale source, though they seem to be responding to our suggestions, thereby improving their timeliness (no thanks to us, of course.) The USHCN stations get incorporated with a lag – the 2006-2007 values get picked up. I think that 2006 is picked up now.
GISS uses GHCN data for the ROW. GHCN collected a lot of data under special programs in 1990–1992 and this accounts for the high station populations prior to then. MAny people have thought that the stations have been shut down duie to funding; this is untrue. Many stations that appear in GHCN (And thus GISS) to have been shut down in 1990 or so can be located online. We’ve made fun of this on many occasions (Wellington NZ, Cobija Bolivia, many Canadian stations.
There’s a lot of information that’s been time consuming to collect. If you’rte interested, spend the time to wade through the Category.
#52. Puh-leeze. I’m hardly “fixated” on two points. Hansen’t 20 year anniversary occurred a couple of weeks ago and was widely covered. It’s hardly unreasonable to do a comparison if the two points in a topical post. Also rather than quoting a single trend statistic, I plotted the data so that people can see and judge the data for themselves.
Here in Australia Prof Ross Garnaut has today released his Climate Change Review Draft Report. In chapter 5 he uses a graph (Fig 5.1) Average global average air temperature anomalies, 1850 to 2005 – Source: Brohan et al. (2006, updated 2008).
Would someone be kind enough to direct me to any CA discussion or criticism of this graph or its methodology. (Sincere apologies if there is a more appropriate thread for this enquiry.)
You know just may be possible the temperature rise has paused because he ice is melting.
Latest news, charles: Earth’s sea ice area is now bigger than in the previous years. Earth’s global temperature is, however, going down.
Re TonyA # 56 Australian Garnaut near-final report released today
As well as the origins of the Brohan graph you seek, I have problems with this explanation also from Ch 5:
It would be my understanding that satellite data conflict seriously. If I can get the Breusch & Vahid 2008 paper, would others on CA like to comment on it? The words in the box seem old-fashioned and shallow. It seems fast work that GISS records accessed on 17 May 2008 could be modelled, ruminated then printed in a report issued about 4 July 2008.
The whole 600 page report (with about n x 1000 mentions IPCC as authority) is dismissive of developing knowledge and determined to toe the AGW line.
Click to access garnautreport.pdf
Beware, this can happen to your country.
Nylo
Look at the figures over several years and stop kidding yourself, you know denialism can only go on for so long, after a while it’s going to become so obvious the only ones that will be able to keep it up are those that believe the natural world only exist in out imagination so why worry.
Breaking news.
re: #61 Charles,
Why are you posting about sea ice in a thread on global temperatures instead of the ones on sea ice? And why do you fail to read the few actual facts in the article? Such as that there is somewhat more ice this year than at the corresponding time last year? And why do you get your truth from a tabloid in the first place? Inquiring minds want to know.
Dave
Nasa good enough http://earthobservatory.nasa.gov/Newsroom/NasaNews/2007/2007092525664.html.
Melting ice and temperature happen to be related. When the heat is going into melting the ice, the heat isn’t going into raising the temperature. Have a look at the triple point of water if your interested in the concept.
Sea ice doesn’t cause water levels to rise or fall, its the melting land ice that matters. If you wish to argue a high school experiment for your enjoyment.
http://www.teachersdomain.org/resources/ipy07/sci/ess/watcyc/icesimulate/index.html
With regard to the sea ice. Record low artic see ice in 2007.
http://www.nasa.gov/vision/earth/lookingatearth/quikscat-20071001.html
What are you on about?
Charles,
And why do you think it’s fun to insult people? BTW, I’ve got an ACS BS in chemistry (and an MS in biochemisty).
And yes there was a record low sea ice in 2007 (for times since 1979 at least). But the point is your link was talking about totally disappearing ice in 2008 when in fact it’s highly unlikely to be below the 2007 record. If you’re going to link something as your talking point, you’ve got to be willing to support it or else admit it’s hyped nonsense.
Australians are probably the most gung-ho on GW. They are usually wrong but it takes years for admission this will take alot of time and they will spend billions on try to prevent something thats not happening
#59 Geoff
Here is a link to the Breusch Vahid 2008 ‘Global Temperature Trends’ paper.
Click to access Global%20temperature%20trends%20-%20Breusch%20and%20Vahid%20(ANU)%202008.pdf
RE 52 steamtracker. are you bothered in the least by the way hansens first testimoney was staged? bothered in the least?
re: #65 Tony A,
Thanks for the link. Ok, seeing the thing in context, I have a big question. Does the statistical analysis they report in Chapter 5 box 1 say what it would seem to say on the surface? I.e. that there has been a temperature trend in the past century+ and that there is still a trend over this time period even given the recent stasis or decline? If so, it’s about the most worthless piece of… well, how do we say this more or less politely. Ahem. Doesn’t this result miss the point that skeptics are attempting to make? I know of no skeptics here who claim that there has not been a temperature rise over the past century plus. But just how much of the rise is of human cause and in particular as a result of the release of CO2?
And moving onward, is the present 10 years of stasis or decline enough to indicate a break with the amount of global warming which can be attributed to human CO2 release? It’s not whether the century-long warming trend which, assuming AGW does indeed exist must consist of both natural warming (from recovery from the LIA)and AGW, but whether the AGW attributed portion of the warming might be showing a break.
To elaborate, if there has been natural warming, it’s to be expected that at some point it will end. AGW, OTOH, would be expected to continue and perhaps increase. So just what is the purpose of asking the particular questions they asked these stats guys to answer? I can only assume it was to create a red herring.
Steve Mc I hate it when you snip. It reminds me of when I was a child and mum used to say soemthing like ” I bought you a …. no I’ll tell you later, maybe” Get what I mean?. 🙂
Steve: If people complied with blog rules not to vent, not to be angry and not to talk about policy or impacts, then I’d snip less. It’s an unfortunate tradeoff. I took pride for a long time in never snipping, but it led to too many food fights.
RE: 66 “testimoney” good Freudian slypo there Mosh.
Methinks it’s time for a Global Warming – Mid Year Assessment Report Special Edition.
Now can I have a prize for acronym of the year???
Dave
And why do you think it’s fun to insult people? BTW, I’ve got an ACS BS in chemistry (and an MS in biochemisty).
Didn’t take statistics? There is a difference between a trend and a data point. If you understand the concept of state change, why are you telling me that temperature has nothing to do with ice, when in fact they are very heavily related by one small problem, trapped heat. If there is no state change going on, temperature rises, if there is the heat goes into the state change.
It’s a complex system, with waves in the graph due to variation in the sun, however given that this year followed a year of record melt and increasingly rapid reduction in the height and extend of the Greenland ice, I think it reasonable to say, oh dear a lot of heat is going into melting a lot of ice, not, the science is wrong, the trend line has reversed.
I used to assume that that the scare stories about CO2 were correct, but the more I’ve looked into the issue, the more I’ve become convinced that (a) the existing temperature rises have been overstated and (b) the levels of certainty of the models predicting future rises have also been overstated.
However, I’ve suddenly become very worried about the satellite measurements, and I’m hoping someone can clear up a few questions I’ve been wondering about since I started looking at the AMSU temperatures today
http://discover.itsc.uah.edu/amsutemps/
As I understand it, the significance of these is that they are used to derive the UAH and RSS figures, and use the NOAA satellite.
1. (This is probably just a technical aside). If you look at the average temperature at 3,300 ft (http://discover.itsc.uah.edu/amsutemps/execute.csh?amsutemps+001) why is it round about 25-32F? If global average temperature is close to 60F, I wouldn’t expect temperature at 3,300 ft to be much under 50F.
2. More importantly, the traces are 1-2F above the 20-year average for both 2007 and 2008 so far (albeit 2008 is significantly lower than 2007), and if you add in the traces for 1998 and 1999 (as a possible comparison re: El Nino followed by El Nina?) then it appears that they were much closer to the 20-year average than to the present.
3. So why are UAH and RSS showing such low anomalies for the last few months if the AMSU anomaly close to the surface is so high? It must be because there are some low anomalies in the AMSU higher up, and this is true. At 14,000 feet, 2008 so far is normal, whereas 2007 and 1998 were equally high, and at 25,000 feet 2008 has the lowest anomaly of the last decade by some margin with 1998 the highest and 2007 a bit below 1998.
4. But isn’t it the temperature closest to the surface that we’re most interested in, as this is what actually affects the ice, crops, storms, forests or whatever else the AGW theorists like to emphasise? (Incidentally I assume the temperatures are weighted according to the pressure of the air at different heights?)
5. Are there agreed definitions of the height boundaries of lower and upper troposphere? I’ve read a lot about these but there never seems to be any precision….
6. Is there a mechanism by which lower anomalies at higher altitudes can result in lower anomalies at lower altitudes (with a lag)? I’m really hoping there is, as otherwise could it be that once the next El Nino and solar cycle kick in, the low anomalies that are currently giving us hope might never have actually reached the surface?
I’m really hoping I’ve got all this wrong, as it’s the first time in ages I’ve started to think AGW might be worse than I thought.
I forgot to mention the oceans. I guess La Nina could help explain the low 2008 overall anomalies? Again, it would be interesting to know the relative weightings i.e. ocean/surface?/lower troposphere/upper troposphere.
Also I wonder if the warmer ocean temperatures in the mid 2000s (El Ninos?) compared with the mid 1990s (Pinatubo effect?) could help explain the relative warmth at 3,300ft of recent years over 1998?
Ok I’m going to stop now – it’s 1.23am in the UK and I can’t get my head round this any longer…. Hope someone has the answers I’m looking for 🙂 Thanks!
Re Australian Garnaut report just released
I searched the 60 pages for “satellite”, found three references the word, all non-relevant temperature. I am considering starting legal action because of failure to comply with the Terms of Reference of this Inquiry.
As a reward to my hard-working friends on Climate Audit,I give you the accolades given by Garnaut.
(Ths Box 5.1 is quoted in my # 59 above).
It’s almost as if satellite temperature data do not exist.
Geoff, There is a link to the paper and more critique to come at my blog here.
http://landshape.org/enm/garnaut-report-due/
Even though they raised a straw man, that ‘dissenters’ are arguing that there is no
trend in temperatures, even this claim has minimal support from their paper,
and only then through some questionable tests.
Two issues I see are these:
1. They used a one-sided test to show a significant trend term in the unit root model. A two-sided test with at conventional 1.96 critical value would have made two of the series non-significant. A Two sided tests should be used unless there is a very good reason for doing otherwise, as it could be argued that a one-sided tests was used simply as a device to make a conventionally non-significant difference significant.
2. They used a slide-and-eyeball test (see lucia’s blog about those) for showing that “the temperatures recorded in most of the last decade lie above the confidence band of forecasts produced by a model that does not allow for a warming trend.” But in a footnote they admit “The confidence bands in these graphs are calculated using the dynamic forecastoption in Eviews and they do not incorporate estimation uncertainty.”. A slight increase in uncertainty concerning the parameters and the start point would put all temperatures inside the confidence band.
3. Not using MSU RSS data is a big omission.
DAvid, I’ve been doing some experiments on trend significance using profile likelihood with some very interesting results.
Chris,
The numbers on the web site are the raw brightness temperatures from each channel on the satellite. There is considerable overlap of the bandwidth of each channel so the pressure reading given is for the center of band. To get an actual value at a given altitude you have to correct for this overlap. RSS and UAH use somewhat different algorithms for this, and for cross-calibration between satellites when a new satellite comes on line to replace an old one. The basic problem of calculating an atmospheric temperature profile from a limited number of channels with noise and overlap is actually ill-posed. There are an infinite number of solutions. So you have to make some assumptions or use additional data to constrain the range of solutions. This falls into the general class of inverse problems, which are frequently ill-posed, at least at some point.
Tease. Well if Garnaut is making a tacit admission that significant temperature trend is grounds for action,
and then lack of significant trend is grounds for no action, it would be interesting to see more
perspectives on this topic.
Re #71
You’re all over the place here. Now, while I did take 23 semester hrs. of math in college, I do admit I didn’t take a statistics class among them, though I did take a graduate school course in biochemistry which was largely concerned with data analysis including calculating the statistical functions thereof.
I said no such thing. I asked why you were posting on ice melting on a thread concerned with global satellite temperatures?
Now, you’ve been trying to make some issue about temperatures pausing because ice is melting, but you’ve not presented anything concerning the math of the situation.
The molar heat of fusion for water is 6.02 kJ/mol. 1 calorie = 4.184 Joule So to convert 18g of H2O (l) to 18g H2O (s) requires 6020 / 4.184 = 1439 calories. Since we typically use watts per sq m for insolation, (and also outgoing IR) it’s useful to convert this to square meters. A cubic meter of water is about 1000 Kg or 1000/.018 moles H2O. so we have 1.439*1.000/18 x 10e9 = 8.0 x 10e8 calories to freeze one cubic meter of ice. Now a watt hour is about 860 calories so we need a bit less than a million watt hours to freeze this water. Now each year has 365.25*24 = 8766 hours so it takes about 115 watts per square meter to melt a meter of ice per year. Whether there is that much inside the arctic circle I don’t know.
OTOH, the amount of IR escaping from the arctic ocean is even more difficult to calculate. When there’s ice present it can be melted from below, but when there’s no ice the heat can escape to space. Thinner ice can transmit heat from the ocean below but thicker ice is more of a blanket and in the winter the surface temperature can get very, very low so that not much heat escapes to space. Thus thinner ice can perhaps let the earth’s air conditioning system work more efficiently. The question is what the balance is between additional late summer absorption of sunlight into areas where ice has melted vs the increased time of reasonably warm surfaces to radiate to space at temperatures near 0 deg C in early winter.
But of course there are many, many other things to be taken into consideration such as albedo, water temperature, thermohaline circulation, cloudiness, humidity, wind speed, air temperature, etc. Your concentration on “heat of fusion” is just a blue herring.
BTW, could someone check my math above? I hate making mistakes, but I hate worse letting them slip by and later looking silly if I push an idea and later find out I’m off an order of magnitude.
Thanks for the reply DeWitt. I hope to get the chance to investigate the overlap issues you mention in more depth.
But leaving aside the more technical measurement issues, the fact remains that the average global temperature anomaly for the satellite that is the basis of this thread, at the most important altitude i.e. closest to the surface, is still way above average, and has been consistently at extremely high levels for several years (even compared with 1998)
discover.itsc.uah.edu/amsutemps/execute.csh?amsutemps+001
Surely this is worrying? I want to believe we’re on a 10-year downward trend as much as most people on this thread, but this issue is really bugging me and I can’t think of a way to explain it (short of AGW….) ?
David Stockwell # 75, 76, 79
I suspect this is the wrong thread for this discusion but it is partly relevant and the best place I could find. Thank you for your comments, which I have read. Action time before finalisaion of this report is short, a few weeks, so I sent thefollowing email just now. Steve, I hope you did not mind me borrowing your links. Email follows to authors of paper quoted in Box 5.1:
Hi Trevor,
I refer to paper dated July 2008 with Farshid Vahid “Global Temperature Trends”. (As I write it is 5 July 1988, so I hope you are not forecasting. Ross’s report seems to reference this paper, but it was presumably published before 4th July 2008. How did such rapid events happen, with peer review etc? This is not important, I am just fascinated to know.)
Might I please ask:
1. Are you aware that satellite instruments have been measuring global temperatures since the late 1970s?
2. Were you and Farshid tempted to include these measurements in your paper?
3. If not, were you asked not to? If so, by whom?
4. The following URL leads you to a satellite dataset ending 30 June 2008, from University of Alabama at Huntsville, one of the two prime official sources of satellite temperatute data over this time span.
http://vortex.nsstc.uah.edu/data/msu/t2lt/tltglhmam_5.2
5. Would you be able to do an analysis similar to that relied upon by Ross for surface thermometry per Box 5.1 and make the results available? The satellite data has also had some adjustments, but some climate scientists regard it as more pure than the data that you used.
6.Were you/are you aware that there is extreme uncertainty about the validity of the data you used, especially the HADCRU data, where one external author (Douglas Keenan) has a peer-reviewed published paper demonstrating a high probability of fabrication of data?
7. Were/are you aware that the HADCRU, GISS and NOAA data are all subject to prior numerical and statistical adjustments, some plausibly subjective; and that there should be caution used when performing statistical tests upon data that have already undergone several layers of statistical adjustment?
8. Might you please forward the computational code you used in your 2008 joint paper so that colleagues of mine can use it and comment upon it?
9. I have appended graphs of the two main satellite data sets. (The word “satellite” is found in only 3 or so places in Ross’s report, none of them relevant to this topic). You might find a preliminary look to be challenging.
MSU data is Uni Alabama

RSS data

10. The shortness of the timetable set by politicians has caused convenient rather than formal attribution and data sources. It is my preference to properly attribute to the source.
Many thanks
Geoff Sherrington
Scientist.
Continued to Chris , as there was a glitch after the link ( it is the AMSU hiding there)
1) Note that the average is a twenty year average. Nobody is disputing that we are coming out of the little ice age and temperatures are going up, except for the hiatus of the last decade or so.
2) That the daily data available to us is to 3300 feet. Note the scale of temperature. Pretty cold up in the mountains on global average.Not close to 15 C is it? It means one has to integrate down to the surface to get the plots of global temperature. We are not given those tools. All last decade temperatures available to us are equal within an error of 0.5 F.
3) It is legitimate to ask how the surface temperatures are arrived at.
Hi Anna, thanks for your reply. I think there may be a first part missing, but anyway, just to respond to your points:
1) I’m talking about figures consistently 1-2F above the 20-year average which is too short term to be explained by a retreat from the little ice age; besides, a lot of us are disputing whether temperatures are going up longer term, that’s why I’m on this thread in the first place;
2) Are you familiar with the actual figures for adiabatic lapse rates? (http://en.wikipedia.org/wiki/Lapse_rate)
The reason I said I didn’t expect temperatures at 3,300ft to be much below 50F compared to global surface average of 60F is because the lapse rate is typically about 3.5F per 1000 ft (i.e. the rate at which it cools as you go up from the surface)
3) I certainly do ask how the surface temperatures are arrived at, and that’s why I’ve started to follow satellite temperatures to try and get a truer picture. But now I’ve discovered that the satellite temperatures closer to the surface show positive anomalies that are much greater than even the most controversial surface figures, I’m starting to wonder.
How cold can it get? My hunch….
Here’s a possible theory about the high positive temperature anomalies of the near-surface satellite data.
What if the satellite is overstating the temperature because of the short term effects of greater humidity/cloud formation, caused by hotter temperatures in the mid-2000s? What if the radiation from the sun has been gradually diminishing in the last couple of years (c.f. lack of sunspots, low temperatures in mid to upper troposphere and stratosphere?) and the high satellite anomalies close to the surface have been masking this, such that once the humidity/cloud effects wear off, temperatures will be even colder than we thought? What if we’ve still to see the full effects of the latest El Nina, which reached a peak in Feb I believe (the 6-9 month lag I’ve seen quoted would take us up to Nov)?
Worst of all, what if El Nina returns and intensifies (c.f. 30-day moving SOI map at http://www.bom.gov.au/climate/enso/)?
-0.5C anomaly within a year anyone????
Or are the higher temperatures close to the surface, combined with lower temperatures higher up, explained quite simply by the greenhouse effect, and surface temperatures are on a substantial long term upward trend after all?
I wish I knew the reason for those 900mb anomalies!!
Chris,
I see your point. Now that you mention it, I’m not sure what those graphs are plotting year-to-year. The Watts Up site has a link to the tabular data here.
I apologize for the formatting, since I don’t know how to make tables in Comments, but here’s “lower troposphere” data for 1998, 2007, and 2008. I can’t match these up with any of the low altitude graphs.
Mo 1998 2007 2008
Jan 0.582 0.594 -0.046
Feb 0.753 0.450 0.020
Mar 0.528 0.403 0.089
Apr 0.770 0.244 0.015
May 0.645 0.199 -0.183
Jun 0.562 0.203 -0.114
Jul 0.510 0.255
Aug 0.513 0.286
Sep 0.432 0.201
Oct 0.394 0.231
Nov 0.190 0.209
Dec 0.289 0.114
It would be interesting to see a detailed explanation on how the the listed temperatures are derived, at least relative to the data graphs you’re referencing.
Don’t want to get too distracted by my original point (1), it was really an aside.
But it occurs to me that it could be explained if the readings are only taken over land, and the 3,300 ft refers to 3,300 ft above the average elevation of the continents (840m I believe) rather than above sea level. This would bring us to about 6,000 ft above sea level which would make a global temperature in the high 20s F slightly more plausible, though still unlikely I think. But the question would remain, why are the anomalies still so high at 6,000 ft……
John,
Great that someone’s finally seen my point. The discrepancy seems to be to do with how “lower troposphere” is defined. I believe this is defined as up to 10,000 metres (about 33,000 feet) but I don’t know if this is universal.
With AMSU if you look at the figures for 14,000 feet you will see that 2008 is already down to average (from a positive anomaly in 2007), and at 25,000 feet it appears it is well below (unfortunately the 20-year average is not available but you can still compare 2008 to the previous 10 years individually)
So it’s easy to see how the “lower troposphere” as a whole can have a negative anomaly (assuming the same weighting for all levels of the lower troposphere – though seeing as there is less than half as much air at 25,000 feet I wonder if these levels do or should have a lower weighting?)
What I’m struggling to see is why there appears to be so little information and discussion out there on the variations within the lower troposphere itself.
If the data was split into lower troposphere 1 (up to 5,000m) and lower troposphere 2 (5,000-10,000m) and UAH/RSS used lower troposphere 1 rather than “lower troposphere”, perhaps all the discussions taking place at the moment about the satellite data (especially vs the surface data) might be quite different?
Chris,
I think we’re both out of our league here. I hope someone else can weigh in relative to the temperature graphs for 1998/2007/2008, but with regard to your other point about the absolute temperatures being shown, DeWitt Payne makes a key point, when he refers to “raw brightness temperature.”
I’ve spent a few minutes googling, and the temperature listed on those graphs need to be converted using emissivity and humidity corrections. I have no idea how that is done, but the fact that the 900 mbar plot has a temperature range well below “average global temperature” has to do with the fact that those are “brightness temperatures”.
The purpose of those graphs is to provide a quick year-by-year comparison, not an absolute global temperature. I remain confused, however, with the 1998/2007/2008 plots.
John,
I know what you mean, it’s difficult to understand, but we do the best we can and it’s easy to assume others know more than they actually do 🙂
I just did some more googling myself and came across the following:
http://www.remss.com/msu/msu_data_description.html
It’s really useful, as it explains what DeWitt was saying, and more.
For one thing, it gives the weighting functions for the main channels, and a quick look at TLT (lower troposphere) channel which we’re concerned with here shows the kind of weighting I’d thought would be reasonable i.e. tapering substantially the higher you go. It appears the channel goes higher than 10km (up to about 12km or so, but the weighting at this level is minimal)
It’s also interesting to see the high anomalies in the Northern Hemisphere as you approach the Arctic.
Taking the channels as a whole, it’s clear that the positive anomalies become greater the closer you go to the surface (check out “Decadal Trends” section)
But I don’t want to distract from the original point re: the near surface graph, which you admit confuses you, and I admit makes me worried that AGW might be worse than I thought:
http://discover.itsc.uah.edu/amsutemps/execute.csh?amsutemps+001 (and click “1998” and “redraw graph” to see disturbing evidence that 2007 was much warmer than 1998 in the lower part of the lower troposphere, i.e. the first few thousand feet above the surface)
How can this be explained without AGW?
Chris,
As noted by de Witt #78, The temperatures shown are Brightness temperatures sensed by the appropriate AMSU channel which is not the same as actual temperatures. The brightness temperatures for example assumes a surface emmisivity of 1.0 and does not allow for any other effects such as precipitation. The channel measures radiances over an interval which includes the surface and also higher altitudes according to a “weighting function”. So the absolute value, as opposed to the anomaly measurement, is not expected to be the actual temperature at 1km.
As you rightly point out the average lapse rate of the atmosphere (not the adiabatic lapse rate, which is something different) is around 5C/Km and therefore one would expect actual temperatures at 1 Km to be higher. A lot of processing needs to be done to convert the AMSU temperatures to derived temperatures.
I do agree the anomaly for the last 10 years compared to the 20 year average is puzzling. In fact if you plot all of the last 10 years they are all higher. In addition the 20 year record high line is lower than some of the years. That makes me wonder though, is the 20 year average line right? Is it the average for the last 20 years, which seems hardly possible given the values for the last 10 years? Do I understand the graphs right?
Chris,
Something doesn’t seem right with the graphs. The 2007 line is much higher than the 20 year record high line.
Len,
As you suggest, it is difficult to understand the full significance of the AMSU Brightness temperatures without first understanding how they are processed to derive actual temperatures.
Also there are various features, such as the 20-year averages, which seem to require further detail and explanation (or may even be plain wrong, like you suggest!)
So what I hope to do at some point is, firstly, to try and research the answers to some of these questions, and, secondly, to find out if there are any other relevant near-surface records for comparison. This may take me some time!
But I hope that I have contributed to the debate by introducing the idea of variations within the lower troposphere, and that people will consider this more when contrasting surface temperatures with “the lower troposphere” as an assumed homogeneous mass.
Also, assuming the AMSU near-surface figures turn out to be “right” – just as we assume the UAH figures on which they are based to be “right”, I continue to assert there is a huge unanswered question out there for those of us who think (or hope) we are on a downward global temperature trend at the level that surely matters most i.e. the surface.
Probably my last post in a while as i’m going away, but thanks for the good debate, and long may it continue.
Sorry, minor error I meant to say “the UAH figures which are based on them” rather than “the UAH figures on which they are based”.
So long….for now…
Re #80 Dave
I think you may be a bit out with your sums. 🙂
If you go straight to about 330 Joules per gram as the latent heat of fusion for water it makes life easier. This gives 330x10e6 Joules per cubic meter. Going back to calories we can divide by 4.2 to get about 78x10e6 or .78x10e8. So yes, I think you are out by a factor of ten. 🙂
Chris,
I had been block quoting part of your post when the glitch happened.
I have no problem seeing the 20 year average below the fairly constant last 8 years. The average of the rising numbers until 1998, if it is .2C per year will be .5C bellow the average of the constant since 1999, assuming that 1999 stays at the level of 1998. Averaging the two averages will still keep the twenty year average lower than the current constant state.
I have no opinion on the absolute values. It would be good if the site had provided us with a FAQ.
Sorry for the .2C, just use it as illustration. Worst case scenaria of IPCC are .03C per year 😦 . should go to bed.
Dave,
You dropped a decimal point when you divided 1.439x10e9 by 18. It’s 8x10e7 not 8x10e8. So it only takes an excess of about 12 W/m2 to melt a meter of ice. Cloud cover is incredibly important to cooling. In the cold dry air of the polar regions, it’s possible to radiate heat to space at over 100 W/m2. Cloud cover reduces that radiation loss by about an order of magnitude.
Re #95
Thanks Jorge, that makes more sense. So it would take about 12 watts per square meter to melt a meter of ice in a year. Of course a lot of the incoming radiation is reflected by ice, and even some off the water as the sun is at a low angle.
I see my mistake I was dividing 1.439 by 18 in my head and figured it was about .8 rather than .08. However it doesn’t really affect the point that one has to consider a lot of factors in deciding how much ice will be melted in a typical arctic summer. Or how much forms in a typical arctic winter.
Charles,
You seam to want to substitute ice measurements for temperatures because the former is a proxy for the latter. This is nonsensical because we can get more accurate measurements of temperatures by measuring temperature itself. It is the same as measuring global warming by its proxies instead of actually measuring the warming. It is an unnecessary step that increases the error rate and adds no new information about the actual phenomenon in question.
TheDude says:
To be fair, proxies are necessary for times when there were no temperature measurements. Measuring through them now allows for calibrations and checking assumption for the values reported for the past.
TheDude (#101) writes:
This is wrong. First, all temperature measurements are made by means of proxy. Whether that proxy is the expansion of mercury in a glass tube or something else. Some proxies are better than others. Records have their own problems. So your point must be about combining proxies. If I have two sources of measurement, one noisier than the other, how should they be combined to get the most “information”? Pick the least noisy only? no, you combine them through an inverse covariance filter.
Just came across this interesting quote in section 3.5.2 of the Garnaut report – ‘Techniques for quantifying uncertainty’:
Would anyone here be good enough to advise how commonly this particular (presumably Hansenian?) analytic technique i.e. expert judgement is employed in evaluating uncertainty in climate- and other sciences?
An anomalously cool region of subsurface water (black circle) persists in the tropical North Pacific. It has strengthened in recent days.
The image is a south-north slice of the Pacific subsurface at 140W. The temperature anomaly is indicated by color.
An 8 degree C anomaly 60 meters beneath the surface is impressive.
The ocean/air pumping mechanism for making the water rise at this latitude is unknown to me and I’ll be surprised if it affects the 28C surface waters. Still, it’s interesting to watch and wonder what-if, as coolness here likely affects trade wind strength and thus may play some role in ENSO.
Re: #104
That approach is primarily what is used by the authors of the AR4 reports. It has become rather obvious to me that without expert judgment there would be no way of stating uncertainty in many instances of climate claims. If they did not depend heavily on expert judgment, I think we would all have told about it and how, regardless of a consensus view, there existed a totaly objective measure of uncertainty.
Even though I see wordsmithing and spinning with the uncertainty issue in making climate science claims in order to give the claims a more objective flavor, I see it in the end being merely a tally of a show of hands by a limited number of scientists — and without revealing who voted how or even how the subject of the vote was limited. I keep asking for someone to straighten me out on this issue, but as of now I have had no responses.
More on brightness temperature.
The brightness temperature is calculated by assuming the radiation is coming from a blackbody at that temperature. Blackbody emission at any wavelength (or frequency) is calculated using the Planck equation. It’s actually simpler than that, though, because the Rayleigh-Jeans approximation holds for microwave frequencies and the brightness temperature is directly proportional to the actual temperature. The AMSU channels measure the emission from the oxygen band at 60GHz. Oxygen emits and absorbs in the microwave region because it has a non-zero magnetic dipole moment. The brightness temperature and the actual temperature will only be the same if the emission being measured is saturated (the proportionality constant is 1). Almost all the channels (all but one, IIRC) in the AMSU measure on the wing of the emission band rather than the peak so emission is not saturated and the observed brightness temperature will be lower for those channels than the actual temperature.
#55
It’s hardly unreasonable to do a comparison if the two points in a topical post.
Actually it is very misleading and statistically irrelevant.
streamtracker wrote in 108:
Are you hoping that if you pretend that Steve gave us nothing but two data points, and proceeded to draw some conclusion from them, that we will forget the actual content of his post?
RSS has revised their data for middle troposphere and lower stratosphere temperature anomalies. They are now version 3.2 instead of 3.0. Lower troposphere continues to be version 3.1. I didn’t bother to check how far back the revision affects the data. The changes are described here
.
#103 Jon
Not exactly. This assumes that the sources are in fact unbiased for the parameters being estimated. Including a source which is biased (regardless of its variability) can produce an estimator with a higher mean-square error than omitting it. In this case, I suspect that, because the ice has a considerably higher variability than the mercury, it would require a demonstration that that the bias is very low before using it as a “proxy”. Considering the effects of other variables (cloud, sea currents, etc.) on the melting of ice, this sounds like quite a task.
GISS SST numbers are out.
June comes in at 26, continuing the downward trend at GISS and making it the seventh lowest anomaly this decade.
Lots of history was rewritten by the June temperature, with 89 monthly adjustments upward and 22 downward. Most of the downward adjustments were made this decade, and most of the upward adjustments were made pre-1941. At an annual level, 9 years before 1928 were adjusted upward, and 2007 was adjusted downward.
As for 2008, Jan and Feb were unchanged, Mar up 2, Apr up 1, and May up 3. The uplifts in M-A-M surprised me some, because I would have expected out of season months (such as June) to have no effect. Such is the GISS method.
What’s GLB is that global?
I didn’t find it here
http://www.climateaudit.org/?page_id=1288
GLB would be global. In the UAH table it’s Globe
GISS data for June’s global surface temperatures is already available:
Not bad for a warming scenario.
#112 sorry John, I should have seen your comment first. Anyway the graph helps putting data in perspective.
CU.
#115 What? Even GISS is going down? Are they sure to have applied all adjustments available??
LT Global Average Temperature since January 2007
2007 1 0.594
2007 2 0.45
2007 3 0.403
2007 4 0.244
2007 5 0.199
2007 6 0.203
2007 7 0.255
2007 8 0.286
2007 9 0.201
2007 10 0.231
2007 11 0.209
2007 12 0.114
2008 1 -0.046
2008 2 0.02
2008 3 0.089
2008 4 0.015
2008 5 -0.18
2008 6 -0.114
——————————————————————————–
NO SIGNIFICANT WARMING SINCE AT LEAST ~1940
Posted with figures and sources May 24, 2008 at
http://www.iberica2000.org/Es/Articulo.asp?Id=3774
Excerpt:
The evidence to date suggests that increased atmospheric CO2 plays NO significant role in causing global warming.
The best data shows no significant warming since ~1940. The lack of significant warming is evident in UAH Lower Troposphere temperature data from ~1980 to end April 2008, and Hadcrut3 Surface Temperature data from ~1940 to ~1980.
Chart: The global cooling from approximately 1946-1977 coincides with the cool phase of a natural cycle called the Pacific Decadal Oscillation (PDO), and the warming from approximately 1977-2007 coincides with the warming phase of the PDO. NASA announced in 2008 that the PDO has again shifted to its cool phase. Significant cooling was experienced in 2007-2008, and is expected to continue.
Furthermore, it is clear that CO2 lags temperature at all measured time scales, from ice core data spanning thousands of years to sub-decadal trends – the latter as stated in my January 31, 2008 paper and previously by Kuo (1990) and Keeling (1995) .
In late November 2007 Pieter Tans described the close relationship between dCO2/dt and temperature, about one month before I made a similar finding. This is a further step forward in our understanding.
Figure 3 from my 2008 paper shows the close relationship between dCO2/dt and temperature, and the approximate 9 month lag of CO2 after temperature.
Finally, human-made CO2 emissions have increased almost 800% since 1940.
This data consistently suggests that the sensitivity of global temperature to increased atmospheric CO2 is near-zero, and thus there is no human-made catastrophic global warming crisis.
Allan MacRae, Calgary
May 24th, 2008
——————————————————————————–
Data sources:
LT data: http://www.atmos.uah.edu/data/msu/t2lt/tltglhmam_5.2
ST data: http://www.cru.uea.ac.uk/cru/data/temperature/hadcrut3gl.txt
My paper: http://icecap.us/images/uploads/CO2vsTMacRae.pdf
Tan’s paper: http://esrl.noaa.gov/gmd/co2conference/agenda.html
CO2 data from CDIAC: http://cdiac.ornl.gov/ftp/ndp030/global.1751_2004.ems
——————————————————————————–
Further explanation:
There has been very significant Lower Troposphere (LT) cooling in the past 18 months. This cooling has also been observed in the Surface Temperature (ST), but that data is much less reliable, as further discussed further below.
The average LT global temperature anomaly for the four months January-April 2008 (inclusive) is +0.02 degrees C.
The average LT global temperature anomaly for year 1980 is +0.09 degrees C.
The average ST global temperature anomaly for year 1980 is +0.08 degrees C.
The average ST global temperature anomaly for year 1940 is +0.02 degrees C.
By no significant warming, I mean no net average global warming between 1940 and 2008, as measured by our best instruments. There has been some cooling and warming and very recent cooling again, but not much net change since 1940.
Some observers might want to (erroneously, imo) use the ST data exclusively, to prove that warming has occurred. The 1980-to-present ST data exhibits a strong and misleading warming bias, as demonstrated by Michaels and McKitrick (2007) and others. Although the monthly variations in the ST and LT data match very well, the two plots diverge, with ST rising above LT. I sincerely doubt that this divergence is a long-term reality, since it would suggest that the surface has warmed significantly more than the Lower Troposphere over the past few decades.
For a comparison of ST and LT data, see Figure 1 of my January 31, 2008 paper.
Pacific Decadal Oscillation (PDO):
In ~1905, the PDO shifted into its warm phase and the world got warmer.
In ~1946, the PDO shifted into its cold phase and the world got colder.
In ~1977, the PDO shifted into its warm phase and the world got warmer again.
In ~2007-08, the PDO shifted into its cold phase and the world got much colder.
***********************************************************************************************
Steve, any sneak-peak at July data yet?
3 Trackbacks
[…] climate change will affect the Australian economy, if Rahmstorf’s drop continues to bring lower global temperatures and more anomoly […]
[…] the parameters and the start point would put all temperatures inside the confidence band. 4. Geoff Sherrington asks why only surface record data and not satellite data was used. Unlike surface data, the […]
[…] source […]