 After I posted GISS Spackle and Caulk, a number of commenters marveled at the symmetry of the histogram (GISS temperature estimate minus actual temperature). Some were dismayed that there was not a clear warming bias in the plot. Others were giddy for the very same reason. A few noted (as I hoped) that the differences tended to be rather large, but most seemed content with the fact GISS could hit the side of a barn from five feet.
No one should be surprised with the shape of the histogram. The “simulation” I performed required that all three months be available in a specific season for a specific station in order to calculate an estimate and compare it to the real value. For example, if summer 1957 was being tested, I needed June, July and August. If August were missing, the GISS algorithm would not be able to estimate June or July, and I would not have a real August to look at either.
With all three months available, I forced symmetry into the result. For every over-estimated August I needed a corresponding under-estimated June or July. The algorithm demanded that if I estimate all three months, their average must match the true average.
However, that is akin to saying that if I flip a coin often enough, the number of heads will be roughly equal to the number of tails. As most of us have experienced, coin flipping can be quite streaky. It is not uncommon to flip eight heads in a row. But having flipped that many heads does not change the probability of the next coin flip.
And so it goes with temperatures. In the actual application of the GISS algorithm, at most one month in a season can be estimated, so symmetry is not guaranteed. If one month is estimated more than another, it might be possible to introduce asymmetry.
As chance would have it, one specific month-year GHCN entry has had its temperature estimated by GISS far more than any other combination in the record. And as luck would have it, we have real GHCN data to compare against those estimates.
As has been noted repeatedly on this blog, MCDW records began replacing most non-US temperature records in the late 1980s. Most of the MCDW records begin in January 1987, and the records they replace generally end between December 1989 and December 1990. During the period of overlap, the MCDW records usually match exactly those that they replace. In a few cases they might differ by one or two tenths of a degree in the occasional month.
When an MCDW month begins in January 1987, the winter season temperature (DJF) is missing the December 1986 value, so GISS must estimate it. But the record that MCDW replaces contains a real, live December value. This means that, when an MCDW record agrees with an existing record during the period of overlap, the real December value can be compared against the estimate from MCDW. So of course I looked at this for all GHCN records.
Following is a histogram showing the GISS estimate of December 1986 minus the actual for GHCN stations in Europe and Russia. I will show other regions of the world in future posts. The reason I focus on this broad swath of land is that the resulting records are among the most lengthy available.
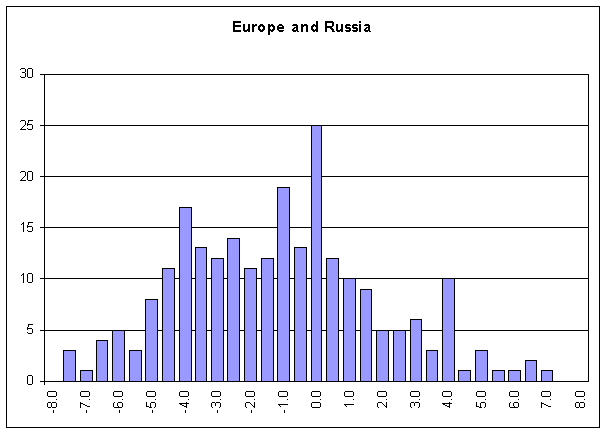
One might notice GISS under-estimates December 1986 for this region by a greater than 2 to 1 margin. So how does that affect the temperature record? (The resolution of the histogram is 0.5 degrees. There are actually only three exact matches to the temperature record. The remaining estimates in the “0” bin are actually colder by a 2:1 margin).
When GISS combines multiple records for a single station, it uses an undocumented enhancement to the “bias method”. This “enhancement” starts with the latest record, that being the MCDW record, rather than the documented longest record, which is usually the one with the real December 1986 temperature. An average temperature is calculated for both the MCDW record and the older record for the period of overlap, which is usually 1987 to 1990.
If the average temperature of the older record during the period of overlap is warmer than the MCDW record, the older record is “cooled” to match MCDW. The opposite is true if the older record is warmed to match the MCDW.
All things being equal, a cold estimate for December 1986 results in a colder 1987 to 1990 MCDW, as compared to the older record. Therefore, the older record is uniformly cooled to match the MCDW estimate. June 1906 is cooled just as much as February 1985. Across Europe, Greenland, Iceland, and all of Russia this happens more than twice as much as the warming does. And it is done to many records that go well back in time.
By cooling the older record and leaving the current record unchanged, an enhanced warming trend is introduced. This is completely artificial, of course, because the actual December 1986 temperatures are available.
In this case, GISS got their eight heads in a row.


74 Comments
I am speechless.
I think I see Waldo.
Cool!
Based on Anthony’s occasional exhibition of actual series, this is not surprising.
Thank you for confirming the actual mechanism.
I’m getting confused. In the prior thread you said “Recall that GISS never explicitly estimates missing monthly temperatures.” But here they are estimating December 1986. How is this estimate calculated?
Hmmm, interesting.
It looks like you’ve managed to find a bias in the GISTEMP estimation method. I’m relieved that you seem to accept that the method *should* be non-biased. That is, any bias is introduced by chance.
Hopefully you can quantify the bias a little more clearly. What is the mean of the December 1986 bias? What is the net effect on records prior to 1986?
If I understand correctly, the adjustment to the older record is equal to the difference between the averages for the older record and the MCDW record from 1987 to 1990 inclusive. That is, the adjustment is equal to the December 1986 error divided by 48 months. Is that correct?
I hope the body responsible for these data sets can:
1. Confirm Steve’s analysis
2. Rectify the error, and,
3. Publish a paper (peer reviewed of course) publicising the error so that climate scientists know they now have more accurate data to work with, and that their previous work may need amendment.
If not, I hope that body posts here the reasons why it would not take that sort of action.
Can you show a plot with a time series of one station with the MCDC and ‘real’ record on the same vertical axis? Please indicate the ‘real’ December 1986 temperature and the ‘simulated’ temperature. And if needed, a zoomed-in image showing the overlap period. Preferably, this would be when the December temperature difference was large, say |dT| > 5 (C? or F?). Thanks.
re #6 JohnV,
It would appear so. But don’t forget that the adjustment applies to all the previous years, not just 48 months. Eyeballing it, it would appear the bias averages about 2 deg C. So all dates in the long series before 1987 would drop about .04 on average from this one bias. How important is it? Who knows? But if it’s validated, it should be corrected.
BTW, Colin, this post was by John Goetz, not Steve M.
Please forgive an ignorant question. Where are ocean temperatures in these discussions?
When you splice two series,you have little choice but to calculate a calibration adjustment. Unless you have a a clear reason not to, it is normal to apply the correction to the whole of one or other of the series.
Clearly you want to avoid using estimated data to calculate an adjustment. Clearly you do not want to use estimates when you have the real data. If daily records were used where available there would be much more data points in the overlap.
OK so the current process is sloppy work. BUT, errors are diluted by the real months used. Given all the other problems the overall effect is likely to be considered to be technical or slight. This is not THE bug which generated AGW.
However, I think is was Christy who said, you have to watch out for the correction process. If you correct false cooling bias better than you catch warming bias, you introduce a warming bias. I am betting this would have been picked up rapidly if it cooled the present. Which is of course why this site does a good job.
11…
and if they are only correcting cool biases and turning a blind eye to warm biases and are invested in the carbon trading market, then the FEC should have a look at it and prosecute if need be.
So yet another of Hansen’s algorithms produces an (unintended?) bias in historical records in favour of cooling in the past.
How original.
By cooling the older record and leaving the current record unchanged, an enhanced warming trend is introduced
This seems remarkable. Can one measure the size of the “artificial” warming trend? Is this something that can be justified based on any statistical methodology with which you are familiar?
Re #7 and #9
Thankyou Dave for pointing out my error, and apologies to both Steve and John for my getting the authorship wrong.
This is excellent work, and John is to be congratulated on his detective/diagnostic skill.
Steve – snip – please avoid angry posts.
#6 JohnV
I absolutely agree that the estimation bias is by chance. My first post on the topic should make that clear – when the estimation is applied uniformly across the entire record worldwide, the too warm and too cold estimates, while large, are uniformly distributed.
In general the bias introduced when combining an old record with a new record with an overlap period of four years as described above is indeed about 1/48 the size of the estimate error. When we first noticed the problem with the Russian data it was due to an artificial cooling of between 0.1 and 0.3 C in a number of the records.
I have no idea what the effect is on the global record. By itself it might not be significant. I have a hunch that between this particular effect, the vast amount of estimation going on, the sudden drop in station data post 1990, there is a significant effect on the record (positive or negative).
To answer your other question, the mean is -1.3C and the standard deviation is 3.0C.
<blockquote>June 1906 is cooled just as much as February 1985. </blockquote>
Is that a typo? Should it be June 1986?
Reply: No typo. I could have said October 1933.
I am glad to see this topic again. The estimating Dec of the previous year never made sense other that to save a little programming time forcing the data to fit the dec-nov temperature year versus the Jan-Dec calender year as the data was stored.
It appears to be an honest mistake that could be easily corrected without everyone having to guess at the outcome.
#8 Atmoz
Steve actually showed a pretty good example about this time last year before we knew what was going on.
Nice work John. This explains the charts Anthony has shown where the adjustments pin the present temps as a hinge and the past is reduced, maddening to consider in light of UHI effect. Based on the completed surveys at surfacestations.org, the current temps are biased +5.0 degF minimum. Even without that, this makes the present temps appear to have risen 1.3 degC with 2 sigma limits at +/- 6 degC. This seems as much or more than the amount of ‘warming’ that has occurred, even as espoused by Hansen.
When the auditors come knocking, best you just shut up, go get the spoon, and start feeding. It’ll save a lot of time, trouble, and embarrassment for everyone.
Nice forensics, John Goetz.
Over at icecap.us, under What’s New & Cool, 8/13/08, is a backcasting chart with a very nice match of the GCMs vs. observations. If one subtracts 1.3 degC from the current ‘observed’ and model starting point, the temperature matches the temperature for ‘Natural Only’ influences on climate. Interesting…
Aggressive non-compliance is just raising the ante. Why would a smart person do that?
Re #24 Bender: Maybe they are just hoping to stave off the inevitable until retirement.
Joe
It seems to me that an estimating algorithm would be extremely easy to test. You should be able to take your entire database, punch out each known entry one at a time, create an estimate for that entry, compare the real and estimated entries, and sum up the errors. A failure to sum to zero shows a clear bias.
Given that the estimation alogorith is easy to test, how can you get it really wrong?
John Goetz,
Please confirm that since the mean of the December 1986 errors is -1.3C and the average is over 48 months, the mean pre-1987 station correction is:
-1.3C / 48 months = -0.027C
Reading the comments it seems that some readers believe the mean correction is -1.3C. I’m sure you wouldn’t want to give that impression. An error is an error and this should be fixed, but I think it’s important to be clear about the error’s magnitude.
December 1986 will go down in infamy
One more quick request — could you make your data and/or calculations available? Thanks.
John,
Can you explain this:
This is simply the monthly GISS series, less the HadCRUT series, after both have been rebased to 1971-2000. Based on your investigations into GISS, can you make any sense of this? Except for 1960-1990, where the two are in reasonably close agreement, there appear to be systematic differences between the two. You can see GISS ramping up relative to HadCRUT in the last decade, in the 1940’s, and from 1880 to about 1910. From 1920 to 1940, the trend is in the other direction. Is the latter GISS dampening the warming trend of the 1920’s and 1930’s somehow? (I’m not attributing intent; I’m just trying to understand results.)
I would think that the statistical procedures for preparing these series would result in a bit more randomness to the differences. Where the differences are not random, then then there is a measurement or estimation bias creeping in to one or the other, and it is fair to ask what is causing it, I should think.
Also, I think the magnitude of the differences is interesting. Two standard deviations is about .17. Isn’t this just measurement error? I.e. we are not talking “noise” here in the sense of natural random monthly variation. This is just error in even knowing what the monthly anomaly is!
The key point in this is the quality of the science.
The estimations done by GISS are sloppy. The peer review process is incredibly sloppy. The failure of anyone in the alarmist community to check the quality of the surface temp station siting is really sloppy. The adoption of the hockey stick without anyone making an effort to check Mann’s work was beyond sloppy. The wild guess assumptions uncovered in the sea surface temp records was sloppy. The failure to archive samples and data sets is sloppy. The unwillingness of IPCC scientists to comply with its record requirements is sloppy. [The calls to stifle dissent is way beyond sloppy.]
There seems to be a pattern developing here regarding the quality of the science.
Add to my post #31,
The refusal to employ the services of the best experts in statistics, forecasting and computer modelling is sloppy.
If this were a Government departmental matter, resignations would be in order. Oh, wait….
Well-summed Stan.
The “precautionary principle” advocates tolerating a certain amount of slop. It is easy to justify under the doctrine that competitive science is [eventually] “self-correcting”.
Basil,
have you considered that having different data sources will cause different results?
GISS includes some Antarctic data which they do a lot of estimating to fill in. HadCrut doesn’t. A small increase or decrease in the Antarctica source will have larger differences on the final result. This both raises and lowers GISS compared to HadCrut. There may be other areas with similar issues. There are similar differences between UAH and RSS based on coverage (but not magnified by infilling).
I dislike this “self-correcting” excuse. The share price of Enron was “self-correcting”. The fact that the share price will ultimately be “self-correcting” would not be held out in stock markets as a reason not to have disclosure and due diligence. Those are forms of “market protection”. In academic cases, one cheap and easy way to improve “market protection” is – to repeat a mantra – archiving data and code for all results. Journal peer review serves a role, but why not improve “market protection” with a cheap, easy and efficient measure?
So do I. That’s why I clarified the role it plays in due diligence inactivism.
Not resignations. Retirements.
After the Forest Service burned down part of our town due to the slight miscalculation of starting a controlled burn during a very hot and windy time, the head person for the Forest Service in this area retired. With a full pension. To someplace very far away from here.
The point being, don’t worry about what happens to anyone involved in these matters. Keep your eyes on the facts of the matter, and hope that eventually nearly everyone will come to a consensus on what the truth is. Remember that phlogiston remained a viable explanation for about a century.
Thank goodness for ClimateAudit: Pushing for truth, freedom, and the bottom line. Too bad the contributors to this site will never get a Nobel Prize, or an Oscar.
John, can you be more clear about how much this error has artificially adjusted the global historical temperature trend?
But ladygray
You forget our wonderful host and some of the other contributors to this site are in receipt of a Nobel Prize in this very subject – through participation in the IPCC, it’s not something they seem to brag about very often I admit.
John Lang said:
That sounds like a major undertaking and a great potential blog pool.
Here’s my entry based on the ROW having similar results: 0.10 C over the past century.
#20 John G:
The post you linked did not answer my question. The the explanation in this post, what you did and what exactly is represented in the graphic is unclear. Perhaps an example will illustrate my point. I don’t have the raw GHCN data, nor the tools to properly work with it. Instead I’ll use GisTemp. (Hopefully the image shows.)
The top panel is the GisTemp split into two time series, representing the station data before they combine them into 1 record. There is an overlap period from 1986 to 1990. Clearly, the later record is unnaturally warmer than the prior record, and it needs to be adjusted somehow. Since there is an overlap period, one way to do it is to find the difference in the means during the overlap period, and then (in this example) adjust the prior data warmer or the later data cooler.
But first, I estimated the December 1986 temperature anomaly in the later data, so that I could calculate DJF seasonal mean if I wanted. My method was to simply use the anomaly for January 1987. I’ve plotted those as the red dots in the top panel. Notice that there is a large difference in the temperature because one is in reference to the first time series, and the other is in reference to the second time series.
When the two time series are combined (middle panel), the difference in the December 1986 temperatures becomes small. The bottom panel shows the difference between the combined data using the estimated temperature for December 1986 and the actual temperatures in GisTemp. Here the actual difference between the 2 December 1986 temperatures was less than 0.2C even though the bias was 1.3C. So my question is whether you the histogram is comparing the two temperature prior to or after being adjusted using the overlap method. My hypothesis is that it is prior, and your histogram actually shows the average bias between the two data sets.
I asked for |dt| > 5C because that is a large deviation, and it should be obvious when looking at the monthly data.
I echo JohnV’s request in #29 for the data and algorithm to be made available for examination. Thanks.
I have followed CA for two years. I continued to be amazed by the blatant and unfounded attacks by Hansen, Mann, Schmidt et al against you and Anthony Watts for attempting to have a rational dialog about research in an area of science that is barely understood. Then it occurred to me that these gentlemen must have Italian ancestors.
Why? Because they maintain scientific data like Italian businessmen keep their books. It is well known that the typical Italian businessman keeps four separate sets of financial records: one set is correct, proper and secret; another is for his wife to view; another is for mistress; and the final set is for the tax collectors.
I do not intend to offend any Italians. I first heard of business accounting, Italian style, from an Italian client of mine. It is an example of their self-deprecating sense of humor. PC, no; funny, I think so. But then, I am of Irish descent.
re: #43 Atmoz,
I think you’re confused on what John G found. All of the actual overlap matched. It’s just that because many of the new stations started in January of 87 rather than Dec 86, there was no reading for December ’86 in them and a new Dec 86 reading was produced (to allow calculating seasonal data) using the given algorithm instead of taking the existing reading for Dec 86 reading from the old station. This Dec 86 reconstruction averaged 1.3 deg C lower Therefore, the old station was offset a few hundredth of a degree downwards so the means would match. This problem was sloppiness but it’s not going to be a large correction. The big problems with ROW temperatures are still likely to be in UHI increases and in site biases.
The good result which could happen is that some warmers might come to their senses and see that they need to go over the data with a fine tooth comb and multiple eyes rather than just winging it.
#27 John V:
Yes, the average delta for December 1986 in Europe / Russia is -1.3 C. This is the difference between the estimate and the actual, meaning, on average, GISS will underestimate that month by -1.3C.
If there is a four-year overlap then you are correct in that the bias will be -1.3 / 48. However, I have scanned a number of records and noticed that in fact the older record tends to have an incomplete 1990, with no annual average. That means the overlap period would be 3 years, and so the bias (on average) would be -1.3 / 36.
JohnV and Atmoz:
The data is the GHCN v2.mean data. It is about 12MB zipped, 45MB unzipped. The algorithm I use is very simple and can be found in my previous post.
Here is a confession. I use Excel and VBasic. I have played with R and happily run Steve’s R code, but I am not comfortable writing code from scratch in that language. v2.mean won’t fit in a single Excel worksheet, so I went through a process to carve it into pieces by geography. That would represent my only prepping of the data.
The procedure my script follows is to look for stations with at least two records, one of which begins in 1987 and the other begins before 1987 and ends by 1992 (a station can have more than one record). For the station that begins in 1987 I first calculate the average temperature for December, January and February, ignoring the -9999 values that represent no data. I then calculate the December 1986 estimate by subtracting the January average from the January 1987 value to produce a January delta, subtracting the February average from the February 1987 value to produce a February delta, adding the two deltas together and dividing the result by two, and adding that result to the December average.
Of the remaining records that begin before 1987 and end before 1992, I look for the longest one as this is the one that GISS will combine first with the record that begins in 1987, and therefore is the source of the bias. In this longest record, I grab the December 1986 value along with the January 1987 and February 1987 values. If the January and February 1987 values match in both records, I subtract the real December 1986 value from the estimated value.
That’s about how complicated it gets.
#43 Atmoz:
Take a look at this post and scroll down to the Update. This attempts to graphically show what happens with the bias method.
John Goetz:
Thanks for the replies. Can you confirm that if the average is over 36 months, then the average error in old stations records is:
-1.3C / 36 months = -0.036C
I’d still appreciate it if you would make your spreadsheet available. The kind of algorithm you described can easily go wrong. More eyes on the code increase the likelihood of finding any errors.
John G:
Thanks, especially for the second link that points here. I can think of several ways to account for missing data, but none that would bias it as much as this. Does anyone know where in the GisTemp source code this is done so I can have a looksee?
Also, if this is as prevalent as you suggest, shouldn’t there be a stronger bias in the D-N average annual temperature compared to the J-D average?
Atmoz said:
If only such requests were regularly made to “Team” members (and honoured),
[self snip venting]
50 atmoz,
Interesting that you would ask for the GISS code. The Russian Bias thread from a year ago has several links to data and code sources. Hopefully, the data used at that time is still intact somewhere for your perusal. Steve is pretty good at archiving data bases used for his posts. Some of the metadata used has been subject to change on occasion by other institutions.
Perhaps Steve, John G. or Bishop Hill can summarize this discussion. To my recollection, the release of confusing code, shift in data bases and changes instrumentation made this subject more complicated than it should have been.
#50 Atmoz
The bias method we are discussing is performed in Step 1 of the GISStemp source code, which can be downloaded here. I have a couple of copies archived, but it is always good to get a fresh copy. Step 1, unfortunately, is written largely in Python.
Note that the bias method was reverse-engineered before the source code was released, so you won’t find the equations I quote in the code. However, I can guarantee you that they work perfectly. I have verified them manually on hundreds of data points, without a single problem. Plus they are simple and elegant.
I’ve had the code, but I don’t know Python so it’s hard to understand what they’re doing in each function.
“unfortunately, is written largely in Python”
… have a look at the latest update.
#55 Atmoz
Great. They could have at least chosen R.
They run shell scripts to build their code instead of cmake or automake or make…amateurs.
Notice the lack of svn or cvs headers…freakin’ amateurs.
Python… nice.
I’ve been looking for a reason to dive a little deeper into Python.
It sure beats Fortran.
John V 59 says:
Perhaps I have had one Scotch too many but that would be the ultimate computer nerd comment for a sci-fi movie. Nothing personal or derogatory, just a perfect line.
🙂
The measurements are daily. Any splicing should use the daily figures where possible. Months are already damaged goods. Missing values are estimated. Valid observations are dropped if too many other days in the month are missing. Just to remember the obvious, months can be 28,29,30,31 days long.
If there is a cleanup,
1)
They need to check if some of the missing days have turned up either as daily or monthly.
Which means activily asking for it. In the pass on this site there have been many stories of missing data which was hiding in plain sight.
A post at RC asking for folks to do a data swap would go a long way in this.
2)
Redo the splices using all the available data.
Hansens lot do several revision a year, so fixing the splice would not be a lot of extra work.
As I understand it the estimates for missing days is recalculated in each revision run, and as this involves the mean of the series. As the series gets longer, the mean changes, and very old values are revised. Even the 1930’s is continousily revised 80 years later. If you sort this out at the same time, what time you lose redoing the splices will be more than made up avoiding repeatedly updating the past missing data.
John,
Some times ago, I wondered why for most European stations, particularly in France, we observed a jump around 1987, something I ironically called the “Tchernobyl effect” without further explanations: see for example Toulouse or Marseille (but it’s true almost all French stations).
You may find some interesting results investigating over here.
In France, the Governement, the climate establishment and the media keep hammering Western Europe has had an “unprecedented” warming of 1°C over the last 100 years to keep the regulating machine rolling.
Now, I know it’s “very likely” this sudden warming is man-made… in some climate laboratories.
#62 Sean,
What I had found when looking at the Russian Meteo records in May was that, if even a single day’s worth of day was suspicious, GHCN would drop the entire month’s worth rather than estimating the day. By dropping the month, GHCN was forcing GISS to produce an estimate. In a follow-up post I showed that the estimate was not particularly close.
Interestingly, one day after I posted the follow-up the Meteo records were taken offline and have not been restored.
I had started to take a look at the effect of assuming all months were of equal length, and then got distracted by summer vacations. I should revisit that.
#63 I have noticed the ~1987 “jump” in non-US temperatures as well. I have not seen enough evidence that it is non-natural. Certainly it coincides with MCDW splicing, but if I look at the records before the splice occurs, the jump seems to still be there.
RE 59.
Python is a nice choice. have a look if you know C it should be a
cake walk ( walking through your code I have no doubts)
ON other matters:
My sense is that fair minded people ( atmoz, JohnV, lucia, JohnG stMac)
will come to fair minded conclusions. Or at least frame the question
in a fair minded way.
re 55 (Atmoz):
Python is easy. It’s the Fortran that slows me down. If it were all Python you probably would be up and running in no time.
p.s. There is an interface to use R from Python:
here
#63 John G.
For the past year I have been looking for some explanation for that jump. There has to be a natural reason, but it doesn’t seem to jibe with NAO or Gulf Stream variations. One interesting thing is that the 1987 storm in southern England and France had some monster temperature gradients. I would love to see an animation of LT temps in that region from the mid 80’s to mid 90’s.
Why re-write Statistical routines that are available as standard, as single commands, in a free purpose built program like “R”?
PS. Freeing the code shouldn’t mean freeing the code to Python programmers only, should it?
#70. In Juckes’ mitrie enterprise, he wrote a linear regression routine in Python. His routine is fine as far as it goes, but it is ludicrous to bother doing things like that. R is absolutely sweeping the field in statistical analysis. There are more packages than one can imagine. Its handling of vectors, matrices and lists is clever beyond words. Again they seem to be a dollar short and a day late.
John Goetz,
I like the coin-flip illustration and wonder where you got it originally? I’d like to put it in an illustration which will be on a blog (totally different subject than this) and was wanting to get permission to use it.
Recent Posts
* WordPress upgrade imminent
* December 1986 – Irony
* Erice Seminar
* Pielke Jr discusses the Bishop and the Stick
* December 1986
appears twice in the right hand nav column above and below the science award
One Trackback
[…] the value would end up being divided by 36 or 48 in order to yield the adjustment amount. See here and […]