Tamino’s realclimate post re-states points that I’ve discussed at length in the past. Here is a re-posting of a 2008 post on Tamino that deals with most of the issues in his realclimate post.
Tamino has recently re-iterated the climate science incantation that Mann’s results have been “verified”. He has done so in the face of the fact that one MBH98 claim after another has been shown to be false. In some cases, the claim has not only been shown to be false, but there is convincing evidence that adverse results were known and not reported.
Today I’m going to look at what constitutes verification of a relationship between proxies and temperature, assessing MBH results in such a context, trying as much as possible to emphasize agreed facts.
Verification
One thing that Tamino and I agree on is that a proposed reconstruction should “pass verification”. Tamino says:
… frankly, that’s the real test of whether or not a reconstruction may be valid or not. If it passes verification, that’s evidence that the relationship between proxies and temperature is a valid one, and that therefore the reconstruction may well reflect reality. If it fails verification, that’s evidence that the reconstruction does not reflect reality. It has the drawback that the data we set aside for verification we must omit from calibration; with less data, the calibration is less precise. But without verification, we can’t really test whether or not the reconstruction has a good chance of being correct.
and later
… it’s the verification statistics that are the real test of whether or not a reconstruction may be valid. Pass verification: probably valid. Fail verification: probably wrong.
While we strongly disagree on what constitutes “verification” and whether the MBH reconstruction “passes” verification, I’m prepared to stipulate to a verification standard.
If the MBH reconstruction can be shown to pass thorough verification testing, including, at a minimum, the steps described below, then, however implausible the notions may seem, I will advise readers to get used to the idea that bristlecones are magic trees, that their tune is a secret recording of world climate history and that Donald Graybill had a unique method of detecting their tune. However, these alleged magic properties should be subjected to (and withstand) scrupulous scientific investigation and verification and I do not agree with Tamino that these magic properties have been “verified”.
Without limiting the range of scientific investigation that any claim of a magical relationship might be subject to, the following verification tests seem to be to be a minimum that any scientist should require prior to grudgingly acquiescing in the view that a magical relationship exists between Graybill’s bristlecone ring width chronologies and world climate. (Similar considerations apply to any reconstruction heavily dependent on a very small number of “key” series.)
Failure in any one of these should result in Tamino rejecting the MBH reconstruction according to the verification standard. I submit that MBH has failed every one of these tests. Indeed, it’s hard to imagine a more dismal verification failure than what we’ve seen with MBH. Worse, efforts to verify their work have been contested and obstructed at every turn, leaving a very unsavory impression of the people involved.
Standard Verification Tests
First, the MBH AD1400 reconstruction failed standard dendroclimatic verification tests (Fritts 1976, 1991; Cook et al 1994; see NAS Panel Box 9.1): verification r2 (0.02 MM2005a; 0.018 Wahl and Ammann); CE ( -0.26 MM2005a; -0.21 Wahl and Ammann). These are not immaterial or irrelevant failures: for example, Eduardo Zorita said that his attitude towards the MBH reconstruction changed when he learned of the verification r2 failure.
Second, while Wahl and Ammann now (after the failure was exposed) argue that these failures don’t “matter”, that it’s all about low-frequency versus high-frequency, these are subtle issues where Wahl and Ammann hardly constitute high statistical authority (or even low authority). Readers are entitled to full disclosure of the adverse results and then judge for themselves whether they are persuaded by the Wahl and Ammann high frequency-low frequency argument. MBH readers were not given this alternative. MBH claimed that their reconstruction had “highly significant reconstructive skill”, not just in the RE statistic, but also in the verification r2 statistic, illustrating this claim in their Figure 3 excerpted below:
 |
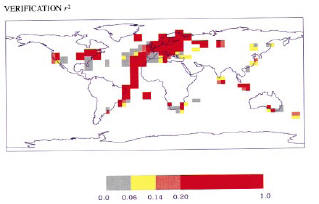 |
Figure 1: MBH98 Figure 3 panels b, c. The running text in MBH98 stated: “Figure 3 shows the spatial patterns of calibration β, and verification β and the squared correlation statistic r2, demonstrating highly significant reconstructive skill over widespread regions of the reconstructed spatial domain [emphasis added]” and later: “β [or RE] is a quite rigorous measure of the similarity between two variables … For comparison, correlation (r) and squared-correlation (r2) statistics are also determined. [emphasis added]”
These claims of statistical “skill” were not an idle puff by MBH, but were relevant to the widespread view that MBH methods represented a new level of sophistication, separating their work from Lamb’s prior work purporting to show a Medieval Warm Period. These claims of statistical skill were relied on by IPCC TAR, which made extensive use of the MBH reconstruction stating:
[MBH] estimated the Northern Hemisphere mean temperature back to AD 1400, a reconstruction which had significant skill in independent cross-validation tests.
The failure of important verification statistics should have been reported in MBH98, but wasn’t. It should have been reported in the 2004 Corrigendum wasn’t. Mann told Marcel Crok of Natuurwetenschap & Techniek that his reconstruction passed the verification r2 test,
Our reconstruction passes both RE and R^2 verification statistics if calculated correctly.
Later, Mann was reduced to telling a nonplussed NAS panel, well aware of Figure 3 shown above, that he had never calculated the verification r2 statistic, as that would be “foolish and incorrect reasoning”.
Perhaps Tamino can try, like Wahl and Ammann, to make a strained argument that the verification r2 (and CE) statistics don’t “matter”, but please – no more of this talk that MBH claims of statistical skill in the verification r2 statistic have been vindicated. They haven’t. And if you don’t believe me, look at Table 1S of Wahl and Ammann 2007 (which required a long and unsalubrious history prior to its inclusion in this article.

All of this discussion pertains to separation of in-sample calibration and verification periods – a separation which is complicated by the fact that you already know the results. The relevant test really comes from out-of-sample testing and verification scores, which I’ll discuss below.
“Robustness” to Dendroclimatic Indicators
Third, another important and untrue MBH claim has not been verified is its supposed “robustness” to the presence/absence of all dendroclimatic indicators. Various issues related to dendroclimatic indicators had been cited in IPCC Second Assessment Report; one of the main selling points of MBH was its multiproxy approach which seemed to offer some protection against potential dendro problems. MBH98 stated:
the long-term trend in NH is relatively robust to the inclusion of dendroclimatic indicators in the network, suggesting that potential tree growth trend biases are not influential in the multiproxy climate reconstructions. (p. 783, emphasis added.)
We have also verified that possible low-frequency bias due to non-climatic influences on dendroclimatic (tree-ring) indicators is not problematic in our temperature reconstructions…
These claims have been demonstrated to be untrue. If a sensitivity analysis is done in which the Graybill bristlecone chronologies are excluded from the AD1400 network, then a materially different reconstruction results – a point made originally in the MM articles [note: also Cook’s old Gaspe chronology which has its own serious issues – see below], confirmed by Wahl and Ammann 2007 and noted by the NAS panel. In addition to failing the verification r2 test, a reconstruction without bristlecones fails even the RE test. Wahl and Ammann argue that this is evidence that the bristlecones should be included in the reconstruction; this argument has not been accepted by any third party statistician. However, for the present point, the issue is quite different and has never been confronted by Mannians: the discrepancy between reconstructions with bristlecones and without bristlecones means that the representation that the reconstruction was “robust” to the presence/absence of all dendroclimatic indicators is untrue. This recognition of non-robustness was recognized by the NAS panel which actually cited Wahl and Ammann on this point (STR, 111):
some reconstructions are not robust with respect to the removal of proxy records from individual regions (see, e.g., Wahl and Ammann in press)
There is convincing evidence that Mann et al knew of the impact of Graybill bristlecone chronologies on their reconstruction, as the notorious CENSORED directory shows the results of principal components calculations in which the Graybill chronologies have been “censored” from the network. Long before we identified the non-robustness to bristlecones, this non-robustness was known to Mann et al. While some comments in MBH99 can be construed as somewhat qualifying the robustness claims in MBH98, any such qualifications were undone in Mann et al 2000, which re-iterated the original robustness claims in even stronger terms than MBH98.
Some defenders of the Mann corpus have argued that the claims in Mann et al 2000 were narrowly constructed and referred only to the AD1730 network, which was the one illustrated in the graphic. In my opinion, the robustness claims were not limited to the AD1730 network, but included all networks [“our temperature reconstructions” is the phrase used.] But regardless, if Mann et al knew that the AD1400 network was not robust to the presence/absence of dendroclimatic indicators (which they did), then they had an obligation not to omit this fact (just as they had an obligation not to omit reporting the failed verification r2 statistics for networks prior to AD1820. )
Fifth, there is an important claim about the relative importance of the HS pattern in the North American network that not only has not been verified, but has been refuted. This particular issue has more resonance in terms of our personal experience than to others, but, as the people most directly involved, it was an extremely important matter. In response to MM2003, Mann et al argued that the HS shape of the North American PC1 represented the “dominant component of variance” or “leading component of variance” in the North American tree ring network and that the emulation in MM2003 had omitted this “dominant” component of variance. This was played out pretty loudly at the time. As readers will now recognize, this “dominant” or “leading” pattern was nothing of the sort. It was merely the shape of the Graybill bristlecone chronologies promoted into a far more prominent position in the PC rankings than they deserved, by reason of the erroneous Mann PC methodology.
In Mann’s first Nature reply, he was still holding to the “dominant component of variance” position. However, by the time of his revised Nature reply, he’d realized that the problem was deeper and conceded that the bristlecone shape had been demoted to the PC4 (an observation noted in MM 2005 (GRL, EE)). Instead of continuing to argue that the HS was the “dominant” or “leading” component of variance, he now argued that he could still “get” an HS shape with the bristlecones in the 4th PC if the number of retained PCs was increased to 5, invoking Preisendorfer’s Rule N as a rationale for expanding the roster to include the PC4. Of course, MBH98 had indicated a somewhat different rationale for PC retention in tree ring networks, but the description was vague.
My calculations indicate that it is impossible to obtain observed PC retention patterns using Rule N, with notable discrepancies in some networks. Was Rule N actually used in MBH98 or was it an after the fact effort to rationalize inclusion of the PC4? Wahl and Ammann didn’t touch the issue. With 20-20 hindsight, Mann et al might wish that they had used Rule N in MBH98, but no one’s verified that they did.
Graybill and Gaspé Chronologies
Given the acknowledged dependence of the MBH reconstruction on a very small number of tree ring chronologies, any engineering-quality verification for policy reliance, would inevitably include a close examination and assessment of the reliability of these chronologies, including re-sampling if necessary.
The key bristlecone chronologies were taken over 20 years ago. They were all taken by one researcher (Donald Graybill), who was trying to prove the existence of CO2 fertilization. Graybill may well have been eminent in his field but it is ludicrous that major conclusions should be drawn from unreplicated results from one researcher. TParticularly when there are also extremely important and unexplained differences in the behavior of Graybill’s chronologies from those of all other North American chronologies. The graphic on the left is a scatter plot compares the weights of the Graybill chronologies (red) in the MBH PC1 to those of all authors, relative to the difference between the 20th century mean and overall mean. You can tell visually that the Graybill chronologies have a far larger difference in mean than the majority of chronologies (unsurprisingly, this difference in mean is statistically significant under a t-test).
 |
 |
Figure 2. Comparison of MBH98 NOAMER PC1 weights to difference in mean, showing Graybill in red. Left – unquared; right – squared weights.
Aside from every other issue pertaining to MBH, any examination of this data requires an explanation of why the Graybill chronologies have a difference in mean that is not present in the other chronologies. This issue has nothing to do with PC1 or PC4. It’s really a question of whether there is an “instrumental drift” in the Graybill chronologies.
Let’s suppose that you have 70 satellites, using 8 different instruments, and that one instrument type has a drift relative to the others. If you do a Mannian pseudo-PC analysis on the network, the Mannian PC1 will pick out the instruments with the drift as a distinct pattern. Obviously, that would only be the beginning of the analysis, not the end of it. You then have to analyze the reasons for the drift of one set of instruments relative to the others – maybe the majority of instruments are wrong. But neither Spencer and Christy on the one hand nor Mears and Wentz on the other would simply say that Preisendorfer’s Rule N shows that the instrumental drift is a “distinct pattern” and terminate the analysis at that point. They’d get to the bottom of the problem.
Unfortunately, nothing like that has happened here. Mann and his supported have paralyzed the debate on esoteric issues like Preisendorfer’s Rule N and “proper” or “correct” or “standard” rules of PC retention and most climate scientists seem to be content with this and have failed to inquire as to the validity of the Graybill chronologies, both as tree ring chronologies and as tree-mometers capable of acting as unique antennae for world temperature.
Updating the Graybill Chronologies
An obvious way of shedding light on potential problems with the Graybill chronologies would simply be to bring them up-to-date, show that they are valid or not. Mann (and this argument is repeated by supporters) justified the failure to verify the Graybill chronologies on the basis that it is too “expensive” and that the sites are too “remote” – a justification conclusively refuted by our own “Starbucks Hypothesis” in Colorado.
Aside from our own efforts at Almagre in 2007, there is one other reported (but not archived) update, one which happened to be at the most important Graybill chronology – Sheep Mountain, a site which is not merely the most important in the AD1400 network, but one which becomes progressively more important in the longer PCs (especially the Mann and Jones 2003 PC1.) The Sheep Mt chronology was updated by Linah Ababneh, then a PhD student at the University of Arizona in 2003: see Ababneh 2006 (Ph. D. Thesis), 2007 (Quat Int). However, as previously reported at CA here (and related posts), Ababneh failed to replicate the distinctive HS shape of Graybill’s Sheep Mountain chronology, a shape that imprints the MBH reconstruction and, in particular, failed to verify the difference between the 20th century mean and long-term mean that led to the heavy weighting in the PC1. Her reconstruction was based on a far larger sample than Graybill’s. The differences are illustrated below:
Figure 3. Sheep Mountain Chronologies, Graybill versus Ababneh.
Linah Ababneh’s work has definitely not verified the most critical Graybill bristlecone chronology. Quite the contrary. Until the differences between her results and Graybill’s results are definitively reconciled, I do not see how any prudent person can use the Graybill chronologies, regardless of the multivariate method.
In our own work at Almagre, we identified issues related to ring widths in trees with strip bark that compromise statistical analysis, but have nothing to do with CO2 fertilization or previously identified issues. We found (See here here ) that strip bark forms can result in enormous (6-7 standard deviation) growth pulses in one portion of the core that are totally absent from other sections of the core, as illustrated below.

Figure 4. Almagre Tree 31 core samples, showing difference between cores taken only a few cm apart. Black (and red) show 2007 samples.
In a small collection (and “small” here can be as high as 30 or 50 cores), the presence/absence of a few such almost “cancerous” pulses would completely distort the average. The NAS panel said that “strip bark” forms should be “avoided” although they seem to have in mind the more traditional concerns of CO2 fertilization, than what seem to Pete Holzmann and myself as the problematic “mechanical” issues. Here there are some worrying aspects about the Graybill chronologies that should be of concern to more people than ourselves. Graybill and Idso (1993) said that cores were selected for the presence of strip bark so the possibility of a bias is latent in the original article. Second, at Almagre, we identified trees with tag numbers where cores had been taken and are located at the University of Arizona, but Graybill’s archiving was incomplete. Why were cores excluded from the archive? Given that the Graybill chronologies underpin the entire MBH enterprise, these missing invoices are, to say the least, disquieting, given Graybill’s seemingly unique ability to detect 20th century differences.
Gaspé
As noted elsewhere, there are issues about whether the Gaspé reconstruction has been included in the AD1400 netowrk only through ad hoc, undisclosed and unjustified accounting methods.
But aside from such issues, there is the important problem that, like Sheep Mountain, an update of the Gaspé chronology failed to yield the HS shape of the reconstruction used in MBH98. In this case, the authors of the update (Jacoby and d’Arrigo) failed to report or archive their update and it is through sheer chance that I even know about the update (which has not been reported anywhere other than CA). Again the “key” chronology used in MBH98 has not been verified.

The Bristlecone Divergence Problem
Ultimately the most relevant test of the “relationship between proxies and temperature” is whether updated proxies can reconstruct the temperature history of the 1980s, 1990s and 2000s. Here I mean the exact MBH98-99 proxies used in the AD1400 (and AD1000) networks; not a bait-and-switch. In the AD1400 (and AD1000) MBH case, a few key chronologies have been updated and so we have some insight on how the supposed “relationship” is holding up.
In our own sampling at Almagre, we found that ring widths in the 2000s were not at the record levels predicted by the Mannian relationship – and in fact had declined somewhat – one more instance of the prevalent “divergence problem”, but this example not limited to high latitudes and affecting one of the MBH PC1 proxies. Likewise, the Mann “relationship” at Sheep MT would call for record ring widths there, but not only did Ababneh not observe such records, as noted above, she raised serious questions about the original Graybill chronology in the first place.)
RE Statistic
In the face of all of this, how can Tamino (or anyone else) claim that the MBH reconstruction has been “verified”? Other than uncritical reliance on realclimate?
The main sleight of hand involves the RE statistic. The AD1400 reconstruction with old Sheep Mt and Gaspe chronologies has a high RE statistic. This appears to be the beginning and end of what Tamino (and realclimate) regards as “verification”. No need to verify the individual proxies. No need to pass other verification tests – even ones said to have been used in MBH98. No need to prove the validity of the relationship out-of-sample. All you need is one magic statistic – the RE statistic.
The trouble with the RE statistic, as we observed long ago, is that, meritorious or not, it’s not used in conventional statistics and little is known about its properties. In MM2005 (GRL) we showed that you could get high RE statistics using Mannian methodology on red noise. However, the problem with the RE statistic can be illustrated far more easily than occurred to us at the time. As noted on CA, I checked RE statistics for “reconstructions” using two of the most famous examples of spurious regression in econometrics: 1) Yule (1926) which shows a relationship between mortality and proportion of Church of England marriages; 2) Hendry (1980) which shows a relationship between cumulative U.K. rainfall and inflation). Both classic spurious regressions yield extremely high RE statistics – even higher than MBH98.
So although Mann characterizes the RE test as “rigorous”, it isn’t. It will fail with virtually any spurious regression (between co-trending unrelated series.) I’m not saying that the RE test shouldn’t be run: I see no harm in using this test, but it’s only one test and is not in itself anywhere near sufficient to constitute verification of a supposed relationship between proxies and temperature. For Mann, Wahl and Ammann or Tamino to argue that passing an RE test is some sort of accomplishment merely sounds goofy to anyone familiar with Yule 1926 or Hendry 1980. You’d think that third party climate scientists would catch onto this by now.
I don’t think that anything useful can be shown by more and more calculations on the MBH network. At this point, the only relevant testing is the out-of-sample re-sampling, showing that the supposed “relationships between proxies and temperature” can be confirmed. Available information on MBH proxies has not verified these relationships.
Anything Else?
Is there anything else that remotely constitutes verification of MBH? I’d be happy to consider and respond to any suggestions or inquiries.
In the above discussion, I haven’t talked about principal components very much and there’s a reason for that. In our articles, we observed that the Mannian pseudo-PC methodology was severely biased towards picking out HS-shaped series. In the critical NOAMER network, the relationship between the difference in 20th century mean and PC1 weighting is so strong that the MBH PC1 could be described as follows:
Construct the following linear combination of chronologies: assign a weight to each chronology equal to the difference between the 20th century mean and overall mean (with negative weights assigned to negative differences.)
This methodology will regularly deliver HS shaped series from red noise. Mannian pseudo-PC methodology is a poor methodology in that its efforts to locate a HS shape interfere with the operation of the PC algorithm. If there is a very strong “signal” or if the true signal actually is HS-shaped, then the poor methodology doesn’t matter much relative to conventional PC methodology. In the practical situation of the NOAMER network, the net result of the flawed methodology was to deliver a high weight to bristlecones.
If the bristlecones are magic trees, then the methodology might be flawed, but, at the end of the day, that wouldn’t “matter”.
If (1) bristlecones are not magic trees and/or the Graybill chronologies have sort of “instrumental drift” resulting in a spurious regression relationship to world temperature, (2) the Mannian pseudo-PC methodology is flawed and (3) there is some other methodology that avoids the grossest flaws of the Mannian pseudo-PC methodology, but is still inadequate to detect a spurious regression against the Graybill methodologies, then, in a bizarro-world, bizarro-scientists might argue that the flawed methodology didn’t “matter” because they were going to do the calculation incorrectly anyway. Leading bizarro-scientists would perhaps go futher, arguing, in addition that the fact that they could go on to make completely different errors meant that criticisms of the original errors were “wrong”.
At the end of the day, the issue, as the NAS panel realized, is about proxies and verification statistics. That doesn’t mean that the criticisms of the PC methodology are incorrect; they aren’t. Just that the PC issues could be coopered up without settling the key issues on proxies and verification.
Preisendorfer described PC methodology as “exploratory” and this is precisely how we (but not Mann) applied PC methodology. Mannian pseudo-PC methodology identified the most HS-shaped series quite effectively. We used this to explore the NOAMER network and found that its selections were not random – it picked out the Graybill bristlecones. The scientific issue is then whether these are valid proxies – and this is an issue that is not settled by Rule N, but one that requires scientific evidence. And in all the discussion to date, Mann et al have produced no such evidence.
So did the PC error “matter”? Well, it probably mattered in a different way than people think.
Consider what would have happened had MBH had not used an erroneous PC methodology. Let’s suppose that they used a centered PC calculation together Preisendorfer’s Rule N. So that they retained 5 PCs in the AD1400, including the bristlecones, and everything reconciled the first time. What would have happened? In 2003, I’d probably have more or less replicated their results and thought no more about it. I would probably not have peered beneath surface inquiring about the PC4 and bristlecones. verification r2 statistics and so on. I’d be making a handsome living in speculative mining stocks.
I followed the magic flute instead.


54 Comments
Great post and re-post Steve. Thanks. Too bad those who do not want to understand cannot digest the facts and instead continue the sheep routine at the unreal sites.
Well Steve, your following of the Magic Flute is appropriate as according to Wikipedia: “The Magic Flute has always been one of the most beloved works in the operatic repertoire, and is presently the eighth most frequently performed opera in North America.[4]”
Also don’t lose fact that in Premiere cast, 30 September 1791 the role of lead tenor singer was called Tamino.
How on earth did Wahl and Ammann explain Table 1S? How can they maintain their position given the results?
“Although we find Pearson’s r and CE not germane to use in this paper for decision-making purposes – for the reasons described above and in Appendix 1, we include the values of these measures in Tables 1S and 2S for all the scenarios we examine so that they are available to the community.”
Obviously, they mean something else by the “verification” than R^2 tests etc. They mean that a panel of old shamans – those who haven’t previously be eliminated as deniers – nods to the idea that the MBH results have to be valid.
They also visit S. Schneider, rest in peace PBUH, and if even SHS raises no complaints from the hell, the statement becomes verified by the scientific consensus. Whoever disagrees with it is added to the deniers and won’t participate in the next round of … verification.
More seriously, those people obviously don’t understand – or don’t want to understand – what individual principal components may mean and what they don’t mean. Choosing any non-first component and claiming that it is a reconstruction of anything is just silly.
The m-th PC is always more important than the n-th PCs for all “n” greater than “m”, and if one doesn’t have a rational reason to “interpret the more initial PCs away”, and to give them a different interpretation that also explains why they (or some linear combination of them) shouldn’t be the looked-for reconstruction, then he simply can’t say that the following PC is “the” reality or “the” right reconstruction.
To argue that it is the right reconstruction, one actually has to use rational statistical tests designed for the purpose.
Finally, again, it’s just too bad if someone still hasn’t understood – after a decade of these discussions – why the hockey stick methodology has been mining for the hockey sticks.
And it’s even worse for science if he has understood but he deliberately tries to obfuscate his understanding. In both cases, there can clearly be no continuing rational communication because the communication is stuck at an elementary point that makes it very clear that one side of this dispute is 100% incompetent to discuss anything based on statistical arguments – i.e. pretty much anything in science.
The 100% incompetent side is Tamino et al.
From “A Note on the Use of Principal Components in Regression”, Ian T. Jolliffe 1982:
“Along with the use of principal component regression there appears to have been a growth in the misconception that the principal components with small eigenvalues will rarely be of any use in a regression. The purpose of this note is to demonstrate that these components can be as important as those with large variance.”
Caveat: While I did take statistics at the Uni as part of my EE studies, I’ve never felt especially proficient at it.
“Some Cautionary Notes on the Use of Principal Components Regression”
Journal article by Ali S. Hadi, Robert F. Ling; The American Statistician, Vol. 52, 1998 (http://www.questia.com/googleScholar.qst?docId=5001333495):
“We also illustrate by theory and example that it is possible for the PCR to fail miserably in the sense that when the response variable is regressed on all of the p principal components (PCs), the first (p – 1) PCs contribute nothing toward the reduction of the residual sum of squares, yet the last PC alone (the one that is always discarded according to PCR methodology) contributes everything.”
My understanding of this is that Steve is correct in using PCA as an exploratory method, while strongly cautioning against viewing the results as definite proof of anything – even if the residuals would happen to be impressive! Also, the above sentence seems to argue implicitly against mining less significant PCs in order to beef up the correlation. But again, pls note the caveat on top. I welcome the chance to be educated on this.
Steve: I urge people to spend less time worrying about PCA and more time worrying about whether strip bark bulges meet the criteria of a statistical model.
Steve, as far as the strip barks are concerned, I view your double-sampling of a single tree as existence proof that there are clear problems with such chronologies. One question then is whether existing series have enough samples to still have limited usefulness, or whether they should be discarded entirely? It seems as if some controlled studies with multiple samples from each tree would be needed to even begin to resurrect them.
Dear Steve,
you have convinced me as much as you have convinced yourself that strip bark chronologies are unlikely to produce the relevant information. Even a priori, they don’t look too sensible.
But I would warn against such fast conclusions. Any method to get some information from the distant past is bound to look bizarre or “manifestly” wrong at some level – and for “special” reasons, individual examples how to use the methods may fail. However, some of the methods may turn out to work.
I don’t understand why the PCA became a taboo on the Climate Audit. This is a major argument that the proponents of such methods consider to give the weight to the analyses which is why people should know whether various statements about it are right or wrong.
In particular, I am convinced that the Joliffe statement above is just noise. Of course that sometimes, under some special circumstances, the highly subdominant PCs may be as important as the dominant ones. But the very meaning of the eigenvalues is to separate those that are more important from the others. So the generic situation is that the subleading ones may only be important for a problem if all the previous ones and their linear combinations are shown to be unimportant for the problem.
A reference to authority – and Joliffe would not necessarily be an important one – can’t change this fact of linear algebra.
Best wishes,
Lubos
The personal go at Schneider seems against policy?
Don’t forget to cite Schikaneder91 on esoteric dendrology; yes, everyone’s heard of it, but not everyone will recall the detailed discussion of field methods (English translation provided).
I am going to be a pedant about “verification” but as Steve and Lubos put it in quotes they probably has reason to think Tamino’s use of the word is wrong too. He probably means “validation”.
The root of verify is “truth”, so can only be applied to those things that can be proven true, of which a calibration or testing procedure on a proxy is not one.
The root of valid is “strong”, and so can apply to a calibration of some procedure that might strengthen a belief in a proxy for a specific purpose.
Tamino then makes it worse with the phrase “passing verification” which presumes there is some benchmark for a proxy to be included. But the test is applied to the whole reconstruction, so that 99% of the proxies could fail and 1% pass, and still the whole thing could pass. So if you put a whole heap of questionable ingredients in a recipe and it resembles temperature in the last 100 years that “passes for truth” is I think what he is saying. Do that 100 times and its “robust”.
Steve, Brilliant! In related news, Paul Krugman has a stunningly ignorant op ed in today’s New York Times, which reminded me why your work is so important. Keep it up!
Is the origin of the “magic” bcp Lamb’s “Climate, Present, Past, and Future: Climatic History and the Future” p. 220-221 and fig. 13.61 where Lamb compares the “remarkable” correlation of bcp ring width series of LaMarche from 800-1960 AD with his own CET?
Maybe this is OT, but I was wondering, along with the divergence problem for some tree rings, if there were other “anomalies” like it in climate or weather in the early ’60s. WUWT posted a column a few days ago about solar impacts on rivers and lakes (http://wattsupwiththat.com/2010/07/22/solar-to-river-flow-and-lake-level-correlations/), and the Lake Victoria water level rose anomalously fast from 62-64. It would be interesting to find out if there were more events like this and if they were connected somehow.
So it would appear that Gavin has thrown down a gauntlet of sorts…Saying the following:
” No-one wants reconstructions that don’t have statistical skill. That’s why there are always verification data held back, and checks against the removal of specific proxies or classes of proxies. It just so happens that all of the reconstructions that pass these tests (though with skill that decreases in back in time) show hockey stick like features. The difference between the scientists working on this and McIntyre is that the scientists are actually interested in what the past climate was like and why. McIntyre seems interested only in criticising decisions made in those analyses without ever proposing any constructive alternatives and demonising anyone who makes an effort.”
[and in response to a question about ditching older versions of temperature reconstructions, and just going with more statistically robust ones]
“Sure – things have moved on a lot from MBH98 – both in terms of data and in terms of methodology.”
[and in response to a statement about the circular ‘climate audits’ regarding Mann’s published reconstructions…]
“…and yet the points never rise to anything constructive, never address anything other than the 1400-1450 ad step in mbh98, never look at the larger data sets now available, and almost always mistakenly assume that this has some terribly important consequence that the world must be made aware of.”
…So, it seems to me that there’s a willingness on Gavin’s part to concede non-statistical robustness on early versions of temperature reconstruction (MBH98, etc.), but is also looking for acknowledgement that all temperature reconstruction roads lead to at least some variation of the same ‘hockey stick’. If not, then he’s looking for the following (and assumed that you haven’t provided it):
1. Your own posted temperature reconstruction that satisfies as many (or more) degrees of statistical robustness as possible. (using whatever data is available)
or
2. ‘Corrections’ to the already existing reconstructions as you see fit, and what they would then show.
or
3. “some terribly important consequence that the world must be made aware of.” (admittedly if this option was chosen, perhaps it’s the easy route, because it’s more subjective.)
So what do you say…?
Steve: Gavin’s comments on reconstructions are very unreliable. While there are more reconstructions now, they continue to rely on strip bark chronologies and Yamal – in the case of strip bark chronologies, they have done so disregarding explicit recommendations of the NAS panel. New chronologies (e.g. Ababneh’s Sheep Mt, the Polar Urals update) have been ignored where they are inconsistent with chronologies used in Hockey Stick results. Any progress in this field requires reconciliation of regional inconsistencies – something that I’ve long recommended to specialists. Nor has there been any provable ‘advance” in methods. Most reconstructions use small subsets in a way that dates back prior to MBH98 (e.g. Bradley and JOnes 1993). Nor do I believe that RegEM is an advance on previous methods. It is not a well-established statistical method about which much is known. Nor does it solve problems like contaminated Tiljander sediments. I don’t see any particular validity to it as a method, but it’s very idiosyncraticness makes it a long job to analyse. I do not regard it as progress.
It is not and never has been Steve’s purpose to propose alternate temperature reconstructions for the Team. His purpose is to check their calculations. He has demonstrated over and over, for many years now, that their work is wrong. It is their job to do it right.
Your note reminds me of the story in which a reader wrote to Bill Buckley with instructions to cancel his subscription to National Review. Buckley wrote him back: “Cancel your own goddamn subscription!”
Gavin is totally unreliable when it comes to talking about reconstructions. He doesn’t know the details and is committed to defending his friends without taking care to ensure that his information is reliable.
I’ve explained on many occasions why I haven’t purported to do my own reconstruction – the data that is supposed to be “proxy” data is too inconsistent as it stands to permit reconstructions with usable confidence limits. In order for the field to progress, it has long been my opinion that practitioners need to confront the inconsistencies that bedevil even local data e.g. the differences between Polar Urals and Yamal. Contrary to Briffa’s disinformation, I don’t advocate Polar Urals rather than Yamal – I simply observe that the chronologies are inconsistent in their medieval-modern information and until that is explained, it’s impossible to progress.
Similarly with inconsistency between Constance Brown’s results and Mann’s bristlecones. Or between Ababneh’s Sheep Mt and Graybill’s. I urged that IPCC address these inconsistencies but Briffa refused to even cite Brown or Naurzbaev articles.
Nor has the field “progressed” in a relevant way. Old proxies that have been data snooped continue in use e.g. Graybill bristlecones, Yamal. CPI on small data sets is not an “advance” in methodology; it is a reversion to pre-1998 methods. Nor is it all evident that RegEM is an “advance”. It is more complicated, but it is not a method known in general statistics; it’s properties are not well understood, least of all by its proponents. Nor can it cope with problems of contaminated data sets like Tiljander sediments. My own take on proxies is that any signal in consistent data can be recovered with simple methodologies, there is no need for things like RegEM and that any signal that requires RegEM or its equivalent to extract will not represent a statistically supportable result when eventually analysed.
Nor is the debate served by the endless mischaracterization and disinformation by the Team on each and every issue. As a start, they should begin by accurately quoting their critics.
@Steve: You should probably get in touch by e-mail with Valerie Masson-Delmotte (lead author for ar5 paleo).
I know she also wants to work on better regional-scale reconstructions & physical understanding of the proxies and that she appreciates the audit work you’ve been doing.
Really ? This seems good news 🙂
If this actually happens, I’ll recalibrate my cynicism
Re: Steve McIntyre (Jul 26 08:55),
In my opinion, Steve McIntyre’s perspective is supported by an examination of the use of the Tiljander sediments in the recent and prominent paleotemperature reconstruction Mann08 (this paper is cited approvingly by Tamino in his review of Montford’s book at RC).
The underlying issue is easy to grasp: from the 18th Century to the present, these lakebed sediments have been progressively contaminated by nearby farming and roadbuilding activities. Since calibration of proxy series to the 1850-1995 instrumental record is an essential step in Mann08’s methods, the Tiljander data series must obviously be excluded from the analysis.
Without meaningfully contesting this simple narrative, AGW Consensus scientists and blogger-advocates continue defending the choice of Mann08’s authors to employ the Tiljander proxies in their reconstructions. These defenses can be seen in this informative ongoing thread at blogger Arthur Smith’s website.
Endorsing Mann08’s practice is akin to defending a bank that charges interest on a customer’s savings account, rather than paying it out (post).
Some people think that if you use fancier methods your results must be better. There is a disconnect from the basics (from “reality” as it were). If it is known that bristlecones have bizarre growth patterns, a simple person would see that you can’t use them, but a fancy person thinks their sausage maker can use any ingredient and “fix” the problem.
Craig:
I suspect that if another proxy emerged with a distinct HS characteristic, they could let the BCPs go!
Slightly OT, I would be interested in your take on the influence of Fritts on the dendro field. I was a bit surprised when Gavin cited his work as justifying Mann’s statistical approach. His general kitchen sink approach looks more suited for data exploration than for formal predictive model building.
Fritts carefully notes the potential nonlinear response of trees (not just curved, but upside down parabola). In the applications Fritts considered, this was a caution but not a killer, because 1) in 1976 most people were going back only a few hundred years and 2) often the goal of dendro work was DATING to establish a local chronology and finding unique events like a big drought. I don’t think Fritts said anything about an RE statistic, but I don not have his book.
Sounds a lot like the NOAA’s response to Watts’ revelation showing that ~90% of their stations flunk basic standards. They say that their magic sausage maker turns garbage data into gold.
Even better than Rumpelstiltskin.
I continue to wonder how and why NASA continue to allow RC and Gavin to be such a major part of their public image, to say nothing of the tarnish deposited on any “real” scientists employed by NASA. I suppose jobs are scarce for denialists.
Salamano@8:16 am
I’m sure Steve will correct me if I’m wrong.
I haven’t noticed Steve pretending that he can predict what the climate will be like in 10, 20, 50, 100 years time.
And I’ve also never noticed that anyone is proposing to spend Trillions of Dollars / Pounds based on Steve’s work.
That’s what it comes down to, isn’t it? If Mann et al. had simply cobbled together all the proxies available and presented their result as a proposed reconstruction of paleo-temperature, the validity of the reconstruction and the methods used to make it would be the subject of everyday debate, and the generally low opinion of statisticians for the work would perhaps have prompted the field to move to correct the deficiencies.
But it’s clear that correcting the deficiencies is not in the cards. Instead, a great deal of effort goes into defending the current reconstructions as “good enough”.
Good enough for what?
Taking a random walk
Can’t help asking myself
Where’s the Unit Root?
Okay, so if the goal is understanding what the climate (temperature) history of the Earth is … what then can be done?
If every proxy cannot be shown to exhibit any statistically reliable temperature reconstruction, then what are we left with? Confusion that grants no conclusions? Tail-chasing? It, therefore could seem equally likely and unlikely statistically that the temperatures reliably measured over the last 150 years (which all show warming) is the warmest in the last 1000 years…and further, in the case of warmest, there would need to be some explaination as to why, whether it be normal climate variability or anthroprogenic forcing.
It seems to me if someone was to make the case of natural climate variability, they’d have to supply their own temperature reconstruction, to the same statistical robustness indicated here, rather than to simply declare all temperature reconstructions as not good enough (because then it would mean that either conjecture about temperature history is equally valid).
The burden of proof would be on both camps to supply a robust reconstruction or two that withstands scrutiny. Simply peddling uncertainty (which is a disphemism for correctly identifying all manner of statistical issues with others’ work) is not going to do enough to take the train off one track, and put it on another (instead, it would seem to just stop a train in its track). Unless, there is work being done to generate a more reliable reconstruction, or somehow going back to the sources of already used data that’s deemed insufficiently reliable statistically, and ‘get more of it’ or otherwise make it more reliable.
Does this mean that Anthony Watts’s crew should go global, and core up every tree-line, bringing back data to be analyzed?
Well I’m just an atmospheric chemist by training so what do I know about ‘climate science’, but it seems to me that doing the work that can be done with statistical methods that are generally agreed to be ‘correct’ rather than flaky, describing the methods used in detail so that others can follow the arguments and criticise where needed woudl be A Good Thing. Letting other people see your data as required by the Law and academic convention would be another Good Thing.
And doing the sums without basic arithmetic errors would be A Great Leap Forward.
But while the current High Priests of AGW remain temporarily in post, these simple reversions to O level science methods from today’s fantasy lands are unlikely to take place.
You’ll just have to stop using the word ‘unprecedented’ when the climate comes to a warm bit.
There is an asymmetry is science. If you did it wrong, it is wrong, and not up to the critic to do it right. It may in fact be impossible to use tree rings to reconstruct past climate (see Loehle, C. 2009. A Mathematical Analysis of the Divergence Problem in Dendroclimatology. Climatic Change 94:233-245). But there are more problems even if you do try to create your own reconstruction:
1) Those holding existing data won’t share it in many cases.
2) Guess who already has all the grant money?
3) If you do a reconstruction using what you think is a better method and you are not an authorized Team member, you get vilified — just ask me. (Loehle, C. 2007. A 2000 Year Global Temperature Reconstruction based on Non-Treering Proxy Data. Energy & Environment 18:1049-1058; Loehle, C. and Hu McCulloch. 2008. Correction to: A 2000 Year Global Temperature Reconstruction based on Non-Treering Proxy Data. Energy & Environment 19:93-100)
If tree-rings proxies can not be used to reconstruct temperature data, then what do we have left? Ice cores? Varves?
What do we say then if every proxy attempt has at least some sort of issue that mitigates its statistical robustness? Shall we just declare that it’s impossible to be certain whether the present warming is anthropogenically out-of-character with natural climate variability, because it would therefore be just as plausible to say we’re equally confident that it is indeed out-of-character, no?
If there is indeed some possible dire rammifaction of a possible man-made climate change, could/should we just call off the dogs because of uncertainty?
If not, in what direction can we proceed if the goal is to understand the present warming in light of the last 1000-2000 years?
There are at least a dozen other proxies: foram mineral composition, varves, cave deposits, carbon and Be isotopes (indicators of solar activity), ice cores….
If the answer is “more study is needed” then that is the answer, whether we need an answer or not.
If we don’t actually need an answer, then I’m happy for you to go and study it.
But on your dime, not mine.
So there aren’t, as of yet, any reconstructions that have made it through this gauntlet of statistical confidence, using these proxies or not? (I’m hoping someone is working on one)
…Because if there are none, we’re still left with ‘maybe yes, maybe no’, with no one group really able to declare another’s conclusions (or conjecture) as definitely wrong…only their methods.
And, unfortunately, it seems there’s only one group putting out reconstructions, and one group pointing out their statistical incogruities.
Craig, Finding a reliable temperature proxy is a goal we all seek. The task, as you have written, is not to demolish the present set of proxies, but to improve them where possible.
One step in this improvement is critical. In the calibration step, the temperatures have to be correct. Small changes in trend can swing earlier proxy reconstructions rather wildly and lead to even larger error bars as we go back in time.
I have arrived at the stage where I cannot trust any of the touted instrumented period “adjusted” temperature sets and so it would be morally pointless for me to embark on a new proxy calibration. There are far too many climate records that show no change at all in the past 100 years, within plausible confidence limits.
Do you and others have similar unease about the adjusted record?
Yes. Please note that when I did my reconstruction I wished to show that leaving tree rings out leads to a very different picture. I did not claim my result was precise or reliable because the data going into it are neither.
Craig Loehle said: “There are at least a dozen other proxies … If the answer is “more study is needed” then that is the answer, whether we need an answer or not”.
This is a good line. I would add that the answer must also include that “more time is needed” to properly validate all these proxies. For example, occlusion time in many places in Antarctica is estimated as up to 4000 years. Therefore, you need to continue collecting environmental instrumental detailed records for at least 4000 years to get few bubbles that you can compare with today’s CO2/temperature records. It does not matter how hard one wish to get “an answer”, and no matter how hard climatards are trying to make sense out of scarce bits of data that we have now. For some other places one can probably get a somewhat quicker answer, but still it must take climatological time scales.
snip – overeditorializing into policy
The place to go is a repository of peer-reviewed localized reconstructions to be found at http://www.co2science.org/data/mwp/description.php
It main contain some bias, but overwhelmingly around 180 studies from around the world point to a medieval warm period that was at least as warm as today, and much greater variability in climate that the hockey stick graph. The charts show the general pattern.
The work is then in putting these together. This was the novel approach where MBH98 could have added to the science.
For those who say that it the above project is incomplete, could start a competing one. Maybe include a members only part with a repository of the data.
Funding sources don’t like to pay for work which shows that something everyone thought was a hot idea isn’t.
Having worked on a study in 1964-65 which pretty conclusively proved that something the client very much wanted to do, wouldn’t work and having seen the anxiety of the PI, it’s nor hard to understand the drive to “make it work” at any cost.
Steve, ever have any luck contacting Ababneh? Or is she still in hiding?
What we seem to observe in the field of climate science these days is a highly curious collection of conflicting conundrums.
Perhaps the conflicts could be resolved, and the conundrums explained, through skillful employment of a highly robust climate signal processing algorithm.
For example:
The instrumental record appears to show that global mean temperature has increased since 1960.
Other the other hand, certain tree ring temperature proxies used in the MBH reconstructions indicate that global mean temperature has decreased since 1960.
Is the instrumental record right, and the tree ring proxies wrong?
Or are the tree ring proxies right, and the instrumental record wrong?
OY VEY!!!
WHAT TO DO???
Here is the solution: our climate signal processing algorithm shall dictate that the sign of the trend doesn’t matter.
March of this year from Open Mind:
Tamino (or anyone else who cares to comment): what do you make of this chronicle of the Mann vs. McIntyre story?
[edit]
[Response: I’ll give it all the attention it deserves.]
The edit was a link to Caspar and the Jesus Paper.
Seems to me that Tamino is singularly ill-named. Tamino was supposed to know when to shut up.
Tamino and Gavin are more accurately cast as Monostatos and the Queen of the Night. I’ll leave it to readers to decide which is which.
The simple fact of the matter is that if tree ring phrenology was real, we could extract the warming “signal” consistently from thousands and tens of thousands, and probably millions of trees around the globe. We cannot. The number of true signal bearing trees identified to date is barely into double figures.
Their growth patterns are random noise until a climate scientist discovers them and gives them the “correct” weight.
A vintage post Steve, thanks.
Would it be possible to stop prefacing the contents of the CRU archive with the word(s) “notorious” or “now notorious” please? I dont it does you any favours and they insert a degree of emotiveness that is just unnecessary. Who says they’re notorious? Generally the people who accept they’re evidence of some pretty rotten behaviour. Most other people probably wouldnt accept that descriptor and I think ultimately there’s a danger of the CRU archive losing any impact that it might have because of breathless descriptions like this.
Keep up the rest of the excellent work – your articles are fascinating….
Richard All, Perth, Western Australia
Richard
Being from Queensland, the only other State in Australia known for a sense of fair play and balance,I have to agree with you in regard to “emotiveness”. Inthe same spirit why should the CRU archive have any “impact”? Does it stand alone? If so, it has been tarnished. If not, why is it important?
Richard, though I agree that the “notorious” prefix is unnecessary, I do nevertheless feel that the descriptor is fair and accurate. These emails have achieved notoriety and, while they may for a time have enjoyed academic fame, many of their authors will ultimately – and in a far wider context – live on in infamy. But yes, I agree the “adverbosity” is unnecessary.
Isn’t it funny how we’ve come to anticipate between little and no editorialising from Steve McIntyre and yet have long fallen silent on demanding the same restraint from the RealClimate gang. The adjective count may be a poor proxy for quality of substance, but our reaction to a high count is an excellent proxy for our expectation of content integrity.
Re … Craig Loehle (Jul 27 03:49),
Craig Loehle says, “Yes. Please note that when I did my reconstruction I wished to show that leaving tree rings out leads to a very different picture. I did not claim my result was precise or reliable because the data going into it are neither.”
In the nuclear industry, we have a widely-used tool for assessing the quality and reliability of a component item or a document deliverable, the Quality Assurance Checklist.
Because we are doing things with nuclear-quality rigor and discipline, we have quality assurance checklists for everything under the sun. If I had $1000 for every check-off item on all our various QA checklists, I could afford to build my own nuclear reactor.
Now, the AGW partisans tell me in no uncertain terms that Mann’s hockey stick is universally accepted as confirmed fact within the climate science community; and furthermore, that Mann’s past work on the hockey stick meets all generally-accepted standards for rigor and professionalism in the pursuit of scientific research.
They are particularly vocal when it comes to disputes concerning the Medievel Warm Period, saying that the MWP, if it existed at all, occurred only in a limited number of locations in the Northern Hemisphere.
They say, “If you don’t like Mann’s prior work, then go do your own temperature reconstruction and get it properly peer reviewed by the climate science community.”
What they are really saying is this: In their humble opinion, the Mann hockey stick will not be deposed from its status as the generally-accepted temperature record for the last 2,000 years unless some major new study, one conducted by people with recognized stature in the climate science community, comes to a different conclusion.
Well … Along comes the Loehle-McCulloch temperature reconstruction (2007/2008) which indicates the existence of a well-defined worldwide Medievel Warm Period.
How should an interested and informed observer go about evaluating the Loehle-McCulloch reconstruction, and the approach it uses to reach its conclusions, in comparison with the Mann hockey stick, given that the Loehle-McCulloch team currently has no stature whatsoever within the mainstream climate science community?
Nuclear person that I am, I would like to see a formalized comparison of the two reconstructions performed, using a tool which is essentially a quality assurance checklist.
The “Temperature Reconstruction QA Checklist” would directly compare the two reconstructions, side by side, using a structured topical outline as follows:
TEMPERATURE RECONSTRUCTION QUALITY ASSURANCE CHECKLIST
A) Temperature Reconstruction Process Flow Sheet:
— A process flow sheet referenced by other parts of the QA Checklist which describes, in general terms, each set of steps in the reconstruction and their sequence.
B) Calibration Period Data Sets:
— Enumerated list and description of the calibration period data sets.
— Reference index as to where each calibration period data set is employed within the reconstruction.
— Provenance and availability of each calibration data set; adequacy of document archives.
— An assessment of the quality and reliability of the calibration period data sets, individually and as a whole.
— An assessment of the adequacy of coverage of the calibration period data sets, individually and as a whole.
C) Proxy Data Sets:
— Enumerated list and description of each proxy data set.
— Reference index as to where each proxy data set is employed within the reconstruction.
— Provenance and availability of each proxy data set; adequacy of document archives.
— An assessment of the quality and reliability of the proxy data sets, individually and as a whole.
— An assessment of the adequacy of coverage of the proxy data sets, individually and as a whole.
D) Calibration Period, Process and Methods:
— Enumerated list and description of each calibration method and/or technique.
— Reference index as to where each calibration method or technique is employed within the reconstruction.
— Provenance and availability of each calibration method or technique; adequacy of document archives.
— An assessment of the quality and reliability of calibration process methods and techniques (Process V&V).
— An assessment of the applicability of calibration methods to the specific data sets being employed, both individually and as a whole.
E) Proxy Analysis, Process and Methods:
— Enumerated list and description of each proxy analysis method and/or technique.
— Reference index as to where each proxy analysis method or technique is employed within the reconstruction.
— Provenance and availability of each proxy analysis method or technique; adequacy of document archives.
— An assessment of the quality and reliability of proxy analysis methods and techniques, both individually and as a whole (Process V&V).
— An assessment of the applicability of proxy analysis methods to the specific data sets employed, both individually and as a whole.
F) Appropriate Application of Analytical Tools:
— Enumerated list and description of each analytical tool.
— Reference index as to where each analytical tool is employed within the reconstruction.
— Provenance and availability of each analytical tool; adequacy of document archives.
— An assessment of the quality and reliability of the analytical tools, both individually and as a whole.
— An assessment of the applicability of the analytical tools to the data sets being employed, both individually and as a whole.
This QA checklist would be just the ticket for promoting an organized and objective approach to determining the quality and reliability of the two competing temperature reconstructions — for those who care about such things, anyway.
Re: Scott Brim (Jul 28 20:58),
To Scott
TEMPERATURE RECONSTRUCTION QUALITY ASSURANCE CHECKLIST
Congratulations on this set of crystal clear and logical series of statements.
While it would be a considerable undertaking to complete your comparison process, and require a very large knowledge base (which sadly I lack in some of the fields involved), I sincerely hope somebody can do it. The results would be invaluable and my guess highly publishable in a main stream journal, WHATEVER THE FINDINGS.
Even if the “climate community” editors didn’t like its findings, and therefore closed ranks against publishing, a version on Climate Audit would attract enormous attention.
Thank you !
Iain
Re: Iain McQueen (Jul 29 06:46),
Even within the common definition of what the term “science” means as a working philosophy, there are elements of the philosophy that may be interpreted differently depending upon the working context, or at least to be given greater or lesser emphasis depending on the field of study or the type of work being performed — basic research versus product engineering, for example.
As used in the nuclear industry, the term “science” is somewhat equivalent to the phrase “process rigor and discipline, end to end.”
When we draft a new QA checklist such as the one shown above, the initial version is reviewed both by the QA auditors and by the potential future auditees in the line organizations. Many times after a review of the initial draft, the checklist is expanded to cover a finer level of detail or to add new sections. One candidate for addition to the Temperature Reconstruction QA Checklist shown above might be a QA Evaluation Summary/Conclusion section.
In the nuclear industry, when a QA checklist indicates that one or more deficiencies exist for the particular component or the particular document being evaluated, final acceptance of the component or document is held up until all the deficiencies are corrected. That means all of the deficiencies, without exception, because the spec is the spec, period.
However, in performing scientific research, some deficiencies are systematic in nature and are not correctable, per se. This does not mean that such deficiencies should be ignored in coming to some final conclusion as to the overall quality and reliability of the research product.
It means that a thorough and objective look must be taken at the research work that was done, and at how it was done, before the work can be accepted and relied upon as the foundational basis of other follow-on work efforts — including the addition of such caveats as may apply in performing subsequent work which uses the research product as a basis.
The above QA checklist provides a rigorous, structured, and objective approach to making such an objective evaluation.
Re: Scott Brim (Jul 29 11:41),
To Scott Brim, and I quote you:
It is difficult to produce a more succinct delineation of what actual advancement of comprehension and eventual understanding of a matter comprises than your words, especially in what has become such a contententious and regrettably politically and economically loaded situation as this. This is exactly what “science” is, should be, and will in the end be, and acheive.
The present political position has been adopted before the scientific basis or “knowledge” was present, and is now (albeit slightly shakily for the moment, post Climategate and IPCC debacles, ) being uneasily continued . But there we are – politicians have been swayed. A consensus was pronounced. Just as group think occurred with the hockey team, so it occurred with the politicians, of almost all colours.
Sadly the matter is in the hands of the politicians, and thus bureaucracy (as evidenced by recent whitewashes) and importantly the concommittant media. With time and continued pressure from logic and “science” , the politicians will shift, and the rest follows. That it is the hands of politicians means that time must pass. They do shift, but slowly.
As you rightly observe there are wide nuances to the interpretation of the meaning when the public use the word “science”.
3 Trackbacks
Fantastic deconstruction of a hockey stick supporter…
It is a long, but worthwhile read….
[…] Re-post of “Tamino and the Magic Flute” Tamino’s realclimate post re-states points that I’ve discussed at length in the past. Here is a re-posting […] […]
[…] Team still have something worthwhile to say, should start with Steve McIntyres repost of “Tamino and the Magic Flute“. Compare that with Tamino’s posting “The Montford […]