Does it matter whether proxies are used upside-down or not?
Maybe not in Mann-world (where, in response to our criticism at PNAS, Mann claimed that it was impossible for him to use series upside-down). But, unlike Mann, Darrell Kaufman acknowledges responsibility for using proxies upside-up. Unfortunately, he and the PAGES2K authors don’t seem to be very diligent in ensuring that they do so.
Shortly after release of PAGES2K, I observed that they used both Hvitarvatn and Quelccaya upside-down (the latter on Neukom’s watch.) I also observed that correct orientation of Hvitarvatn ought to have a knock-on impact on Big Round Lake, which matched Hvitarvatn about as closely as two distinct proxies could be expected. Thus far, Kaufman’s already corrected upside-down Hvitarvatn: Big Round Lake should be in play as well. This inconsistency is something that ought to have been “assessed” in an assessment report, but wasn’t.
In a previous post earlier today, I questioned whether PAGES2K ought to have inverted the orientation of the Okshola speleothem O18 series since the Holocene trend (as inverted) is now opposite to the Holocene trend of the high-quality Renland ice core O18 series. The Okshola series is the only speleothem O18 series in the PAGES2K network: on other occasions, I’ve questioned the appropriateness of using “singleton” proxies in an assessment report. The fact that serious questions can arise over even the orientation of a series is eloquent support for this policy.
In the present post, I’m going to look at another singleton O18 series in PAGES2K – the single ocean sediment O18 series in the network (P1003), where once again, I seriously question whether PAGES2K have used the series in the correct orientation.
In the diagram below, I’ve shown O18 values (inverted) of sediments from an Arctic ocean core, showing the contrast between the LGM and the Holocene Optimum: this is a loud contrast which ought to show which way is up. While ice core O18 series have more negative values in glacial periods, the opposite happens with ocean sediment O18: O18 values in Arctic ocean sediments became less positive (from ~4 to ~3 %%). This is true over dozens of cores. The reason is logical enough: the continental glaciers in ice ages contain ice with depleted O18 values and this results in the oceans being less depleted in O18.

Figure 1. Top panel – O18 for PS1243-1 (from pangaea.de). Bottom panel – long version P1003 from Sundqvist et al 2014 archive. (I haven’t seen a technical publication.)
In the next figure, I’ve shown the two-millennium section of P1003 used by PAGES2K in two mirror orientations. In the top panel, I’ve shown the series in PAGES2K uninverted orientation, while in the bottom panel, I’ve shown the series in the inverted orientation that is consistent with the observed relationship between values in the LGM and Holocene Optimum.
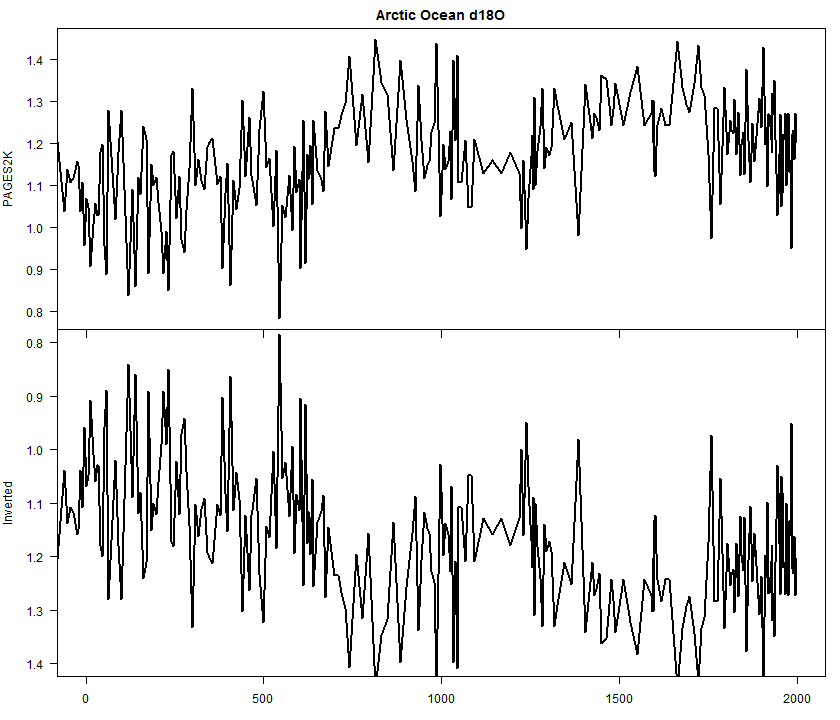
Figure 2. P1003 O18 series (PAGES2K) version. top – in PAGES2K orientation; bottom – inverse orientation to match LGM-Holocene Optimum orientation.
Had the series been oriented to show elevated O18 values to show elevated values in glacial periods, it would also have resulted in a Little Ice Age being colder than both the medieval warm period and the modern warm period – a phenomenon that is not disputed even by the Team for the Arctic, and a somewhat declining trend through the two most recent millennia, reducing the inconsistency of this proxy with other series. As a clincher, Kristensen et al 2004 (Paleooceanography), a technical publication of P1-003MC, used the orientation shown in the bottom panel – opposite to PAGES2K as shown in the excerpt shown below (the scale is different, but if you look closely, you can see the match):


45 Comments
OT, feel free to delete of course, but thought you might like to know this: Ben Santer showed up to make a critical comment at WUWT (it does appear really to be him, judging from the detail in the comment and the specific anecdote related):
Ben Santer comment at WUWT
Does it matter whether proxies are used upside-down or not?
Yes if for no other reason its show a lazy haphazard approach to data which no good scientists should have. Although I understand that in climate ‘science’ all that matters is the impact of the results and that the path you take to get there, no matter crooked, means nothing.
Incompetent or disingenuous? It’s always the same question, the same questions. I’m very grateful, so grateful it grates with the superficiality of my analysis, that this note suggests confusion rather than malice aforethought.
==============
“the scale is different, but if you look closely, you can see the match” – I have trouble seeing that. First, assuming the dating is the same, the lows in the ~17th century of the inverted PAGES2K plot (bottom panel Fig. 2) don’t appear in the Kristensen plot (especially when assuming the peak-trough-peak pattern starting at 1500 matches). Also, there is a visible step up in the PAKGES2K version around 1750 which I don’t see in the Kristensen version. The annotation of the scale makes the inversion clear, but I can’t quite convince myself that they match so well as to be indistinguishable or even the same.
I had also plotted (but not shown) the version of P1003-MC that was archived at NOAA and the similarity is clearer when you’ve looked at that. I’m not entirely sure how the PAGES version derives from the versions at NOAA, but that’s a different story that I’m not concerned about at present.There are two colocated cores P1003-MC and SC. MC covers the most recent period and was shown in Kristensen et al 2004 and is shown below.
First, here is the archived series plotted on the Kristensen diagram. The dating in the archive is different than the dating in the diagram, but you can readily see that the O18 values are the same. Both are plotted in “LGM” orientation (high O18 values are “cold” for ocean sediments).
Figure 1. From Kristensen et al 2004 with NOAA archive overplotted.
Next here is a comparison of the NOAA archive version to the PAGES2K version. In the most recent period, the two series match exactly. In earlier periods, the PAGES version is some sort of blend of MC and SC, details of which don’t matter for now. The diagram here is opposite to PAGES orientation, but matches Kristensen orientation.
Does it matter whether proxies are used upside-down or not?
Thank you very much for the plot – it helped me a lot to see the match in the O18 values. When I was thinking about potentially different dating, I only considered simple shifts and not different timescaling – in effect, one year (going back from the end of the series) in the NOAA version corresponds to ~1.5 years in the Kristensen version. Once I could wrap my head around that it’s clear that the data is very similar (I believe it would help to emphasise that point or even – your time permitting – scale the time axis of the Kristensen version as well to better illustrate the similarity).
For me it’s indisputable that orientation matters – but it seems to me that proper dating comes shortly afterwards. Otherwise, the medieval reconstruction values become a hodgepodge of things that actually happened a few centuries apart…
Steve: hodgepodge is a real dating problem.recall the redating of coretops by Marcott where they moved dates all over the place.
I don’t understand why this is called “similarity”. They are identical. How is that possible: are they the same cores, or are cores so incredibly homogenous? It’s freaky.
Personally, I used “similarity” because the beginning of the Kristensen version doesn’t match NOAA’s, even allowing for different dating (also I don’t know anything about the differences in data processing, archiving etc. that went on, so without personally knowing that they are actually the same, my default would always be “very similar”, even if they are indistinguishable).
That’s fine, but I’d still like to understand. Are these from different regions? Different cores? Is it normal for cores to have this incredible level of uniformity? That would be very impressive!
They are the same core. P1003MC. but there are versions with different dates. And PAGES combines two P1003 cores.
Ps. It seems the dating differences are more complex. I first only looked at the peaks (in the inverted scaling) of ~1.0 at ~1625 (Kristensen) resp. ~1750 (NOAA), where the scaling between the two datings in the portion up to the present seemed linear. But this linear scaling breaks down in the part before, in particular the trough-to-trough (where Kristensen has added the arrow) is nearly 100 years in the Kristensen version, compared to roughly 200 in the NOAA version (if the linear scaling persisted, the Kristensen version would need ~300 years for this pattern)…
My honest opinion?
I cannot respect a scientist who takes such a sloppy approach.
para after Fig 2
“Had the series been oriented to show elevated O18 values to show elevated values in glacial periods,”
Should deleted second “…to show elevated values…”
Should deleted -> Should delete
So, what’s really going on with all of this upside down business? is it really disingenuousness or merely defective thinking?
It is my observation that people who are the real experts in their field, the ones who are genuinely top rank – whatever field that may be – one of the distinguishing features of such people is that they *think* so completely in the language of that field and are thus almost automatically able to detect errors and inconsistencies in the work of others that relates to the language of their field – statistics in this case. The casual intuitions of such people are very often born out when the language and methods of the field are rigorously applied because their intuitions are guided by a deep, almost uncanny, understanding of both the physical and mathematical behavior of the processes involved.
Maybe you feel the same way.
Tony Marchaj – another master in his field – used to use the example of Frederick W. Lanchester who was able to intuit that the importance of the difference in the flow pattern about two and three dimensional foils was caused by the difference in spanwise lift distribution in a wing, and which is itself traceable to the disposition of the circulation – seven years before the Wright brothers flew and before or the experimental discovery of a finite wing’s tip vortex system.
Marchaj wrote on an observation by Sir Graham Sutton:
Eventually wind tunnels were constructed that could visualize the twisting strands of vorticity being shed from the trailing edge of a wing [or sail] eventually gathering themselves into a much larger wing tip vortex system and eventually a mathematics was developed to analyze the phenomenon, but those efforts were guided by one man’s intuition and a hand drawn sketch derived from a well founded imagination.
https://www.princeton.edu/~maelabs/hpt/his/aerodynamics.htm
Some people think they are that guy, some people wish they were that guy, some people are that guy.
Now you figure out who is who in this case.
W^3
So this is nothing but an appeal to authority, right?
I think that is probably part of it, but it seems to me that there is also a lot of people who have fooled themselves into thinking that ‘they are that guy’ but are not ‘that guy’ going on.
Um, “wygart”, what you describe is a _theory_, later validated by tests?
There is an essential distinction.
Many theories don’t work out. Theorizing is fine for finding a way to an answer, but what climate alarmists do is confuse theory with reality.
That’s consistent with their underlying beliefs about the world.
(BTW, a good book about the scientific method, with historical examples, is David Harriman’s “The Logical Leap”. He includes at least one case where a generally good scientist got an answer wrong because he was blinded by his irrational personal beliefs.
Keith,
Ok, we are in complete agreement as far as I can see; *most* people are later shown to be in variance with nature in their wild suppositions, some people are later found to be concordance with nature. The trick is to be the one later shown to be correct, another lesser trick is to be able to spot the ones who will eventually proven right.
W^3
w.w.wygart (7:39 PM):
An even lesser trick is to praise someone who brings such things to our attention. But I want to thank you anyway, www. Once we answer Steve’s
strongly in the affirmative you’re indicating a plausible middle way between complete incompetence and deliberate deception. Those responsible are perhaps students of other great scientists and the wish-fulfilment aspect may be strong. Or maybe it’s all the will to power.
Well, “wygart”, my point is that the successful are either happenstance – hardly a method of knowledge for life, or did their homework including properly thinking through then testing.
I re-iterate that testing is essential.
Keith,
Let me clarify since it seems you’ve taken me a bit backwards. I never said that testing a hypothesis isn’t an essential part of science. What I suggested is that some peoples’ intuitions, once tested, turn out to be in accordance with nature more often than some others. People who’s intuitions turn out to be correct, not due to happenstance, but due to a “…deep, almost uncanny, understanding of both the physical and mathematical behavior of the processes involved,” I call “masters”. If you are not an expert yourself, figuring out who the real experts are can be an important method for navigating life, otherwise you tend to be left in the position of giving credence to whoever supports your own biases – “hardly a method of knowledge for life”.
W^3
w.w.wygart
An interesting comment, although I’m not sure I quite agree with your diagnosis. Indeed, I think sometimes the defence being put up by the Palaeo-reconstruction guys come from them being so focussed on the mathematical and statistical minutae that they forget the big picture, in that proxies are supposed to represent (to a greater or lesser extent) a real world process.
How else do you explain for example Mann’s response to Steve McI’s criticism of Tiljander being used upside down as per the following quote:
“The claim that ‘‘upside down’ data were used is bizarre. Multivariate regression methods are insensitive to the sign of predictors. ”
Yes, the statistical techniques typically used in the reconstructions don’t care whether the data series is orientated in a ‘more = warmer’ or ‘less = warmer’ (in very basic terms), but they do have the potential to incorrectly invert series if there is a spurious correlation between the calibration period (i.e. a section of the last about 100 years of the supposed proxy data) and the temperature series being used. It is in this case that the ‘a priori’ understanding of the behaviour of the proxy is essential and seems to be largely ignored by those who are happy to simply dump a load of data series into their statistical processing code.
Ian, the problem (especially in Mann et al. (2008) EIV) is actually much worse than what (I believe) you even know!
First, Mann checks for the orientation of the proxies in the screening step (this is how we know that the Tiljander series were upside-down also in the EIV reconstructions), but after that it does not enforce the correct sign! That is, proxies intended to be of a certain orientation may well be (and are) flipped to the opposite orientation.
Second, even worse, Mann (2008) is a stepwise procedure as MBH98, and the orientation of the proxies is decided in each step! So proxies end up to different orientations in different steps. We illustrated this by an example here. Let me reproduce that example with additional descriptions what is plotted in the figures (UC is sometimes very economical with his descriptions).
So I plotted the proxies and the corresponding reconstructions in two consecutive steps (AD500 and AD600) in Mann’s NH EIV reconstruction. The corresponding result (reconstruction for the step) is plotted in the right low corner in both figures. Pink there denotes the 100 year part that is taken to the final reconstruction (cyan is the instrumental). The rest of the boxies are the proxies for the corresponding step plotted in the same location in both of the figures. Notice that there is only one change between the steps: a proxy (fisher_1996_cgreenland) was added into AD600 step (plotted in the left top corner; an arrow pointing to it). Each proxy is plotted such that it is normalized as in the algorithm and scaled by the final weight. In other words, if you just add those proxies together you get the final step reconstruction shown in the right low corner. Additionally, I showed by the color of the proxies the sign of the proxies with respect to the original orientation: blue no change, red flipped.
So here are the figures:
Now notice especially the curtis_1996_d13cpyro (arrows pointing to it): not only it flips the sign but the weight changes considerable (from relatively minor proxy in the AD500 step it becomes the dominating proxy in the AD600 step).
Jean S: I want to register a complaint that you’re using your moderation privileges to blank out some or all of the subsequent comments! (How did you do that? Firefox 32 on Mac here 🙂 )
Jean S: It took me a while to even realize what you mean as only thing I did was that I answered to Ian’s comment. The thing that you probably are referring to is that I put the size of the figures (width=450) to the maximum that they appeared side-by-side. Apparently this software is calculating when it should divide the figures on different lines from the total length of the comment area, not from the width reserved for the comment in the reply tree. And hence the comment went a bit over the space. I now put the width smaller (width=400), is that fine now to you?
No, it’s increased the very narrow width of my text by 50 pixels as seen by Firefox. Same on Safari. Chrome is fine though. Cross-browser testing’s a bummer.
Jean S: Don’t know what to do, everything looks fine to me (Win 7).
Jean
Thank you for the clarification and extension.
Based on this, can you clarify that I understand this correctly:
The proxies to be included in each calculation step are ‘calibrated’ on their behaviour in the recent past (give or take any hidden declines) by comparision with some form of the temperature record (global or local, annual or seasonal);
This ‘calibration’ is used to weight the importance of each proxy in the overall reconstruction for the different time periods;
For series such as ‘treemometers’, a number of individual measurements are combined into a single ‘proxy’ so that (for example) there is an average of 100 measurements in the 1800-present step, 50 in the 1700 to present step and 10 in the 1500 to present step. These different series are then separately calibrated in constructing the 1800-present, 1700-present and 1500-present steps?
Surely (if I understood this correctly), if a data series is transposed between the different steps, the only conclusion that can be reached is that it is not a reliable temperature proxy, and must be discarded from all calculation steps…
Jean S: Pretty much so except that it’s not only “treemometers” tha are done in the stepwise manner, all proxies are done that way. First you take all proxies that are extending back to 1800. Then you calibrate them simultaneously against the instrumental (regression done by RegEM), calculate the corresponding reconstruction, and take 1800-1853 (instrumental starts 1854 IIRR) to the final reconstruction. Then you take all the proxies extending bach to 1700, calibrate and construct your reconstructiom, and take 1700-1799 to the final recon. And so on in hundred year steps. Now the point was that both the sign and the amplitude of the weighting of the individual proxies are varying from step to step.
The orientation of M08 proxies can also change depending on whether it is calibrated on the “late” or “early” period.
Hah! I had not noticed that.
Jean
Further to your second reply, I’m now slightly more confused. Surely for a proxy series to flip between stepwise calculations, there has to be a change in the dataset in the calibration period?
Surely some series (sediment core data for example) only comprise one data series through the entire duration of the reconstruction, so their calibration* will stay consistent through all the time step calculations. I only used tree rings as an example of series where there are potentially a lot of measurements in the recent part of the reconstruction and a decreasing number through time.
* As someone whose PhD is in analytical geochemistry, I really don’t like the use of the term ‘calibration’ to describe the process of comparing supposed proxies with temperature measurements. To me it suggests far greater precision and ‘scienciness’ than can possibly be justified for the methods that are being used and for the complexity / confounding factors that affect the development of the tree rings / sediment sequence etc.
Jean S: Sure, the number of proxies is changing (like in the example, there is an additional proxy in AD600 step). Notice that they “calibrate” all available proxes at once (i.e., it’s “multivariate calbration”), not individually. I sure understand your feelings about terminology.
Steve:Ian says: “Surely some series (sediment core data for example) only comprise one data series through the entire duration of the reconstruction”. You have to distinguish between Mann EIV 2008 and other methods, as Mann EIV 2008 permits/requires idiosyncratic flipping that would not occur in other methods. That’s not to say that other practitioners don’t use contaminated data or data upside down, as they do – most recently in PAGES2K Arctic.
Jean S wrote, “Jean S: Don’t know what to do, everything looks fine to me (Win 7).”
Win 8.1, IE 11. It doesn’t display right for me.
Jean S: I took off the alignment tags. I think they will show up nicely now with every combination, but the figures are not likely side-by-side as I intended.
Keep It Simple for Success is a very sound maxim.
Of course we already know WordPress churn their code on the fly without adequate testing.
Isn’t the instability in the sign a reflection of how tenuous or weak the relationship/signal is? I can’t imagine that the sign of a strong signal would flip with the addition or subtraction of a data series or a change in the length of the series. Seems to me to be dustbowl empiricism at its worst.
Steve: in some cases, i’d agree. but when I compare the Hvitarvatn varve series and the Big Round Lake, Baffin varve series, they cohere so well that it seems to me that that there is actual information on them. And yet both have been used upside down to the interpretation presently adopted by PAGES2K for Hvitarvatn. It’s very odd tho.
Ian,
Thanks for the reply. I’m not discounting the possibility that *much worse* things are going on with these paleo-reconstructions and the people creating them, far from it, it just that I’m trying not to overlook the more mundane explanations which may be closer to a root cause rather than the proximal.
As you said, “It is in this case that the ‘a priori’ understanding of the behavior of the proxy is essential and seems to be largely ignored by those who are happy to simply dump a load of data series into their statistical processing code.” That basic strategy for applying a tool to a job hoping or assuming the tool will do the right job is pretty damned common,and would actually have described my level of statistical expertise when I was in the QA business – journeyman. If I had a problem or a question I could, and did, pick up the phone and call the top stats specialist at Boeing and get a completely correct and authoritative solution to my problem. I was required to get approval from them for any change I might want to make anyway, so that was never an issue for me personally or professionally. For some people there seems to be a problem knowing where on the power curve they lie.
It also seems pretty damned common in the climate science biz to have lost touch with an observation of nature as the reference point for the beginning and end for the cycle of inquiry, which is why I tend to be a little ‘down’ on scientists who spend their whole careers in the office fiddling with other people’s data or don’t reference model output back to reality.
If you actually have to tromp out there and collect a core sample from a strip bark tree that at one point a perfectly round, fully barked, and upright tree that was subsequently pushed over to a forty degree angle, and now resembles an egg in cross section, a blush of modesty might restrain you from including it in you proxy reconstruction. If its just another chunk of wood on your desk you might be more inclined to justify including it – so you don’t have to go out there, tromp around in the arctic for a month and find a better tree to sample.
Same thing goes for sediment samples.
Who’s got a photo of that infamous tree BTW? Can anyone post it? I about fell of my seat when I saw that one.
W^3
Maybe it is just some kind of proxy homogenisation? It has worked for the Global temperature, so why should it not work for proxies. 🙂
Just a laymans joke.
I sometimes find the science behind proxies to be a bit shaky. If they show what you like it is a good proxy, if not dismiss it (or turn it).
Most proxies are influenced by a lot of different factors, so how do you eleminate the others?
In reality they do not , they just take a guess as to what effect these would have then take away that number.
The reality is they have no way of obtaining what are accurate values for many historic proxies.
In the past, when it was hard to predict accurately weather, that was acknowledge now its ‘super accuracy ‘ climate predicts it’s not . However, the proxies have not got better it’s the just the ‘need’ for them has got greater.
Computing power has allowed them to have more guesses faster , the side effect of that is they put less effort into data selection etc than they would have done if they had to do all the work by hand, Which is the long and hard root but one which encouraged people to think before they stuck the numbers in. You really don’t want to spend a week doing the figures only to find you got the data wrong to start with .
So it’s not acceptable to screen proxies by their agreement with the modern temperature record, but it is OK to screen them by agreement with the Holocene temperature record.
Yes, I could agree with that viewpoint since I regard it as much more certain that we are living in an interglacial than that “the modern temperature record” is correct.
MikeN
It is not very scientific to screen them with any temperature. They should be screened with some investigations that could clarify that they really react on the wanted parameter and not to other unknown.
As an example tree rings could be used for temperature in one paper, and in the next for precipitation.
I’d like to see, just for fun, what would happen if proxies were selected for the MWP. Bet the modern temps would be flattened.
Richard Drake (8:16 AM):
No worries, it was mostly said in jest. Everything remains readable. I’ll send you a snapshot by email for completeness.
All fine now, in all three browsers on the Mac.
Jean S: Well, I didn’t do anything … and now it is screwed up in my Win7/Firefox. Well, I just let it be… 🙂
Pushing the boundaries of WordPress/browser indeterminism 🙂
“Can’t anyone here play this game?”
Casey Stengel.
Reblogged this on I Didn't Ask To Be a Blog.
3 Trackbacks
[…] recent article on Climate Audit examines whether a graph was knowingly, or unknowingly used upside down. The opening comments […]
[…] original comment all the way back on Oct 4th article: Pages2K More Upside Down, in my usual obtuse […]
[…] part of my commentary on McKay and Kaufman 2014, I observed that, even after correcting upside-down use of Hvitarvatn, ocean sediment series P1003 (d18O) was […]