The MD99-2275 core offshore Iceland is a very high-resolution ocean sediment core, results of which over the past millennium have been discussed here from time to time. Alkenone and diatom results for the last millennium have been available for about 10 years. MD99-2275 results were used in PAGES2K Arctic and Hanhijarvi 2013, also Trouet et al 2009, but not Marcott et al 2013. Because of their high resolution and because of their extension through box cores into the 20th century, it’s gratifying that high resolution results are now becoming available through the Holocene. In 2012, alkenone results were extended back at high resolution to 4500 BP and last week, Jiang et al archived their diatom results back to 9271 BP in the early Holocene. In today’s post, I’ll show the new results from Jiang et al and show an interesting comparison to Marcott.
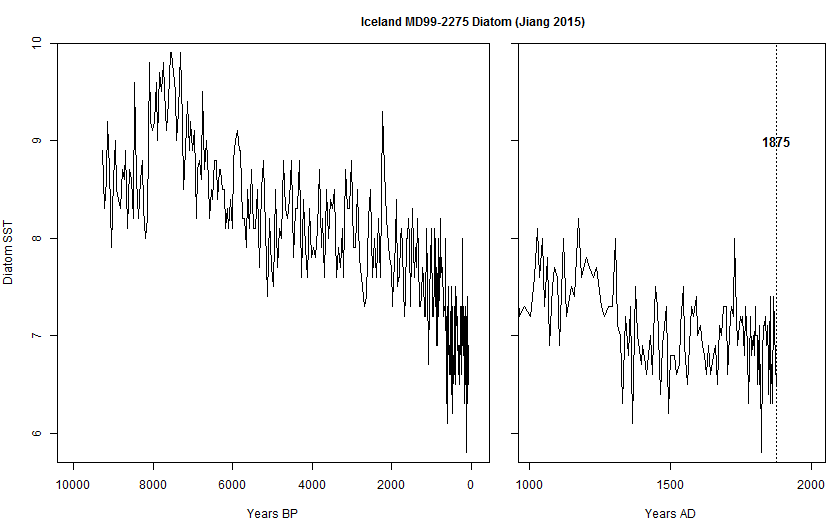
First, here are the new results from Jiang et al 2015, Solar forcing of Holocene summer sea-surface temperatures in the northern North Atlantic, published in Geology rather than Nature or Science (data here). On the left is the data back to the early Holocene; on the right, a blowup of the last millennium. The diatom data represents summer temperatures and shows the familiar Milankovitch decline over the Holocene. The data for the last millennium also shows a marked MWP, relative to the Little Ice Age, though in a Holocene context, its the Little Ice Age rather than the MWP that is distinctive. In Hvitarvatn, Iceland lake sediment data, discussed here on several occasions, the 19th century was exceptionally cold on a Holocene basis (marked by ice-rafted debris), thus requiring identification of thick 19th century varves with cold rather than warmth (PAGES2K using this data upside down.)
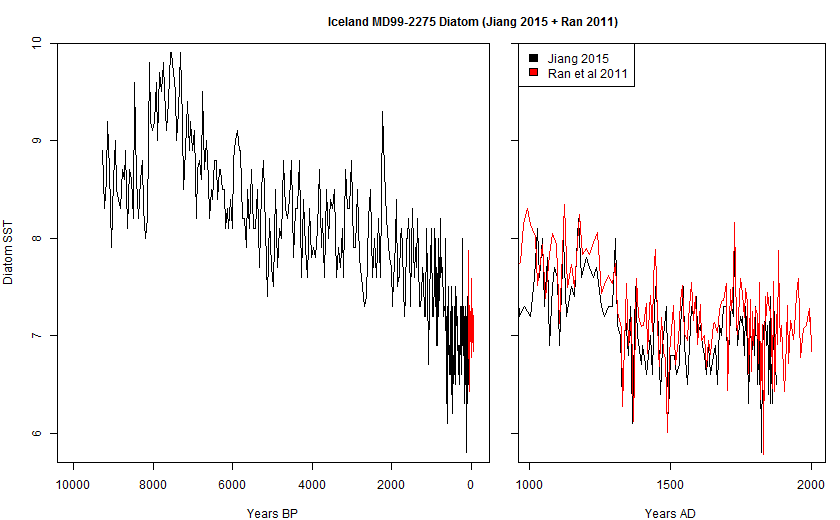
Because the Jiang 2015 dataset ends in 1875, it seems to leave the modern comparison frustratingly unanswered. however, Ran et al 2011 had combined two contiguous box cores with MD99-2275 to construct a continuous diatom record from AD1000 to AD1999. In the figure below, the Ran et al 2011 diatom series is shown in the right panel in red: its 20th century values are essentially unchanged from 19th century values. (In the left panel, I’ve only shown post-1875 Ran et al 2011 values (red).)
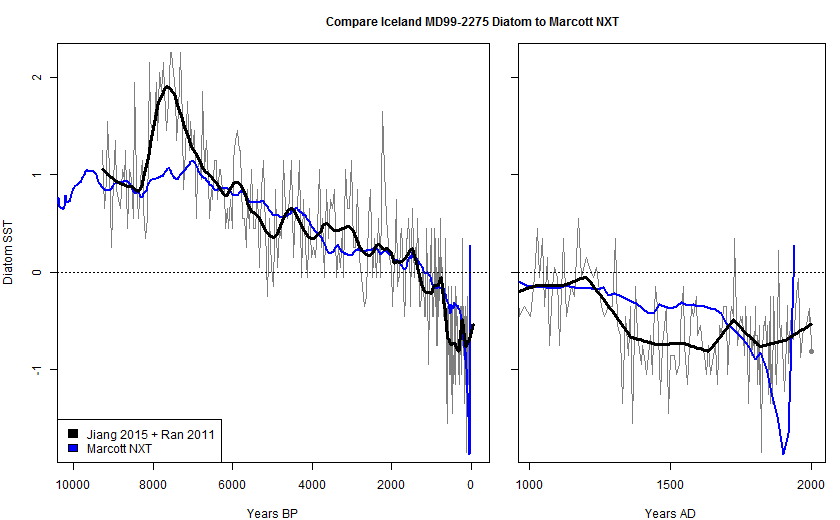
In the next figure, I’ve compared the high-resolution MD99-2275 record to the Marcott NXT reconstruction. For comparison, I matched the mean of the MD99-2275 record to Marcott over the 5000-1000 BP period. The absolute values of the decline in temperature from the early Holocene to the last millennium (~1.8 deg) is surprisingly similar in the two series. The two main differences between the series are the very strong warmth in the MD99-2275 record around 7500 BP not shown in the Marcott record and the absence in the MD99-2275 record of the very erratic Marcott results over the past 200 years.
Discussion
During the Holocene, high-latitude summer insolation has decreased dramatically (over 40 wm-2), while changes in annual insolation have been very modest. Nearly all biological proxies are responsive to summer temperature, rather than annual temperature. The MD99-2275 temperatures are summer temperatures. The Marcott dataset is dominated by alkenone series, which are also responsive to summer temperatures and should therefore be interpreted as a reconstruction of summer temperatures, rather than annual temperatures – see useful discussion by Richard Telford here here other than his pointless snipe at me about criticizing the fake Marcott uptick ). While it is an article of faith in Mannian paleoclimate that annual and summer temperatures are correlated, this definitely ceases to be the case on a millennial and Holocene scale, as precession and obliquity change.
In geophysics, explorationists have considerable experience in working with datasets of very different quality. Their practice is to work out from the “best” high resolution data rather than contaminate high-resolution data with poor data. Reasonable people can disagree on precisely how to do this in paleoclimate. However, it is possible for methods to be objectively bad and even wrong – Mannian principal components is one example, the Marcott uptick artifact is another. As noticed at CA, the Marcott uptick was a botched artifact of station dropout, exacerbated by Marcott’s unwitting reallocation of core top dates. Marcott et al ought to have issued a corrigendum, but unfortunately preferred to pretend infallibility. As readers are aware, D.C. judges have ruled that it is a tort in D.C. to question Mann’s reasoning; it is presently unknown whether it is also a tort in D.C. to question the reasoning of Marcott and other coauthors of Marcott et al 2013 or climate scientists in general, or whether it is only a tort to “question” Mann’s “reasoning”.


32 Comments
The great shame of science today is that Shaun Marcott, with his stretching of the truth, is rewarded with a faculty position at the University of Wisconsin – Madison, along no doubt with grant money, impressionable grad students and a soapbox. Meanwhile real science is done here at this website at the author’s expense and available to the world in real time.
Nvw: very well said. Steve, one day your massive contribution to science and reason will be recognised
Already has been, but not sufficiently. http://www.newstatesman.com/global-issues/2010/09/climate-mcintyre-keeper
“In geophysics, explorationists have considerable experience in working with datasets of very different quality. Their practice is to work out from the “best” high resolution data rather than contaminate high-resolution data with poor data. Reasonable people can disagree on precisely how to do this in paleoclimate”.
What about this use of Jiang 2015 data alongside Ran et al 2011 data..? Is there any similarity at all between something like this and the much-discussed graphs that transition from tree rings to instrumental data? Jiang ends in the 1800s, much like the instrument data ‘ends’ in that same era, etc. etc.
Why would you say this. First off, it’s clearly explained exactly what is being shown, in both words and “substantially” different colors in the charts.
Secondly, there is a good overlap between the Jiang and Ran data, where you can decide for yourself if and any problems that may occur from the comparison. Surely you’re not comparing this to the “Tree Ring”/thermometer fiasco.
Now given the above, you still might not agree with the overlap comparison, and if you don’t, I’d be curious to here why why?
I recall others making the same argument about their graph “clearly explaining” what’s being shown (yes, the “Tree Ring”/thermometer fiasco). Also, it was a bone of contention that the “overlapping” Briffa data in that other graph wasn’t shown, regardless if viewers can do the work to look it up themselves if they like. Mainline climate scientists elected to declare that the divergent Briffa data was spurious (naturally once it started to diverge), and therefore wasn’t worth showing at all…but of course anyone else could look it up if they wanted.
A simple fix would be to show the overlapping data. I believe that’s what everyone was saying would have helped the other case too. Wouldn’t you want to at least remove the appearances? The case is being made that it’s fine to splice different data sets onto each other to form a single line, and truncate overlaps (different colors or not). Is it?
Respectfully, you miss my point….”splicing” or addimg one data set with another is one question. Right or wrong…if you state what you did…we are all aware and can voice our approval or disapproval of the technique. In the above example from steve both data sets, in their entirety, are shown, then zeroed in to the time frame in question. In the man fiasco, actual data from one series was cut off and not shown, I repeat, not shown in any of the hundreds of secondary publications of the chart. Do You understand the difference….If you are saying either one of the jiang or Ran data sets have been truncated, or cut off, you have a point of contention I will listen to….If neither one has been truncated, we’re back to square one. As a layperson, my only beef with the Mann fiasco was “snapping off” a piece of an individual data set when it inconveniently didn’t support his main argument. Again..where has Mr Macintyre cut off, eliminated, or not shown even the smallest piece of either one of the 2 data set referenced in his analysis. State the sources of the two data sets…and show at least somewhere in the same analysis both data sets in their entirety. Use obvious colors for differentiation, you know “red vs “black” as opposed to Mannian “blue” vs “Mannian not so blue”.
Splicing two data sets can be OK….Arbitrarily “dropping” “omitting” “hiding” “truncating” or ” failing to show ” data for whatever reason….not so much. Splicing two data sets while truncating one of them, at the exact point of divergence is not an error…..it is a fraud, plain and simple. Did Mr Mcintyre cut off or truncate any of the two data sets mentioned in his analysis?
No, the case is not being made that “it’s fine to splice different data sets onto each other to form a single line.” That’s far too general a principle. What Steve appears to be doing is splicing two datasets that could act as ground-truth for the Marcott reconstruction. What the tree-ring/thermometer splicers are doing is concatenating reconstruction and ground-truth, two very different things. The latter is pure deception, since the reconstruction is to be judged against the ground-truth. Mixing in ground-truth with the reconstruction deceives the audience about how good the reconstruction is and whether there are any interesting patterns in it. Whether it is kosher to splice together two different proxies to act as an extended ground-truth is another question, but a wholly different practice. It is not an attempt at deception.
Known unknown noted.
Maybe Marcott can file suit so that we can find out.
Marcott: the next generation of Mannian confabulators</a
It should be a presumption of American law that persons affiliated with “Big-10” schools (Penn State, Wisc., etc.) are mathematically maladjusted.
It stands to reason.
Since there are now 14 schools in the Big 10, one can assume either
1) They no longer understand or value the Truth
or
2) All numbers they post should be adjusted by 40% and any projections should apply an additional inflation factor
But this is what comes from valuing football over education.
“But this is what comes from valuing football over education.”
Even with the standard 40% central planning recalibration, football has been conclusively proven to have a greater value than actual education.
Steve,
Dyou know if Dr. Curry is aware of this? Reason is that she has had guest posts by Marcott in the past, so I might get the impression that she may generally respect his work (just a guess on my part, though).
I think maybe I’ll ask her to review your post . . .
An express elevator, swooooosh, to the top, the Executive suite, er tweet. Woulda coulda shoulda paused at a few floors.
===============
Nice one, Kim! Love it.
At the risk of editorializing it has been clear since Shackleton that diatoms just luuuuv Milankovitch. Just look at the OCO following the ITCZ. In my opinion Milankovitch effects are just one layer, of many, and as you point out all except eccentricity cancel out over seasons and hemispheres.
Interesting that the hirez summer diatomic indices seem to show decreased fluctuation period as temperatures cool, but not apparently an increased amplitude. This is somewhat at odds with the lower res but vastly more comprehensive results of Lisiecki and Raymo. Their results synthesized below show similar period but increased amplitude of fluctuations during the cooling since the Miocene.
Why is it when I see graphs like this I start working about climate change? Just not global warming.
There appears to be no connections to other blogs, they have disappeared. Is this just me or anyone else with this problem.
The third picture shows nearly 7000 years of good agreement between the proxies in the combined Jiang 2015 and Ran 2015,
and Marcott. Seven thousand years…….I will have to re-read
what is causing Marcott to fall apart in the last two centuries, and the cause of the very early Jiang bump. I would say between those two events at the beginning and near the end of the records, the agreement is amazing.
The bump in the Jiang 2015 data also corresponds to the time when my Norwegian ancestors first were able to settle Norway after the last ice age. They were really headed to Spain, but got lost and wouldn’t ask for direction.
Obviously the men were navigating
Ladies would have asked for directions 😉
Did Marcott ever respond to (I mean ACTUALLY respond to) the criticisms raised by Steve?
Steve: no. Unresponse at realclimate.
O/T Pielke Jr. has started a new blog for climate stuff. The Climate Fix
I believe that’s actually a book he wrote, PhilH:
http://sciencepolicy.colorado.edu/publications/special/climate_fix/
Here’s his blog:
http://rogerpielkejr.blogspot.com/
Well, it *is* the name of Pielke’s book, but also of his new blog for climate-related issues.
To paraphrase a well-known song title by Merle Haggard, “The Google Let Me Down.”
Reblogged this on I Didn't Ask To Be a Blog.
Steve, it’s been a while since I visited your site. I’d forgotten how much I enjoy it.
Left you a tip, but I hope US dollars are still good in Canada.
Now some, not Eli to be sure, might think that this was previously posted, but at least on the surface it appears that a comparison is being made between a temperature proxy series in the North Atlantic and a global evaluation over many proxy series. Is this the case?
Steve: One of the problems with Marcott’s composite is that his handling of recent data has been incorrectly done, leading to spurious results from a rather small number of series, some of which are incorrectly dated. Its recent portion is a total farce. The comparison here was to the Marcott Northern Extratropics composite, not a “global” evaluation. Marcott’s “global” evaluation has less meaning than his NXT composite, since the recent portion of his SXT reconstruction is bogus. The NXT composite is very heavily weighted towards North Atlantic data – an issue not clearly discussed in Marcott. Another problem with Marcott’s data set is that the data is of uneven quality and unfortunately Marcott doesn’t discuss the quality differences, instead putting it into a black box. Under such circumstances, it’s always a good idea to look at relatively high quality data even from individual sites in order to assess whether the composite makes sense.
Steve,
It’s nice that you have gone a bit further on this and pulled out some more references to extend the analysis of the core used by Marcott et al. Can you confirm that you are looking at the following reference please?
Ran, L., Jiang, H., Knudsen, K. L., & Eiríksson, J. (2011). Diatom-based reconstruction of palaeoceanographic changes on the North Icelandic shelf during the last millennium. Palaeogeography, Palaeoclimatology, Palaeoecology, 302(1), 109-119.
I was wondering, which figure in Ran et al. (2011) corresponds to the data you used to extend the core analysis in your second panel titled ‘Iceland MD99-2275 Diatom (Jiang 2015 + Ran 2011)’?
Thanks
Steve: I used Ljungqvist’s digital version of Ran et al 2011 data. I should have mentioned this.