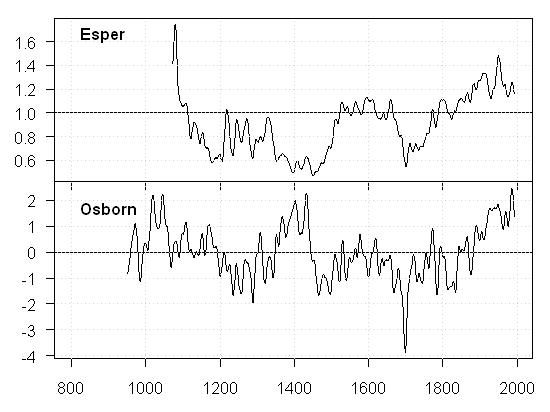
People have been wondering why there is such difference between Polar Urals versions. In many cases, the archived Osborn and Briffa [2006] version (smoothed) is consistent with the emailed Esper et al [2002] version – but not always. It’s always worthwhile examining differences and here are a few.
Jasper/Icefields, Alberta
Here the Esper et al [2002] version looks like the Luckman [1992] version archived at Briffa’s website and a mainstay of multiproxy studies. Osborn and Briffa[2006] use the updated version done by Luckman and Wilson [2005] (not yet archived). The correlation between the two versions is only 0.27. Note the size of the differences around AD1400. Remember that the earlier version probably thought that it had a very tight confidence interval.

Figure 1. Jasper/Icefields versions. No archived measurements.
Foxtails
Foxtails are closely related to bristlecones (they interbreed and are on adjacent mountain ranges in California). I took the average of the two foxtail series in Esper; the average correlates closely (>0.99), but the Osborn-Briffa version does not include a high portion in the early 9th century. I’m sure that there’s a wonderful reason for this.

Figure 2. Average of Boreal and Upper Wright foxtails. No archived measurements.
Quebec
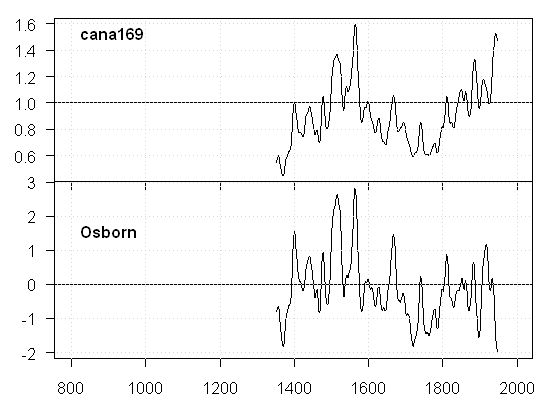
I have no idea what they are doing here. Both Briffa and Osborn match, but they truncate the series in 1947. Contrary to speculation, the RCS version goes up after 1947.

Figure 3. Quebec (cana169). Esper et al. [2002] had cited Filion and Payette, a different series.
Tirol
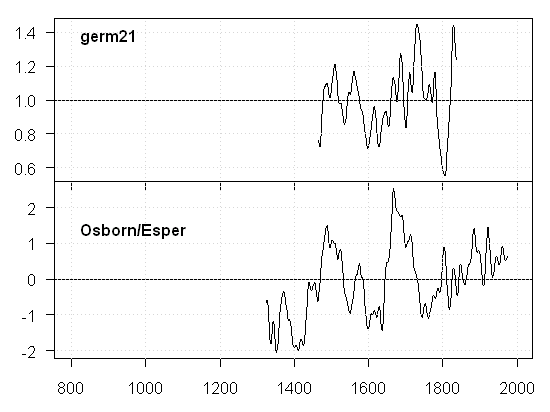
Again, I am unable to fathom the provenance. Both Esper and Briffa seem to have the same version, but it’s inconsistent with germ21 (cited in Osborn and Briffa).

Figure 4. Tirol (germ21)
Tornetrask
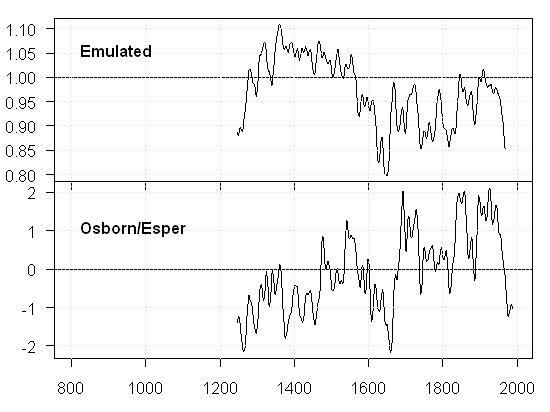
Here Esper and Briffa have somewhat different versions (correlation 0.81). Note that the 20th century is elevated in the Osborn and Briffa version relative to Esper – this will undobtedly shock everyone.

Figure 5. Tornetrask. Archive not consistent with report.
Polar Urals/Yamal
Obviously I’ve posted lots about this. The correlation between the two smoothed versions is 0.50.

Figure 6. Polar Urals/Yamal. Yamal not archived (but I have it)
Mangazeja
Again, Osborn and Esper had virtually identical versions, but the dates and shape were incompatible with the archive references (russ067, russ068).

Figure 7. Mangazeja
Taimyr
The Esper and Briffa versions are very similar but not identical (correlation 0.94). There is perhaps some difference in RCS numerics.

Mongolia.
Again the Esper and Briffa versions are similar but not identical (correlation 0.8). There is an archive beginning in 900, while both Esper and Briffa versions begin earlier.


6 Comments
Fundamental data that should be the same but isn’t. Data not matching to citations.
Do I guess that none of these differences have been noted and explained by the authors?
Steve: By “emulated,” do you mean that you used their reported procedures on the same data? If so, the differences are striking.
You know. You look at this stuff and you have to ask yourself “What the F…”
I mean it’s a smorgasbord of the different errors they could do. There a big heaping roast of Truncation, “Hey look 600 years ago this one shows it was way warmer than now.” “Cut it off then.”
Then you look at Mangazeja, they would get better correlation if one of them reversed the sign on everything.
And in every case the “errors” “Truncations” whatever is questionable always reduces past warming, and increases current warming.
You have to wonder if all this business about “I had the data but I moved and can’t find it now” isn’t really true. I mean you look at this, they all start with the same numbers and any similarity in two different calculations is less than pure coincidence.
#2 – it’s my implementation of the procedure. It’s impossible to do a clean benchmark of RCS algorithms as, to my knowledge and this is pretty amazing when you think about it, there are NO archives of both an RCS ring width chronology and a measurement data set which match. Isn’t that crazy? I’ve matched my method off smoothed curves and match the curves OK.
#3. I wonder how much of the difference between Esper and some of the other studies is simply accounted for by the Polar Urals data set. It seems hard to believe that none of these guys were aware of the difference. I’ll bet that they just wanted to bury the underlying Esper versions.
Steve any chance you could invert one on of the Mangazeja plots and compare correlations?
Just for a laugh
As a classical (bad) poet would say:
“From an eyeball perspective
it seems pretty plain
to see
proxies look always defective
if made
from the width
of the rings
of a tree,
even for a good [Steve] detective”.