Examining the ATL hurricane data in another thread, I pointed out that there was a very substantial increase in coverage further to the east. In the entire data set, the median westing for a track measurement was 69W.
To attempt to minimize count bias resulting from increased eastward coverage, I did storm and hurricane count calculations restricting measurements to tracks west of 69W. If there is a robust trend, then obviously any robust trend would also exist in the restricted domain west of 69W.
CA readers are used to novelties, but this one is pretty neat.
In the following two graphics, I restricted the track data to measurements west of 69W and then took a count of the number of tropical cyclones in each year. Holland and Webster said that the ATL data had three regimes: from 1905-1930; from 1931-1994 and post 1995 with a sharp demarcation between each “regime”. Does it look to any of you like the post-1994 counts are off the charts, especially when the 2006 season is included?
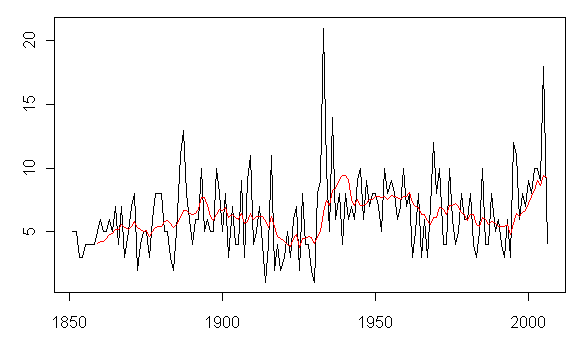
Figure 1. ATL cyclone count (west of 69W)
But there’s more.
The next figure shows the hurricane count restricting the data in the same way. 2005 is a big season (like 1933 also a very hot year), but where’s the overwhelming statistical trend?

Figure 2. Same with hurricane (GT 65 knots). Red – runnning 9-year mean.
UPDATE. Here are the same graphs restricted to the east of 69W. Figure 3 below is calculated parallel to Figure 1. Some storms will occur in both counts – we’re exploring the data here. There’s a lot in common between Figure 1 and Figure 3, but obviously Figure 3 has a trend that doesn’t exist in Figure 1. Is this climatological – Judith Curry suggests that it might be something to do with the AMO – or is it an artifact of changing measurements? I don’t know, although I’m inclined to think that it’s probably to do more with measurements than climatology. However, isn’t this the sort of thing that the specialists should be doing before publishing articles announcing that the trends are “strong” and “statistically significant”?

Figure 3. As with Figure 1, restricted to east of 69W.
Now for the same thing for hurricane-strength wind measurements showing the results E of 69W. Here the trend is not as strong as for storms, lending further support for the suspicion that there is a methodological bias in eastern “small” storms. However, there’s something else interesting in this plot – if one is seeking “regimes” in this particular chart, one would be inclined to assign a regime to the post-1950 period i.e. the modern aircraft surveillance period. But what is one to make of the similar counts in the late 19th century? Is there a “regime change” associated with a changeover from sailing vessels to steam vessels? Looks possible to me. (I’m old enough that high school readings for me included novellas like Conrad’s Typhoon and Youth, so the memories of hurricanes and sailing vessels were still alive in literature in the 1950s and 1960s.)
Maybe this is all to do with the AMO as Judith Curry is now proposing, but again I think that the authors should try to work these things out before rather than after publishing.
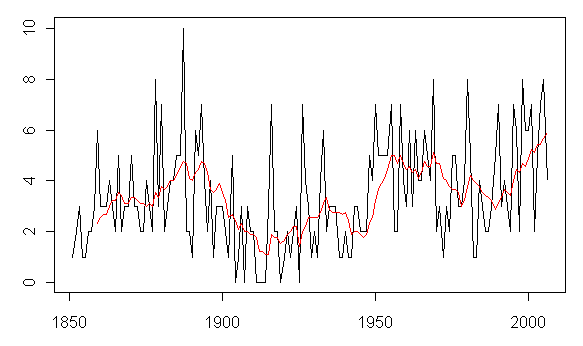
Figure 4. Same as Figure 2 (hurricane strength measurements), restricted to east of 69W.


96 Comments
Methinks that Occam is sharpening his razor…
#1 I agree that it does appear to be a case of biased sampling introducing a trend. Yawn.
I was looking forward to a longer discussion, a chance to elaborate on the low-frequency noise in this data and what it implies about possible inferences. Specifically, if one buys into the concept of long-term persistence — see Koutsoyiannis if you are not already convinced — Occam’s razor leads one to a truly interesting explanation for a trend.
For future reference, here’s the abstract:
SteveM: Excellent job deciphering this.
I wrote “yawn” above because sampling problems seem to be such a frequent occurrence in climate science, whether we’re talking about bristlecone pines or hurricane counts. But that in no way detracts from my respect for those who can identify these problems and figure out what went wrong.
Steve, can you pls clarify what you did. did you select tracks that were entirely west of 69W? In earlier records, they may have only picked up the portion of the tracks that were east of 69W, So I am not sure exactly what if anything this analysis shows.
I think a better way to address this would be to look at the period from 1960 (when we arguably have perfect storm count because of satellites) to see how many tracks are completely contained in the region east of 69 W. Then compare this number with previous years to assess what proportion of storms might have been missed east of 69 W in the earlier year.
Judith, here’s the code for the calculation (you folks should try archiving your code BTW – it facilitates seeing what people did), The collations objects are what I’ve archived at http://www.climateaudit.org/data/hurricane/unisys. For each storm, I calculated the max wind speed west of 69W for each storm and separately the max wind speed west of 69W restricting to wind speeds gt 65 knots. Then I counted the number of storms (hurricanes) with such a max, which yields the count.
TAC, I’ll post up the graphs for the same calculations reversing the restriction to east of -69 (the -690 in the code is multiplied by 10). Care to guess what they will look like?
#6 How about unnaturally trendy?
Dr. Curry, I believe that Steve’s plots show any storm which “set foot” west of 69W, even for just 6 hours. That is what I see by comparing his numbers for individual years versus what the Unisys plots show.
Per your suggestion, I did an ocular check of the plots. My focus is on tropical storms which completely stayed east of 69W.
My thinking is that weak systems may have been missed in the 1960s, even with satellite coverage, as these weak systems often are difficult to distinguish from non-tropical lows, especially if they are in troughs/ frontal zones. that is especially true with the kind of satellite image quality in the 1960s. Also, my belief is that in years past people did not particularly care about spending time guessing as to whether a weak, fuzzy, distant low had acquired sufficient tropical characteristics.
For the ten years 1960-1969, I count eight tropical storms completely east of 69W (Celia, Becky, Florence, Judith (no kidding), Edith, Edna, 1967 #11, 1969 #10). (Three were in 1960-64 and five were in 1964-1969.)
For the ten years 1996-2005, I count twenty-three tropical storms completely east of 69W (Gustav, Fabian, Grace, Alex, Arlene, Emily, Chris, Ernesto, Nadine, Noel, Lorenzo, Jerry, Josephine, Dolly, Ana, Nicholas, Peter, earle, Otto, Harvey, Lee, Delta, Zeta).
For 1950-1959, I count eight.
For 1940-1949 I count five.
I think we have yet another problem with the historical record, which makes it difficult to compare the last active period with the current active period.
The other thought I have about Steve’s chart is that, if the data is perfect and AGW does not result in an increase in hurricanes west of 69W, then who cares about the AGW impact, other than the Lesser Antilles and ships?
Steve:
Is the link in #5 correct? I can’t access it; if I back space over the period, I get a forbidden error.
The objects are http://www.climateaudit.org/data/hurricane/unisys/Track.ATL.txt; Track.WPAC.txt,…etc. Also files */hurricane.ATL.txt has summary info. I keep these collated into one R-object Track.collation with names [[1]]-ATL; [[2]]-WPAC etc. and another hurricane.collation with same names.
a command Track <- read.table("http://data.climateaudit.org/data/hurricane/unisys/Track.ATL.txt",header=TRUE,sep="\t") should read OK. Check with
dim(Track) #38794 9.
BTW for people interested in hurricanes, I've done the grunt work of collating the ungainly unisys formats and this save a lot of work. Don't ignore the WPAC, EPAC, NIO and SH data.
There are many trivial analyses that can be done in a line or two that don't seem to be done in Team Hurricane world.
Steve,
The 9 year running mean in your second graph seems to show a pattern with a 70 year period. I say that it “seems to” because we do not have sufficient historical data to know if a 70 year pattern is repeating.
#11. Brooks, to me it just looks like the sort of thing that you get with smoothed red noise. I wouldn’t read anything into this type of “pattern”.
Margo
If you click the directory now it should work.
SteveM: I found I had to make a couple of modifications to get your R script to run on my machine:
##EASTING CUTOFF
hurricane.collation = list(ATL=read.table(“http://data.climateaudit.org/data/hurricane/unisys/hurricane.ATL.txt”,header=TRUE,sep=”\t”))
Track.collation = list(ATL=Track)
hurricane = hurricane.collation$ATL
temp=(-690 > Track.collation$ATL$long) #for storms
y = tapply(Track.collation$ATL$wind[temp],Track.collation$ATL$id[temp],max,na.rm=TRUE)
x = as.numeric(names(y))
hurricane$westwind = NA
hurricane$westwind[x]=y
westcount=ts(tapply(!is.na(hurricane$westwind),hurricane$year,sum),start=1851)
par(mar=c(3,3,1,1))
plot(1851:2006,westcount,type=”l”,xlab=””,ylab=””)
lines(1851:2006,filter(westcount,rep(1/9,9)),col=”red”)
(N.B. Most of the editing actually involves eliminatig the dreaded .LT. — does WordPress still choke on .LT.?)
# 14 Correction: Either you need to define “Track” (as in #10) or use something like:
##EASTING CUTOFFhurricane = read.table("http://data.climateaudit.org/data/hurricane/unisys/hurricane.ATL.txt",header=TRUE,sep="\t")
Track = read.table("http://data.climateaudit.org/data/hurricane/unisys/Track.ATL.txt",header=TRUE,sep="\t")
temp=(-690 > Track.collation$ATL$long) #for storms
y = tapply(Track$wind[temp],Track$id[temp],max,na.rm=TRUE)
x = as.numeric(names(y))
hurricane$westwind = NA
hurricane$westwind[x]=y
westcount=ts(tapply(!is.na(hurricane$westwind),hurricane$year,sum),start=1851)
par(mar=c(3,3,1,1))
plot(1851:2006,westcount,type="l",xlab="",ylab="")
lines(1851:2006,filter(westcount,rep(1/9,9)),col="red")
#
Track.collation
David and Steve,
The errors in counting storms since 1944 may cut both ways, where a tropical depression may have been inappropriately counted as a tropical storm. We just don’t know.
There are three issues here that I see:
1) different decades have different average TC counts, the decadal numbers should be scaled in some way
2) you would expect a different E-W distribution in different parts of the AMO cycle (david, can you do the same analysis for the 30’s, which may be the closest analogue for the most recent decade)
3) there may be a physical explanation associated with AGW that explains the higher concentration of TCs in the eastern segment. Changes in the warm pool SST and the MDR associated with AGW might explain at least part of this shift (note Webster made a presentation on the changing tropical warm pools at the AGU). David, another thing to check is to see how many of the eastern TCs were in the outlier seasons (like june, july, oct, nov, dec). Increasing season length may explain some of this (presumably any missed TCs would be randomly distributed over the season, so season length should be a variable that is fairly robust to missed TCs.
Re team hurricane not doing this yet, i agree that it should be done. The REALLY frustrating thing to me is that the card carrying tropical cyclone experts (at the national hurricane center, etc) haven’t done this (and one person from that community has stated publicly that I’m not qualified to analyze the data). H/W is the first paper to have used these data in a substantial way in a journal article. This article will motivate more careful scrutiny of the data set (in the way that WHCC motivated scrutiny of the global intensity data set). I haven’t done these checks yet for several reasons, one of which is that I don’t have any funding to do hurricane research (not complaining, I haven’t had time to apply for any yet). We spent our time last summer going through the landfalling data in detail. Now I have two new M.S. students who will start looking at these data next semester. It will take multiple different consistency checks to sort out what is real undercounting vs some sort of real variability.
RE # 16
Here’s my count of tropical storms which never made it east of 69W (see footnote):
1920-29: 3
1930-39: 4
1940-49: 5
1950-59: 8
1960-69: 8
1970-79: 11
1980-89: 19
1996-2004: 23
Looks to be like an improving-detection pattern, as satellites became more capable.
(Footnote – I count “subtropical storms” in this count, which seems to be the convention as best as I can tell. Also, a number of storms come very close to 69W and my eyeball exam may have misclassified several. Neither of these factors make a significant difference in the pattern above.)
Judy-
It is probably best to follow to your own good advice and stick to the statistics 😉 You write: “The REALLY frustrating thing to me is that the card carrying tropical cyclone experts (at the national hurricane center, etc) haven’t done this . . .”
Well actually it has been done to some degree, it has been cited here, and for whatever reason it has been ignored. The papers cited below from 2000 and 2002 include suggestions for bias corrections in NATL TC and H counts which might have been used by you (and still might;-) or HW in their paper.
Solow, A. R., Moore, L. J., 2002: Testing for Trend in North Atlantic Hurricane Activity, 1900-98. Journal of Climate. 15, 3111-3114.
The detection of a trend in hurricane activity in the North Atlantic basin has been restricted by the incompleteness of the record prior to 1946. In an earlier paper, the complete record of U.S. landfalling hurricanes was used to extend the period of analysis back to 1930. In this paper, a further extension is made back to 1900. In doing so, the assumption in the earlier paper of an exponential linear trend is relaxed and the trend is estimated nonparametrically. The results show no significant trend in basinwide hurricane activity over the period 1900–98.
Solow A. R., and L. Moore, 2000: Testing for a trend in a partially incomplete hurricane record. J. Climate, 13, 3696–3699.
The record of annual counts of basinwide North Atlantic hurricanes is incomplete prior to 1946. This has restricted efforts to identify a long-term trend in hurricane activity to the postwar period. In contrast, the complete record of U.S. landfalling hurricanes extends back to 1930 or earlier. Under the assumption that the proportion of basinwide hurricanes that make landfall is constant over time, it is possible to use the record of landfalling hurricanes to extend a test for trend in basinwide hurricane activity beyond the postwar period. This note describes and illustrates a method for doing this. The results suggest that there has been a significant reduction in basinwide hurricane activity over the period 1930–98.
Correction to line 1 of #17: the sentence should read, “…never made it west of 69n…”, not “east”
( Re # 19 Blew it again, need more coffee: that 69W, not 69N)
Steve, you need to remove the colon from the end of your link in post #10
Here’s a little hint, whenever I type a URL, I make sure it has spaces at either end, and that punctuation doesn’t touch it. For example, if it’s at the end of a sentence, I type it this way http://foo.com/blah .
That way “intelligent” programs don’t think the final period is part of the link and created an invalid link for you.
Hope that helps.
Roger, Solow and Moore addressed the issue of a trend, using data mostly prior to the current active phase. Further, they make an assumption that is highly unjustifiable in my opinion in assuming that the proportion of U.S. landfalls to total TCs should be constant (you get a different answer if you assume the ratio of central america landfalls to total TCs is constant). In my opinion, while these papers address relevant topics, they are not very useful for a number of reasons (which is presumably why they haven’t been referenced much). The issue we are addressing here is assessing the uncertainty in the historical TC data base. The HURDAT committee to my knowledge has not done much with data between 1911 and 1989, and is several years behind their projected schedule. This may be attributed to a variety of reasons, including budgetary issues. Several TC “insiders” have complained about the HURDAT process. So I am allowed to be frustrated by the state of this data set. And I’m sure the TC insiders would rather be in control of this process than Curry et al. or the climateauditors. But it is now time to start looking at this. I hope that the HURDAT group can catch up with us soon.
David, actually the TC data set does not include subtropical storms. the early part of the record almost certainly undercounts subtropical storms.
Part of this variability is likely to be associated with undercounting. But I find it difficult to explan the differences between the 70s, 80s is solely due to undercounting, this doesn’t really make sense.
To further try to interpret this, i suggest looking at the decadal ratio of the eastern TCs to the western TCs, and the monthly distribution of the eastern TCs
re: #22 Dr. Curry,
You say:
As you should know by now, the group here doesn’t rely on people’s opinions. They demand evidence. You go on to say that things are different for Central America. Why not just say, “Willis, please run your program using Central America instead of the US. I think you’ll find a different result, casting doubt on the assumption that US landfalls are a constant proportion of total TCs.” Either that or state what other facts color your opinion.
On the one hand, it does cut both ways. On the other hand, the simple fiduciary check very strongly suggests undercount.
This could be relatively easy to test. However, it’s important to not chop the season too finely or the statistical power of the test will be degraded. (If the power falls below 50%, the results are just as likely to deceive as enlighten.)
Thanks Judy-
If one rejects Solow and Moore’s work, that is fine, but it should be cited as part of the relevant literature. But this takes us to my recent draft paper …
http://sciencepolicy.colorado.edu/prometheus/archives/author_pielke_jr_r/001035draft_paper_for_comm.html
… which says that either landfall proportions should be assumed to be constant, or if not, the changes should be described by some physical mechanism before using the data in analyses underlying predictions. If you have rejected the first explanation (of constancy) then before predicting future landfalls as you have using an analogue approach (which depends upon constancy), then you would need to explain why we see the long-term trend in reduced proportions of landfalls in the US, which has been cut in half over the dataset.
I agree with you that analyses of hurricane data have now become more open, and indeed more democratic. this is a good think. But it will also mean tough questions for those who have used the data uncritically, which involves a very large part of the community.
Also, you may have missed it, but can you provide your definition of “landfalling NS”? Is it parallel to your “landfalling hurricane” definition, i.e., a TC that was at somepoint at NS intensity prior to landfall?
Note that according to this definition of landfalling H in your dataset 2002 appears to have 1 error and should be 3 instead of 4.
Thanks!
The big spikes “might” be related to PDO phase transitions.
I’ve updated the thread to show the same graphics east of 69W – quite interesting IMHO.
RE #23 Actually, I’m pretty sure that some papers include subtropical storms and some do not. I’ve stumbled across that when trying to reconstruct plots.
Regardless, here is the count of tropical storms (excluding subtropical storms) which stayed entirely east of 69W:
1920-29: 3
1930-39: 4
1940-49: 5
1950-59: 8
1960-69: 7
1970-79: 5
1980-89: 18
1990-99: 19
1996-2005: 21
My belief is that the post-1980 increase is from the newer-generation satellite detection and possibly greater interest in looking at and classifying weak, far-at-sea cloud masses.
To me, what Steve M has demonstrated is that the TC/hurricane data are very susceptible to cherry picking (intentional or not) by region. I believe that point was made early on in these discussions by both David Smith and Willis E. Now if the differences can be resolved and explained, the suspicion of cherry picking (intentionally or not) can go away.
I see these results of Steve M and David Smith as necessary sensitivity tests that surprise me that the others working directly in the field have not made — or at least made public to my awareness.
So the regional changes affect the data, but so would the way wind speed is determined as that is the sole basis for the categorization system. Change the wind speed used by one unit and a different category results. There was no response to my question about how wind speed in storm systems was detemined in the early data and whether it has changed both in the measuring and analsis since flights began. The differnce between surface wind speeds as estimated from aircraft and those actually measured on landfall suggest there are problems with the method of determining offshore systems. I also suspect it has been modified over time. I would further suggest that accurate determination of defnitive speed in a vast system in which significant gusting is occurring is anything but exact. The very structure of hurricane indicates the probelm. An Easterly Wave comprised of a line of cumulonimbus each with its own powerful internal wind system is drawn into a circle by increasing coriolis force to create a circular rotating sytem with its own structure and dynamics.
RE:#27 – have we sufficient knowledge to combine ENSO/La NINA, PDO, AMO and Artic Vortex data
to begin putting together a picture on which impacts directly or indirectly the other and do so without ignoring
solar influences? from the discussion maybe not?
Re #31 Tim, I think you’re hitting on another problem which Jean S also touched. These storms aren’t nice, neat discrete entities which can be easily sorted into bins for analysis. And historical measurements varied all over the place.
Pre-recon, storm strength may have been guessed based on the readings from an unfortunate ship or by land measurements. But, did those samples occur in the strongest part of the storm? Was the instrument designed for accuracy at very high windspeed? Was the sampling unbiased by local terrain? Was the record written or someone’s later recollection? The list goes on and on.
If it was based on damage assessment, the subjectivity involved is even worse.
Even with recon, even in 2007, recon flights don’t always have confidence that they’ve properly sampled a storm. I remember discussion on a 2006 hurricane where the analyst basically discounted the recon data, figuring that the plane had not sampled the right places.
One footnote that tends to get lost is that recon flights and practices were instituted and improved over a period of years, not all-at-once in 1944.
The historical data is a mess.
Sorry, slightly OT:
Here’s an article from 1973, on the benefits of hurricanes and the “Stormfury” project.
The Benefits Of Hurricanes
And this is interesting from it regarding wind:
I didn’ know this idea was somewhat successful 30 yrs ago. What I find amusing as well there’s not one mention of a “climatologist” only meteorologists and here they are worried about humans trying to control the weather.
What cat size was “Debbie” in these lists for 1976?
Re34: Correction, isn’t not Debbie 1976, it’s 1969-even more back in the way-back machine. sorry!
RE #35 Debbie (1969) was a category 3 storm.
The final word on Stormfury, from the NHC, is given here .
In addition to seeing no detectable change, I think there was also a feeling that the “First, do no harm” principle was important when dealing with a high-energy system like a hurricane.
And, what if a storm did something bad, totally by coincidence, while a Stormfury experiment was underway? The media would roast the experimenters alive using a skewer of public opinion.
#15. TAC emendations are needed to make the script turnkey. I was using objects that I loaded myslef. I’ve amended the script that I posted up. BTW the scripts directory is now searchable; I will be adding considerably to the scripts library over the next few months. I probably have hundreds of scripts of varying complexity that pertain to this topic.
David, thank you for your response. 🙂 (sheesh “isn’t not Debbie” I typed)
Yes, like the “prime directive” in the Star Trek lingo. I agree. Yellowstone history is good example of humans trying to manage nature.
It’s interesting for numbers like 10% and 30% become large or small depending on your POV in all these issues. “GW models corrected: 30% more heat attributed to the sun” or “or seeding reduced hurricane force by 30%- is small and not detectable. But when talking about human contributions or “bads” 10% and 30% change to something would be huge numbers!-also if we were talking about raising taxes! 🙂
SteveM: How come WordPress accepts your .LT. characters (the first half of a left assignment in R) and chokes on mine? What’s the trick? Thanks, TAC
David, this is a useful analysis. I am certainly prepared to believe that there is some undercounting here, but I am very dubious of a large undercounting in the 1970s. The procedures since 1973 and the satellite data since 1977 were pretty much the same as the 1980s (and not all that different in the early 70’s). And the procedures during the 1970s were certainly more robust than the earlier decades with higher counts. This issue is certainly worth looking at further to consider other issues of relevance that I cited in a previous post.
p.s. I don’t know of any papers that include subtropical storms in their analysis
Publish or perish.
Re #41 You may want to check Holland Webster (2006), Figure 1
Check 1972 , 1973 , and especially 1974 .
#44
Sorry, I was referring to the European Alps. The Swiss are sweating bullets as every year the glaciers recede a bit more. Three hundred years ago the Swiss were pleading with the Bishop of Geneva to go bless the glaciers so they would stop advancing. Every year the morraines would grow, destroying villages, grazing lands, and causing summer flash floods. I think it is safe to say that Bishop Francis De Sales prayers were answered.
#43
Bender,
I wonder if anyone will apologize to Dr Grey? Back in Nov of 2005 he appeared to be the only one to stand by the linkage of the 2005 Hurricane Season to the AMO.
Roger, thanks for the references to the Solow and Moore papers.
Judith, Solow and Moore 2000 seems on point to me. My split of track data at 69W ends up isolating somewhat the same phenomenon as the landfalling hurricane series. It’s reasonable to postulate that the data further west ( or the landfalling data) is less affected by measurement changes than the eastern data. It doesn’t seem to me that your reply to Roger is responsive to his issues.
You said:
As we’ve seen by simply doing analyses east and west of 69W, the problem is not just U.S. landfalls, but hurricanes E and W of 69W. On an a priori basis, I think that the onus is on the people arguing for a climatic trend to provide a climatic argument to explain the variance. If you want to argue AMO or whatever, so be it, but you can’t just ignore the problem, especially if it’s been raised previosuly in a rather small literature.
You said:
My perusal of Solow and Moore suggests that they are trying to use more homogeneous series to estimate less homogeneous series. In principle, that makes sense to me. IT makes sense whether or not HURDAT has updated the data or not.
What exactly are your objections to what Solow and Moore did? (That they haven’t been “referenced much” is not a reason that counts in this forum.)
In comment 16, Judy Curry suggested some of the change in the storm count data could be attributed to lengthening of the hurricane season, and suggests one might want to hold it constant. Specifically, she suggests:
Since I’ve been familiarizing myself with “R”, I decided to see how the analysis I performed yesterday changes if I discount hurricanes that occurred after June and before November. This holds the time period for hurricanes constant. Here’s the new figure:
Conclusion: If we hold the hurricane season constant, the number count as a function of SST remains depressed prior to regular aircraft reconnaissance. (This difference in the expected value of storms at a given SST is statistically significant to the 5% confidence level.)
Is anyone really surprised by the notion that hurricanes might have been undercounted before we started regular aircraft reconnaissance?
#46. Truth or Truthiness appears to be Margo’s new blog. Good luck, Margo
RE #41, #43
Here are some subtropical storms in the Georgia Tech database:
45455 TS
45460 05/23/1972 M= 7 01 SNBR= 973 ALPHA XING=1
46215 TS
46220 06/24/1974 M= 3 01 SNBR= 988 SUBTROP 1 XING=1
46240 SS
46245 07/16/1974 M= 5 02 SNBR= 989 SUBTROP 2 XING=0
46275 SS
46280 08/10/1974 M= 6 03 SNBR= 990 SUBTROP 3 XING=0
Perhaps there’s a flag that allows users to recognize and remove these or, as an alternative, they should be removed alltogether.
RE #49 Some clarification: in checking the read me file for the data, I see that this is a Tropical Prediction Center database, linked by Georgia Tech, not a Georgia Tech database.
The readme indicates that there is a “SS” indicator for subtropical storms. It may be that some researchers, like Holland/Webster, may not have caught that and therefore did not remove them.
Yes, it’s my blog! Thanks for the wishes Steve.
I didn’t really expect the blurb to appear in comments.
The blog seems to ping automatically to every article I link. (I’m used to blogs that keep the pingbacks and comments separate!)
I mostly set up the blog to have a place to put extra text I want to discuss, since, while graphs and figures can say a lot, it’s often best to keep longer discussions of t-tests out of comments. (I’m not really expecting many to read the stuff I stick over there.)
Margo,
the ping back is automatic unless you uncheck the “Attempt to notify any Weblogs linked to from the article (slows down posting.)” under Options, Discussion in your control panel.
Not that I mind, because the point of pingbacks is to draw attention to your blog from another.
A few random comments on recent postings:
In November 2005, the talk was about GLOBAL hurricane intensity. Blaming the increase of GLOBAL hurricane intensity on the AMO didn’t make sense then and doesnt make sense now. I would say the majority of people doing research on this topic would say that there is at least some influence of AMO on NATL TCs (but Emanuel and possibly Holland would not)
The apparent undercounting identified by Steve M and Margo accounts for about 1 TC per year, or about 10% of the total TC count. I spoke with Greg Holland last night, he said has been looking at the undercounting issue for about the last month, so far he is not coming up with anything more than 1 TC per year back to about 1900.
Note, it seems that Landsea is now making the argument that NATL TCs are undercounted and they should scale with the U.S. landfalling TCs. This argument won’t hold up.
With regards to Steve M’s idea that a trend of TCs west of 69W should be a good proxy for the trend of total NATL TCs, this almost certainly won’t hold up either.
Some physics. Both the landfall issue and the west of 69W issue are not simply a function of total TCs, but of the track of the TCs. For example, in the past 2 decades there has been a substantial increase in storms tracking into the Gulf (with proportionately more landfalls in central america than the U.S.) If we assume that the total TCS from 1980 to present are perfectly counted, you can see that the fraction of TCs E/W is substantially different for the 1980s vs the most recent decade. Two big factors arguably contribute to the different tracks on decadal time scales: AMO and AGW. So trying to get a better handle on tracks and what contributes to their variability during the period from 1960 to present (where the tracks are more credible owing to satellite data and missing a few weak storms will be pretty irrelevant in terms of tracks) seems to be the next step.
Re not publishing anything until everything is perfectly known would slow down scientific progress by decades. Publication of credible science is how science moves forward and is essential for the exchange of ideas, data etc in the scientific community. One paper does not comprise a theory, it is the accumulation of knowledge represented in the published literature that leads us towards truth and an accepted theory. When an issue is highly relevant like the hurricane-global warming link, the publication process seems frustratingly slow. the H/W paper, submitted early last summer and may not be published for another year (as part of a special issue) is already somewhat out of date based on Holland’s own research. Two strategies beyond the publication process: the blogosphere and the assessment process. The blogosphere is certainly fast, but highly unfiltered and prone to drawing premature conclusions and hasty generalizations. The CCSP synthesis and assessment report on climate change and weather extremes has just formed the committee, and one of the issues they will certainly assess is the hurricane data issue and the link with AGW. The lead agency for this assessment report is NOAA. for further info see
http://www.climate.noaa.gov/index.jsp?pg=./ccsp/33.jsp. of the people on this committee, I know of at least one person (Zwiers) who is very solid in terms of statistics.
#53. Judith, you say:
I haven’t studied the AMO and don’t have a view on whether it rises above a red noise process. My impression of Holland and Webster was that they explicitly renounced reliance on the AMO. For example, they stated:
BTW it will come as no surprise to you that I would urge some caution in relying on purported results from Mann and Emanuel. Mann said to the NAS Panel that he “was not a statistician” and Mann and Emanuel 2006 provides more reliable evidence on this statement than it does on hurricane attribution. I discussed Mann and Emanuel 2006 in an earlier note here. Mann and Emanuel had argued that the supposedly damped SST variations in the Atlantic tropics could be explained by introduction of aerosols into the regression ( an all too ubiquitous deus-ex-machina) whereas I pointed out that the observed SST variations were equally consistent with simply being in the tropics as I evidenced from results from the von Storch-Zorita climate model, stating as follows:
Now you’re under no obligation to read this site, but surely someone at Georgia Tech should check the regressions of Mann and Emanuel 2006 before propagating them further into the literature.
RE: #53 – Focusing on the oscillation pattern of only one ocean basin (or on individual basin’s patterns as if they were isolated stand alone mechanisms) may be a mistake. Perhaps, we need to move beyond looking at ENSO, PDO, AMO, etc and uplevel the perspective to looking at a multicomponent oscillation of the world ocean system. There may be overarching oscillations involving both the world ocean system and the world atmospheric circulation system. Perhaps a global view is the key to understanding the full impact and effect of the actual holistic mechanism.
Judy-
Thanks for this further information. Can you provide some support (data, analyses for these claims?
1. “you can see that the fraction of TCs E/W is substantially different for the 1980s vs the most recent decade.”
2. “NATL TCs are undercounted and they should scale with the U.S. landfalling TCs. This argument won’t hold up.”
Why should there be a long-term trend in landfalls or 69W +/-? And what should that trend be?
Thanks!
Steve, I have stated many times that I don’t agree with Mann/Emanuel. They raise a valid point that it is difficult to deconvolute the AMO from the AGW signal in NATL solely by using SST. This issue remains a topic of debate. My personal opinion is that the AMO has a small but significant signal in the ATL tropical SST. But the AMO may influence TCs in other ways, possibly by setting up a SST temperature gradient that influences atmospheric circulation. I have stated many times that I think you need both AMO and AGW to explain what is going in with the ATL TC stats.
My specific concerns about M/E are that the hemispheric temperature trends can’t explain the big dip in NATL tropical SST circa 1915, and also arguing that the tropical NATL has more aerosol in the 50’s and 60’s makes no sense, unless somehow there is a trend in saharan dust (i.e. more saharan dust in the 50’s and 60’s).
As for propagating this reference in the literature, they raise an important point in terms of the difficulties of separating AGW from AMO. If my ideas on this turn out to be correct (and they turn out to be incorrect), then the paper will cease to be references. I would also add that I am not actively conducting research on this topic at this time. Hurricanes comprise 1/6 of my research program, and I’ve said previously i don’t even have funding to conduct this research. But courtesy of the blogosphere, I have a place to air my ideas and others can play around with them if they are interested.
p.s. and I will be interested to see if we can convince Holland (who seems to be more in the M/E camp) that the AMO+AGW is the better explanation.
Roger, in the context of this blog I am not playing games with xcel spreadsheets in real time, nor am I even capable of posting here plots that i do have (without going to efforts to learn various web things that would not be a good use of my time and that I pay other people to do for me). I am giving you my ideas and assessments, you can check them yourselves if you like. I stated previously that I have 2 new M.S. students that will be playing around with some of these issues over the next few months. Holland seems to be actively investigating this general issue, these are the kinds of tests that he is looking at. Whether he chooses to participate in the blogging activities remains to be seen (I doubt it). Whether he chooses to make what he does public in future prior to publication remains to be seen.
Steve S, a number of people have tried to look for global ocean oscillations. They haven’t found any, but that isn’t to say that people shouldn’t keep looking. There are reasonable reasons to expect individual oceans to have unique modes of internal oscillations, although through teleconnections some of these appear to have have a broader impact (El Nino is certainly an obvious example of this). These internal oscillations are manifestations of coupled atmosphere/ocean interactions in a nonlinear chaotic system. These internal oscillations by definition are not forced and hence in principal could disappear or change substantially in altered climate regime. AGW might very well change the AMO, ENSO, etc. or we might see substantially new modes appearing.
RE: #60 – How would you proposed looking for global oscillations, in particular, ones involving both the oceans and the atmosphere? As I see it, it is a non trivial excercise. Simply determining what are the characteristic parameters to measure would be a challenge. Precisely because it is a non linear chaotic system.
Judy, if your talking to Steve M and not Steve B, I should be surprised by the dismissive reaction.
I would think that these findings and David Smith’s in comment #29 certainly throw caution at any selective use of the data in testing theories — without a better understanding of the processes involved. Can you recollect any others in the field who have put forth increasing TC theories with time and SST doing similar sensitivity studies?
Judy-
re: “I am not playing games with xcel spreadsheets” Ouch! 😉
You write with such certainty and authority; I had assumed that you had data and/or analyses to back them up.
Judy,
Re #59.
No one has suggested you should “play games” applying standard statistical test to data using statistical tools provided in EXCEL. You are free to do whatever you wish.
However, you suggested test regarding undercoutning storms should be performed over a shortened season and that such a test would result in a robust comparison. I took up your suggestion about eliminating the June and November and test it out, for what it’s worth. It happens that the test you suggested would be robust continues to indicate storms were overcounted.
For the record, I think it’s splendid that someday, you will assign graduate students to do similar sorts of fiduciary checks on data. It would have been even more splendid if those who have published and / or submitted multi-author peer reviewed papers that assume the storm counts were not undercounted prior to 1945 had tested that hypothesis publishing and making confident claims based on that assumption.
Though I am sure someday your MS students will do a splendid job testing the quite speculative assumption that storms were not undercounted prior to regular air craft reconnaissance, I don’t see any reason why I and others should not to take up some of your excellent suggestions and perform the simple analyses using EXCEL — particularly when these analyses take less than an hour and the computations are standard practice.
re: Excel Spreadsheets
Dr. Curry,
Well, I’m not a climate specialist, except on a low level as a hobby, but surely a little familarity with such a standard tool shouldn’t be too much to ask. I had a boss; great guy and personable, but he’d never learned to type which seemed strange to me. Now-a-days you have to pass a typing class to get into kindergarden [g]. Perhaps you’re older than I have imagined. But I just turned 60 and I’ve been using Excel and it precursors for 20+ years.
Anyway, it’s not hard to learn Excel and even easier to be able to operate R, which Steve M recommends.
Here’s a statement from H&W which symbolizes the problem with this paper for me:
The issue is surely more nuanced than this: it’s how to differentiate a forced trend from natural variability given the possible existence of trends and/or changes in measurement technologies.
#56, 59.
Roger, you said to Judith:
Judith replied:
Unfortunately (or perhaps firtunately) I don’;t have two grad students to do my calculations for me and thus am obliged to do my own calculations, which, in this case, can be done more quickly than it would take to specify the calculation to a third party (mostly because I’ve made an organized data set of track information.) I previously posted up a short script to count storms and hurricanes E and W of 69W (using definitions in earlier post.) I did a short calculation in which I calculated the difference between east and west storms (hurricanes). I first calculated ratios, but differences seem more interpretable. This yielded the following graphic. I’ve inserted bars showing the mean differences in the 1980s, 1990s and 200s to illustrate Judith’s assertion that there was a “substantial” difference between the 1980s and subsequent decades. I’m not sure exactly what Judith meant by “substantial”, but I’d be inclined to say that the average difference in the 1980s was not substantially different from the average difference in later periods. However, the average difference in the aircraft reconnaissance period does appear to be substantially different from the average difference prior to the aircraft reconnaissance period (“regime” if you prefer.)
I am not venturing any opinion as to whether that difference results from climatological factors as argued by Judith or merely from the introduction of the aircraft reconnaissance regime. I do claim that proponents of claims for a “strong statistically significant” trend need to explain such matters (which are very much related to landfall time series that already exists in the literature.)
Figure – Atlaintic Basin – East storms minus west storms (hurricanes). A storm (hurricane) can be in both east and west data sets as defined previously.
May I suggest median smoothing of the spectrum ? 🙂
re pielke 63, dardinger 65
Curry says she isn’t going to be playing excel games in this context in real time, but she will be assigning grad students to look at those issues – in other words, applying some thought and time to them.
[snip – Lee, if you wish to comment on statistics, OK. I’m trying to keep at least a couple of threads free of this type of picking fights.)]
Judith, if you wish to link to a graphic
Re Judy’s comment 53:
Before lopping off the months of June and November (as per our suggestion), my analysis suggested an average undercount of 1.6 per year. Afterwards lopping off June and November, it suggests and undercount of 1.3 per year. However, after lopping off June and November, the total number number of storms was reduced also. So, in both cases the undercount appears to fall between 15-20%.
It will be interesting to read what Holland comes up with when he completes his investigation. Given the snippy tone he and Webster assumed vis-a-vis Landsea’s discussion of the possible problems pre-1945, I’m surprised the two authors didn’t look at this before doing a bunch of time consuming analyses, writing a paper and then submitting said paper for peer review (evidently last summer) and then posting the paper on the web last month.
Examining these issues now gives the appearance that neither Webster or Holland thought to test the major assumption underlying the bulk of their analysis prior to submitting their paper for publication last summer. That’s a problem no matter what they conclude about the differences.
That Holland only began looking at this last month– possibly after Roger Pielke and visitors to Prometheus discussed the controversy over there looks very bad.
That he is looking at it only after public comment will also make some readers suspect Holland and Webster’s objectivity when making conclusions, since admitting error after having a paper accepted and presented to the public is often embarrassing for authors.
Why not? I could see where the argument may be imperfect. That said, the fiduciary checks suggest an undercount on the order of 1.6 storms per year and that “missed storms” were out east and did not make landfall.
You provided an interesting discussion of physics, but … so?
Many might suspect the hurricanes that were missed prior to air reconnaissance occurred where no one was looking. Because this error mechanism has nothing to do with the “physics of hurricanes”, there is no reason to believe the magnitude and location of undercounted storms is strongly affected by physics.
So, what provide a physical argument? (And of course, if your physical argument is: storm counts and locations vary for reasons we don’t know, well yes. But that cuts against making the claim that you can detect whether or not AGW has lead to increased hurricane counts!)
Who said one shouldn’t publish anything whenever the feel their work is ready to publish?
Everyone should feel free to publish what ever they wish. One would hope, however, that the statistical studies to back up the the major assumption underlying an analysis discussed in a peer reviewed paper would be done prior to publication. One would also hope the peer reviewers’ would catch the lack of rigor in the analysis; when the reviewers do the job they are supposed to do, they spare the authors the embarrassment of having to retract papers, or explain the gaps.
More importantly, when the peer reviewers are inattentive and science that is not credible, they slow the progress of science– sometimes by decades.
Still, everyone knows peer reviewers are often busy, sometimes take forever to review papers, often review them quickly only after the journal editor reminds then several times, and then miss these things. As a result, things slip through. It’s a shame, but it’s been the system for a while, and many are used to it.
Steve: [snip- Lee, if you want to pick a fight, go to the Unthreaded post. )
Margo, I would like to point out the different perspectives of someone trying to play statistical gotcha vs someone who is trying to understand what is going on in nature. Your original plot suggests a trend of 5 TCs per 1C SST increase. If there is a systematic 20% undercounting earlier in the record (which is probably the maximum; i suspect 10-15% is more realistic), then there would be a trend of 3 TCs per 1C SST increase. Not a decrease in TCs, not a zero increase in TCs, but still a significant increase. An increase of 3 (or more likely IMO 4) TCS per SST increase is still a very interesting increase.
Before assessing the undercounting issue and its impact on the correlation, multiple tests will need to be applied and some physical understanding of the results plus procedures of observing the storms will need to be used in assessing a range of likely undercountings and how this has varied over time. Your graph is one of about 6 such tests that i can think of.
So H/W put an important idea out there regarding the correlation of SST and TCs. Subsequent analysis is suggesting some ways to nail down the uncertainty on H/W’s analysis. Sounds like a good way for science to proceed. Should H/W be criticized for not doing all this in the first place? No. It wasn’t until these results were presented that people were motivated to take a serious look at undercounting in the historical TC data base (beyond the solow/landsea assumption that total NATL TCs should track the U.S. landfalling TCs). Have H/W’s analysis of this correlation and trend been refuted? No. The correlation is there, you can argue about the significance. the regression line is positive, you can argue about the magnitude of the slope. People will work on this, and it will eventually get sorted out. That is how science works.
Steve, unfortunately the technical problem re posting is on my end, i can’t post things to my website at GT from off campus (firewall stuff). I will get my web person to post some stuff on my web site, but it won’t be quick turnaround.
Hope you don’t mean “significance” in the statistical sense.
Respectfully, Dr Curry, this is not about “how science works“. This is about how science is interpreted to influence policy. Science that is half-cooked should not have as much influence as science that is rock-solid. It’s as simple as that. This is not about climate science; it is about what climate science makes it to IPCC, and how it is presented and interpreted there.
The hockey stick – produced by a rush to alarmism – had a lot of policy influence that it should not have enjoyed. The question being asked now is “what other policy-influencing hockey-stick peddlars are out there?”
It is highly disturbing to witness a climate scientist revealing a belief that there is some sort of “statistical gotcha” bogeymen somehow in contrast with some sort of “honest science” or even “nice science.” One person’s “statistical gotcha” is my standard quality control element / peer review gate. Sad state we are in these days, with arm waving and computer shananigans substituting for real science. We knew it would come to this when the Neojacobins sufficiently inflitrated science. Well, on that note, I will slink back into lurker mode due to more pressing concerns. Good day all.
Judy Re 73:
1. Your comment to the contrary, I am not attempting to play a statistical “gotcha” game. Knowing the magnitude of the undercount would be important to developing an understanding of the physics. Ignoring the magnitude of the undercount when testing hypotheses is detrimental to developing an understanding. People know this.
2. With regard to this:
What in the world does the slope in the number of storms vs. the SST have to do with the miscount? The slope could be 0 TC’s per 1 C SST increase, and there could still be a miscount. You’d see it in the difference in the mean number of hurricanes detected during the two time periods.
The magnitude of the under count has nothing whatsoever to do with the slope of the curve.
3.
Would the tests Steve is doing this minute number among the other 5? If you’ve thought of 4 more can you name them? Soon?
You admitted you had not even thought of the test I did until I posted it. Hopefully, the little test you suggested in #73 is not one of the four. It is so fundamentally unsound that, should you publish it in an article, the comment criticizing that idea is likely to follow immediately on the heels of the publication.
As to this:
What “important idea”? Were H/W the first to advance the idea that TC’s increase with increasing SST? Or hurricanes increase with SST?
I thought that claim had been advanced repeatedly by many!
As far as I can tell, no one is criticizing H/W for that particular idea.
Many would criticize H&W for basing an entire analysis and numerous conclusions on an entirely untested, and in my opinion, fairly implausible hypothesis regarding data quality prior to 1945, and then not testing the hypothesis prior to publication.
If H/W did not test the hypothesis prior to writing their paper and submitting it for peer review, they deserve criticism.
Is it my misunderstanding, or is there a disconnect in this argument about the numbers of TCs increasing with time/SST? Dr. Curry, I am assuming, is referring to the period of the early 1970s to the present to establish her claims for the relationship that she quotes and does this with the claim that TC data has reason to be “good” in this period because of changes/improvements in measuring processes. HW in there draft went back further in time assuming TC counts were reasonably comparable over the time period studied.
Using land falling TC and hurricane counts, as an indicator of either past undercounts or changes in portion of land falling TC/hurricanes to total numbers over time going back to the late nineteenth century, would indicate that there is reasonable doubt that storms where counted as efficiently and completely in the past as they currently are. The trends from RPJ and Dr. Curry’s data, and with the differing definitions they use, indicate no trend over time in land fall TCs/hurricanes. One could assume, without having an explanation for a changing ratio of total TCs/hurricanes to land falling ones, that that trend would imply that a significant and/or measurable increase in TCs/hurricanes has not occurred overtime and more strongly that the independent counts of TCs/hurricanes over time has changed in detection capabilities. The evidence presented by Steve M and David Smith of the TC counts east/west of 69W over time, and even the post early 1970s times, also adds credibility to the above explanations.
My point would be that HW and Dr. Curry’s conclusions seem much less certain in face of these sensitivity tests and any logical discussion, at least at CA, should include references to them.
My reference to Steve M and Steve B in an earlier post was an obtuse attempt to point out that Steve M is much less likely to be dismissed in his auditing work by the author, while Steve B seems, in my view, to look unfavorably on CA participants when they attempt to question the works of authors (primarily related to climate) without having demonstrable professional qualifications. Nothing more and nothing less was intended. This view probably fits Dano even better, but his presence here may all ready be forgotten.
Ken,
When Judy suggested my anlysis indicates a 1 storm/year undercount, I assumed she was commenting on what my graph and analysis were purporting to show: There was an undercount prior to 1945. You will note that when she suggested my graph indicates a 1TC undercount, she referred to Holland examining data back to 1905. So, I think she understands that I am discussing the undercount prior to 1945.
As it happens, my figure also includes the figure she quotes: the slope relating the number of storms to SST is roughly 5 storms per 1 degree SST. So, the fact that she refers to this slope does not suggest she is talking about something other than my graph.
That said: the magnitude of the slope has very little to do with my determination of the magnitude of the undercount that likely occurred prior to regular aircraft reconnaissance. The slope is affected by climate physics. The undercount is due to the “if you don’t look, you don’t see” phenomena.
The undercount is not strongly affected by sea surface temperatures.
As it happens, Judy is describing how to calculate something it’s just not the undercount! If you postulate that the SST has increased by 0.2C, then we expect the actual number of storms will increase by 1 storm per year. This represents the real change not the undercount
However, if we examine the data, the measured change appears to be 2.7 storms per year. But, the “measured” change is the sum of “the real change” and “the undercount”. Subtracting, we get an undercount of 1.7 storms per year. Note: very close to the value I get using my method. (My method has the advantage of providing statistics that permit a t-test,and letting me keep a larger number of significant figures.)
The undercount prior to 1945 appears to be 1.6 storms/ year.
Re: #80
The evidence from Steve M, David Smith, RPJ and Dr. Curry could be used in my view to indicate the TCs were under counted after 1945. How would undercounts after 1945 affect your methods and conclusions?
I haven’t looked into undercounts after 1945.
However, the simple test I did actually detected the number of undercounts pre-1945 relative to what happened after 1945.
It treats the entire “pre-1945” region as on group and the entire post 1945 as a different group. So, assuming “after-1945” is counted “just right”, then there was a 1.6 storm/year under count (on average) before 1945.
If there is an average undercount after 1945, (say, on average 0.2 storms a year over the whole period) then, the undercount pre 1945 would be 1.6 + 0.2 = 1.8 storms/year.
In principle, one could try to slice the time period into smaller batches to find different under (or over) counts pre-1945, 1945-1960, 1960-2005. In practice there is a limitation, because at some point the method loses statistical power– meaning the expected ‘beta’ error gets too high and we begin to study noise.
Even without doing any numbers, I’d be very leery of trying to divine anything for a period of less than 10 years. I’m not so sure about 20.
Margo,
Dr. Curry’s point loosk simple and understandable enough to me.
She is looking at your analysis, which implies an undercount of about 1 1/2 TCs, PROVISIONALLY ACCEPTING IT, and then pointing out back to you that if you corrrect for that, ie, add the 1 1/2 TCs into the pre-1945 record, that one STILL gets a positive correlation between SST and TCs.
IOW, the undercount you may have identified does nto alter the analysis.
Dr/ Curry isnt claimiNG that the slope somehow affects the undercount. She is saying that accepting AND APPLYING AS A CORRECTION the undercount you identify does not reduce the slope below an interesting value.
Lee:
I think you are misunderstanding the argument in several ways:
First: Judy is arguing that the undercount I found may be incorrect. Neither she nor I are arguing about the existence or magnitude of the slope. (Judy and I both agree the correlation exist. Judy and I both agree my analysis suggest it’s about 5 SST per 1 C.)
Second: I think some of the confusion is arising because Judy said this:
While Judy’s statement may seem like a throwaway comment, it tends to suggest that H&W is actually about the correlation between SST and TCs, or that H&W “put the important idea out there”.
As a result, it is natural for readers to assume that the Judy and I are arguing about the existance and magnitude of that correlation, the importance of the idea or what not.
We aren’t.
We are arguing about the magnitude of the undercount.
The reason we are arguing about the magnitude of the undercount is this: To indentify “long period variations” in storm frequencies, “climate cycles”, “hurricane oscillation” and diagnose “antropogenic global climate change”, H&W assumed the undercount does not exist.
If the undercount exists, those claims are tenuous.
Since I do like to go on and on, I would also like to suggest that if Judy were at a conference with her peers, she would likely take more care and avoid suggesting H&W paper is “about” the correlation between SST’s and TC’s. If that is all H&W is “about” then H&W is an entirely trivial paper that makes no new significant or midly interesting contribution to understanding of climate science.
Margo –
“If there is a systematic 20% undercounting earlier in the record (which is probably the maximum; i suspect 10-15% is more realistic), then there would be a trend of 3 TCs per 1C SST increase. Not a decrease in TCs, not a zero increase in TCs, but still a significant increase. An increase of 3 (or more likely IMO 4) TCS per SST increase is still a very interesting increase.”
That quote explicitly assumes the undercount, and discusses the impact of it on the overall argument.
Lee:
Thank you for providing me the opportunity to elaborate on Judy’s tendency to divert attention from the true argument by resorting to rhetorical ploys.
In the text you quote, Judy has introduced a strawman (i.e. non-existent) argument. She then presented a counter argument to the strawman.
Her strawman: She introduced the idea that someone, somewhere is suggesting TC is not correlated to SST. No one has argued that correlation does not exist. I certainly have not. Everyone agrees the correlation exists and that it is notable. Everyone has agreed on this since well before H&W wrote their paper.
Her counter argment “proving” the correlation exists has no relevance to my contention that there is an undercount and that the undercount is readily apparent. It has no relevance to the quality of H&W’s paper.
The correlation bewteen SST and TC is not H&W (2006)’s claimed contribution to the literature. Showing this correlation exists cannot salvage their paper.
Because it is clear that you, Lee, fell for the rhetorical ploy, it is possible other readers did as well. So, I’d like to suggest that I sincerely doubt Judy believes H&W is “about” TC vs. SST or that the contents of H&W can be salvaged by noting a relationship between TC and SST.
I hold this opinion because anyone who reads H&W and thinks H&W can be salvaged by showing TC’s increase with SST has fewer than 3 functioning brain cells in their head.
Of course, Judy may return and correct my impression, telling us that H&W is about TC vs. SST. That would provide us all with data.
For the record Lee, you may continue to quote Judy’s strawmen over and over, and Judy is free to use these rhetorical ploys when she wishes. However, should you invite me to specifically address something that is no more than a rhetorical ploy, I will be happy to address the issue. At length. 🙂
Margo, are you seriously arguing that there is no dispute as to whether the seasonal number of tropical cyclones will increase / have increased as a function of increasing SSTs?
This is at the root of the entire dispute about a link between AGW and posible increase in numbers of TCs. It is precisely the point that I frequently see disputed – the question being whether SSTs have enough influence to make a difference in the face of other necessarry condisint for TC formation and growth.
—
in 78, you said (emphasis added):
“1. Your comment to the contrary, I am not attempting to play a statistical “gotcha” game. Knowing the magnitude of the undercount would be important to developing an understanding of the physics. Ignoring the magnitude of the undercount when testing hypotheses is detrimental to developing an understanding. People know this.”
– but in the quote I supplied, Dr. Curry said – lets correct for the undercount you seem to have found, and see if it makes a difference to the analysis. She isnt sayign the undercount isnt important. Seh is saying it isn’t large enough to change the conclusion, even if one accepts your value for the undercount – that is a completely different claim from the one yo seem to hearing her say.
“2. With regard to this:
If there is a systematic 20% undercounting earlier in the record (which is probably the maximum; i suspect 10-15% is more realistic), then there would be a trend of 3 TCs per 1C SST increase.
What in the world does the slope in the number of storms vs. the SST have to do with the miscount? The slope could be 0 TC’s per 1 C SST increase, and there could still be a miscount. You’d see it in the difference in the mean number of hurricanes detected during the two time periods.”
-She isn’t saying the slope ahs anything to do with the miscount. She is saying the miscount doesn’t alter the overall slope enough to change the analysis. She is saying that the undercount of earlier TCs with cooler SSTs that yo find, when corrected, reduces but does not eliminate the relationship she is looking at. In doing so, she ACCEPTS your undercount claim, at least for this purpose.
Lee:
Should Judy return back and say really seriously thinks the argument is about the affect of the uncertainty on the slope of the correlation between storm counts and SST, I will be happy to continue this discussion.
Lee, your interpretion is correct. The main thing of interest is the slope.
Judy re 89:
Do you mean that slope is the point of main interest in Holland and Webster? (That was the subject were were discussing?)
If yes, do you have Holland and Webster 2006 handy? Might I suggest you click here, download the paper and re-read it.
Begin by reading the abstract, which starts:
It continues in that veine, and as far as I can determine never mentions this “main point of interest” (i.e. the slope relating ToC and SST).
But who knows, maybe my reading has been cursory. So do read it, then me know if you find any direct mention of this sois-dissant “point of main interest” in: a) the abstract, b) the conclusions c) andy of the 8 figures or the text.
When you are finished, please return and tell us where you found any direct mention of that “main point of interest.”
Meanwhile, I will assume you misunderstood the exchange between Lee and myself and did not realize we were discussing the main point of interest in Holland and Webster 2006.
Margo, in a broader context (and implicitly in W/H), the slope is of great interest. In W/H, the regime stuff is leading up to the following “punch line” in the conclusion
3. What are the projections of tropical cyclone and hurricane frequency and
intensity, given an accelerating increase in SSTs associated with greenhouse
warming? We have noted that the current climate regime seems more indicative of a
transition phase than the settling into a new steady regime. Whether this will stabilize
soon, or continue to increase is a matter of great scientific interest and a matter of
considerable concern for coastal communities in the impacted regions. If we project
past increases forward, then an increased SST over the next 50 years of, say, 1-2oC
could lead to an average of 20-25 cyclones and 10-15 hurricanes per year. This
conclusion raises another question; are there inhibiting factors that will impede this
potential increase?
Judy:
1. No one is saying the slope is not of great interest in the “broader” context. What is in dispute is the main contribution of H&W’s paper and whether or not their failure to consider the undercount prior to 1945 puts their findings in dispute.
2. Your quote fails to show the slope is the point of main interest to H&W 2006.
If you wish to be appear disingenous on a blog where you do not have the power to delete your comment, that is your choice. You will no salvage the contents of H&W this way.
Margo, I have no problem understanding Judy’s point even though I have no claim to expertise in tropical cyclones or statistics. (Just out of curiosity, do you have any background in the former?) Perhaps you could explain how your assertion that Judy “wish(es) to appear disingenuous” is different from an accusation of just plain lying. Alternatively, you could stop hair-splitting words and instead just deal with substance.
Steve:
Substance? I’d happy to switch to that, but we are well down on the thread and I’m going to be addressing the problems with H&W elsewhere and that’s the real argument. 🙂
For the record, “being disingenuous” is not exactly the same as “lying”. But, I will also not argue about that.
I will however, mention that I think that expertise in cyclone physics has anything to do with the line of argument above? I think those who have studied both viscous flow, inviscid flow, heat and mass transfer and are familiar with the meaning of the terms like “vorticity”, “deformation rate tensor”, “turbulence closure models” and are familiar with the Richardson, Prandlt and Reynolds numbers, will say those topics have nothing to do with the discussion above.
Shoot. Make that: I don’tthink that expertise in cyclone physics has anything to do with the line of argument above?
Re 44, it was Bishop Charles de Sales in June, 1644 who blessed the Les Bois glacier. Bishop Francis de Sales died in 1622.
GO MARGO.
Personally I think the money would be better spent on Tsunami inundation maps, risk evaluations, paleotsunami studies, etc. But thats only based on the ugly reality of loosing 230,000 humans and countless $$$ in property a couple years ago.
Currently, no So Cal County wants to or see’s a need for these types of studies. Makes me sick. Lets just worry about AGW
3 Trackbacks
[…] Steve McIntyre of Climate Audit has shown there is a sudden easterly trend in hurricanes and tropical storm tracks between 1944 and 1950. This happens to coincide with the period when regular air reconnaissance was initiated. It is also the dividing time for the change in the relationship between “number of storms detected” and “sea surface temperature” which I showed yesterday. […]
[…] 1. Discussion of the “central findings” of H&W at Climate Audit. […]
click here…
It is difficult trying to calculate the time we have exhausted searching for hydroponics gardening research….