Here’s an interesting SST proxy from the Gulf of Mexico that I meant to report on last October, but is actually more timely now given our recent discussion of hurricanes. When I corresponded with Lloyd Keigwin around the time of the Juckes submission, he mentioned a “beautiful” unpublished high resolution core from Poore in the Gulf of Mexico, which, with a little detective work, turned out to be a core in Pigmy Basin which Poore and associates (Julie Richey) had put online as a poster.
Julie Richey made an excelllent presentation at my AGU session which I noted up here (comment=73623). While the proxy is interesting in itself as a high resolution proxy showing a MWP, it is of extra interest because it is located in the Gulf of Mexico just to the west of the Katrina-Rita hot spot as readily seen if you compare the location map below to the hurricane hot spots, for example, here. (The core in Richey et al PBBC1 is not shown in this location map but is also in Pigmy Basin nearby.)

Poore et al 2004 Figure 1. Location Map. Rita and Katrina “hot spots” were just to the east of the Pigmy Basin cores
At AGU, Richey presented a high resolution Mg/Ca proxy from core PBBC1, Pigmy Basin, Gulf of Mexico. The sedimentation rate was 43 cm/kyr, sampled at 0.5 cm intervals, achieving a resolution of about 12 years per sample. The radiocarbon reservoir used was 400 years. She reported that the MWP nearly a degree warmer than coretop; that the period 1000-1400 was as warm as the late 20th century while the LIA was about 2 degrees cooler than modern. She said that results were replicated in G ruber white and G ruber pink. These statements are also made in the online poster which also says that the SST record corresponds to sunspot maxima and minimia and that their are Strong links between the Icelandic Low and changes in GOM oceanography at 600 yrs BPRichey et al Figure 3 excerpted below (modern at left) shows a sharp decline in percentage G sacculifer (a warm-water proxy) around 1400AD, with a corresponding decrease in dO18. Richey et al say that
the relative abundance of G. sacculifer in Pigmy Basin Basin sediments indicates the influence of Caribbean waters in the GOM, and is related to the average position of the intertropical convergence zone (ITCZ), with increased abundances indicating a more northward position of the ITCZ (Poore et al. 2005).The àŽàⲱ8OG.ruber record is influenced by changes in both temperature and àŽàⲱ8O of seawater
She synchronized these changes to a synchronous change in sea-salt sodium (ssNa) in Greenland, related to development of a more pronounced (deeper) Icelandic Low, resulting in increased winter winds blowing from the North Atlantic onto Greenland, increasing the ssNa content of the ice, concluding that there was a close linkage between atmospheric circulation in the N. Atlantic and subtropical Atlantic and that there was a southward shift around 1400AD in the mean position of the ITCZ coinciding with the intensification of the IL.
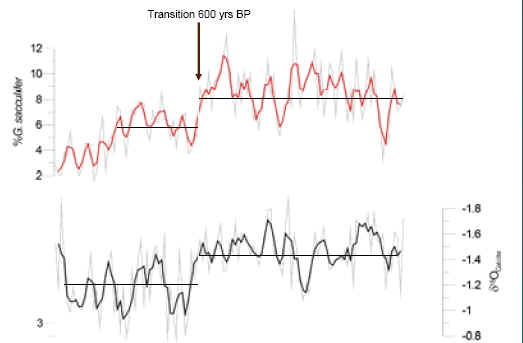
Richey et al Figure 3. Relative abundance variations of the planktic foraminifer Globigerinoides sacculifer and àŽàⲱ8O measured G. ruber (white variety) in core PBBC1 plotted against calibrated years. Solid line is a 3-point running average. Bottom panel shows sea-salt-sodium (ssNa) record from GISP 2 ice core. The ssNa record is a 20-year smoothed version, resampled at 6-yr resolution, and is plotted against the time scale for GISP 2 (from Meeker and Mayewski, 2004).
Richey et al Figure 4 shows high values of Mg-Ca estimated SST, concluding that:
“⡔he high Mg/Ca values between 1000 and 1400 yrs BP indicate that SST in the northern GOM during portions of the MWP were warmer than near-modern SST.”⡍inimum Mg/Ca values between 300 and 200 yrs BP indicate that SST in the northern GOM during portions of the LIA were at least 2 to 2.5oC cooler than modern SST.
“⡔he Mg/Ca record does not show a significant feature at 600 yrs BP when major shifts are seen in mean values of the àŽàⲱ8O and G. sacculifer records. Thus the intensification of the IL and southward shift of the ITCZ at 600 yrs BP did not have a significant effect on SST in the northern GOM.
“⡉n general the Pigmy Basin record does not show a systematic relationship between temperature and salinity on multi-decadal to centennial timescales.

Richey et al Figure 4. Mg/Ca, àŽàⲱ8Ocalcite for G. ruber (white variety), and calculated àŽàⲱ8O seawater in PBBC 1. The Mg/Ca record is plotted with the corresponding SST values on the secondary axis, calculated using the equation Mg/Ca=0.449exp(0.09T) (Anand et al. 2003). Using both the àŽàⲱ8Ocalcite and derived SST values, we calculated àŽàⲱ8Oseawater using the equation SST(oC)=14.9-4.8*(àŽàⲱ8Ocalcite-àŽàⲱ8Osw)+.27 (Bemis et al. 1998).
Richey et al should be advancing to publication in 2007. She mentioned that one of the referees was extremely severe and ended up delaying publicaiton of results that usually proceed without interruption. For reference, here is Keigwin’s figure from the Sargasso Sea (note the different scale) also showing a pronounced MWP.

I presume that these elevated SST would be sufficient to generate lots of medieval hurricanes, in fact, lots of cat 4-5 medieval hurricanes. There has been some work done on “paleo-tempestology” attempting to quantify past hurricane activity from sand bars and similar evidence, which I may get to on some future occasion. The implication of a relationship between SST and hurricanes (which I find intuitively plausible notwithstanding concerns over HWC statistical methods) is that there should have been high levels of medieval Atlantic hurricanes.
References:
Julie N Richey, Richard Z Poore, Benjamin P Flower, Terrence M Quinn, A 1400-year multi-proxy record of climate variability from the Northern Gulf of Mexico URL
Poore RZ, Quinn TM, Verado S. Century-scale variability of the Atlantic Intertropical Convergence Zone linked to solar variability. Geophysical Research Letters, 31, 1-4, 2004. URL SI – radiocarbon dates:


94 Comments
Love the solar connections!
Speaking of solar connections, the figure left out the current Solar Maximum. Solar activity for the past few years has been unprecedented in a milennnnium. It is extremely unlikely that the correspondence between temperatures and the solar activity shown in this figure is due to chance! I simply can’t see how anyone can deny that the primary driver of climate is the Sun.
Re #2: “I simply can’t see how anyone can deny that the primary driver of climate is the Sun.”
[snip – too much politics]
jae:
The Dalton Minimum was left out also, which started in 1798 and went to 1826. A dip in SST shows in the graphic starting about 200 BP. Some scientist are predicting that Solar Cycles 24 and 25 could repeat the Dalton Minimum. We should know in about 5 years. If cycle 24s sunspot count rises rapidly, it is most likely not the start of a new minimum. A slow rise and it is a different story. The whole AGM argument could be come a historical footnote.
jae (posting 2): You say “Solar activity for the past few years has been unprecedented in a milennnnium.”
Where on Earth do you get that from? See:
http://en.wikipedia.org/wiki/Solar_variation
It looks to me as if the maximum was just after 1950 and not “for the past few years” – and it was then at about the same level as around 1780.
Come on Steve – I thought you jumped on people who talked in terms of “unprecedented in a milennnnium” – or perhaps only when it helps your case to do so?
Jim: here’s one citation here. I had a better one, but can’t find it right now. Will try later.
Jim: The recent increase in Solar activity may be over, and some scientists think we may start seeing cooling. This may reveal some interesting information on just how much GW is from A. BTW, this article is an excellent easy to read summary of a lot of solar science/theories.
On the solar front, I was merely reporting what the authors said, not attempting to survey solar arguments pro and con. Please consider both my report in those terms. The article itself merely provides an indicative relationship to solar proxies and is hardly conclusive. This doesn’t seem like a useful thread to exchange biased views on solar matters.
Jim: BTW, when I say “solar activity,” I’m not just talking about sunspots, but the about this combined with shorter solar cycles and fewer cosmic rays. It looks like all of these things have a compounding effect on climate. Here’s another interesting article. Sorry about being OT so much, Steve. I’ll shut up now.
#9. I promised a solar thread a long time ago and I’ll put one up soon.
Oops, sorry Steve. I was typing that up while you posted about not wanting the OT solar discussion. Feel free to move it or delete it.
“Long-term solar activity reconstructions: direct
test by cosmogenic 44Ti in meteorites”
I. G. Usoskin, S. K. Solanki, C. Taricco,4, N. Bhandari, and G. A. Kovaltsov
In Astronomy and Astrophysics (A&A) 457, L25–L28 (2006)
Is one source of information on solar peaks in the last 1000 years.
Re #5
Jim Barret,
Jeez, at least make an effort my man! If you had but scrolled down you ‘d have your source.
Cheers,
Earle
Re: Ritchey et al Figure 3
This figure bothers me a lot. Phase shift matching seems to me to be nothing more than a qualitative variation on regression. Both of the time series are autocorrelated, so the term “spurious” comes to mind. Can anyone suggest a way to calculate a significance measure for phase shift matching, either with or without autocorrelation?
Again, please try to simply understand the proxy before getting wrapped in speculations about the relationship of the proxy to solar influences. Even if one dos not accept their solar hypothesis, the proxy provides interesting evidence of warm MWP in a key basin for Cat 4-5 hurricanes.
Steve,
If I recall correctly, the hurricane center kept referring to the “hot spot” that Katrina and Rita blew up over as part of the GOM Loop Current. Do you know if anybody has made any attempts to look into changes in location or strength of the loop current as a proxy for climate, temperature, or SST?
Postings 2, 6, 7, 9, 14: Excuse me being blunt, but this is crap. In posting 5 I took jae to task for claiming that “Solar activity for the past few years has been unprecedented in a milennnnium”. To this, jae responded with a reference to ScienceDaily (posting 6) which said:
“The accurate long-term dataset, therefore, shows a significant positive trend (.05 percent per decade) in TSI between the solar minima of solar cycles 21 to 23 (1978 to present)”, which says absolutely nothing about ANYTHING being “unprecedented in a milennnnium”. jae than mysteriously started to hedge his bets with posting 7 which said “the recent increase in Solar activity may be over” and in posting 9 he decided to make up his own (cherrypicked?) definition of “solar activity” as “sunspots ….. combined with shorter solar cycles and fewer cosmic rays” – well I guess we could “prove” anything by playing that sort of game.
Finally, Earle Williams, in posting 14 pointed me to another source on Wikipedia (en.wikipedia.org/wiki/Image:Carbon14_with_activity_labels.svg) which shows – guess what? – a proxy. So Earle is apparently asking me to just ignore the instrumental record I pointed to in my original posting and go for a proxy instead, presumably because it “proves” jae’s point. But does it? I don’t think so. Take a look at the accompanying plot (en.wikipedia.org/wiki/Image:Carbon14-sunspot.svg) which carries the summary: “There is a roughly 60 year delay between changes in sunspot activity and 14C; in this chart the time scale for 14C has been separated (labelled at the top of the chart) and offset by 60 years”. It can be clearly seen that the relevant time for the end of the C-14 data, as regards solar activity, is just before 1950 – certainly NOT “the past few years”.
And Steve – this posting is NOT primarily about “solar” – it is about misinformation, examples of which frequently appear unchecked on this site. jae’s posting 2, in which he said “Solar activity for the past few years has been unprecedented in a milennnnium” is, as far as I can see and as far as anyone else has been able to demonstrate, COMPLETELY UNFOUNDED.
So, Steve, please tell me why jae’s original comment did not attract the same scorn from you as a similar comment from the “Hockey Team” would have done?
Jim Barrett, jae’s comments on a blog have no comparison to the Hockey Team’s influence on science and on public policy. SteveM also made his comment in number 8. As for scorn, if you want to see some just go read any comment on RealClimate directed to anyone not agreeing with the powers that be or trying to show a different POV over there. As far as the sun goes:
Solar activity over the last 1000 years: does it correlate with climate?
S. K. Solanki, I. Usoskin, M. Schüssler, K. Mursula
Geophysical Research Abstracts, Vol. 6, 10-2-2004
link
And to quote a science discussion on another site:
“Obviously the solution of these problems can be attained only by combined efforts of specialists, working in dendroclimatology, paleoastrophysics, mathematical statistics, geophysics, magnetohydrodynamics, solar physics and cosmic plasma physics.
In spite of a lot of difficulties, the studies of the mechanisms and effects of solar activity on terrestrial climate, and their evolution during the last few millennia, are very important and valuable. The answers to these questions allow us to increase reliability and correctness of global and regional climatic prognosis for future centuries that is of tremendous importance for all the humanity.”
So let me tell you, I am really sick of non-scientists and even scientists who believe in AGW going around to blog sites where a discussion is open, trying to ridicule and shut everyone up. Nobody here is going to effect the public and the politics as much as that lousy graph did coming from the Hockey Team. And fact: we know very little about the Sun! Check your own scorn Jim Barrett!
here’s another one Jim Barrett that illustrates what little we know and what we need to learn about the Sun’s influence (and there is alot more where that came from)
link
Sorry so OT.
Jim, the major article indicating millennially-high solar is Usoskin et al 2003 http://cc.oulu.fi/~usoskin/personal/Sola2-PRL_published.pdf . There are only so many things that I can do and I’ve not parsed through the solar proxies although I’ve taken looks at them from time to time. The data seems to be worse than for temperature proxies. The following statement of yours is contradicted by the work of Usoskin and Solanki
I don’t vouch for the Usoskin/Solanki work, but it is authority for a lay person to conclude that there is at least some foundation for the claim.
The alternative solar reconstructions tend to have 20th century values but not “unprecedented”. There’s a very interesting knock-on effect from the Mann reconstruction to how one views these things. If you think that a Moberg or Esper type reconstruction with medieval values at a knife-edge balance to 20th century values, then you’re not necessarily looking for unprecedented solar values; to some extent, the USoskin/Solanki position is influenced by the Mann HS.
Scafetta’s presentation at AGu had sensible things to say about the relationship between the temperature reconstructions and the solar reconstructions.
But back to the post, don’t you think that it’s interesting that MWP Gulf of MExico SSTs in hurricane hot spots were so high?
Steve (posting 21): thanks for at last indicating a reference to jae’s claim. I wonder why jae didn’t know it himself – perhaps he works from the principle that “if I read it on climateaudit then it must be right” – if so, then hopefully you can see why I had a very good reason to question him. However, it’s just one sole reference and you admit “the data seems to be worse than for temperature proxies” – hardly something on which to base a firm claim. Even the “Hockey Team” has many more references than that. I would also draw your attention to to the fact that jae’s coment related to “solar activity for the PAST FEW YEARS”, and so is still not really supported by Usoskin et al.
Also, no one has addressed the fact that my original reference to a Wikipedia plot (en.wikipedia.org/wiki/Solar_variation) shows four rather similar OBSERVATIONS (not proxies) – irradiance, solar flare index, sunspots and radio flux – which ALL show higger values around 1980 than since, and the longer record of sunspot numbers shows higher values around 1950.
Finally, you ask “don’t you think that it’s interesting that MWP Gulf of Mexico SSTs in hurricane hot spots were so high?”.
No – what now interests me more is how this site spreads misinformation.
Jim Barrett, you said:
Please provide me with an example where I’ve done so. A comment by jae hardly entitles you to make such an allegation.
I’ve provided a citation to Usoskin et al reconstructing millennially high solar levels. Their group has a series of publications and are leaders in the field. You say that the Team has “many more references”. As far as I can tell, the proxy base for solar reconstructions covering the millennium is very slight – can you please identify the supposed proxies underlying this particular assertion. Here is a graphic from Usoskin et al NAture 2004:
You say: “my original reference to a Wikipedia plot (en.wikipedia.org/wiki/Solar_variation) shows four rather similar OBSERVATIONS (not proxies) – irradiance, solar flare index, sunspots and radio flux – which ALL show higger values around 1980 than since”. jae’s url, linking to a discussion from Willson, a specialist in the area, states:
As a comment by a layperson, if one accepted the Usoskin et al reconstruction published recently in Nature and the comment by Willson of continued increases in the past couple of decades, one could plausibly interpret recent solar levels as being high in millennial terms. I’ve looked at these solar proxies in a little more detail and plan to post on them.
Given your concerns about “misinformation”, I presume that you have expressed your views to realclimate about Mann’s statement to the NAS Panel that he did not calculate the verification r2 statistic as that would be a “foolish and incorrect thing to do.”
Jim, is this why you’re trying deflection?
Mr Barrett —
11-Jan: you asked “where on earth did that (extreme claim) come from?” At least one source was provided. More exist; some associated with the Planck Institute are perhaps as inbred as the HT’s temp multi-proxy studies!
14-Jan 5:17a: you become even more extreme with the claim as “COMPLETELY UNFOUNDED.” Again you ignored the Planck Institute related studies among others, including the supporting links to wiki at least one poster called you on.
14-Jan 3:54p: you again ignore rebuttals to your absolute claims, moving your accusation to how you perceive this “site spreads misformation.” To top it off, you add a 1980 corellation standard that you don’t even hold for HT-published temperature multi-proxies.
Let us guess, your next post will again selectively move on to some new double-standard? Yawn — well what can one expect from yet another featherweight RC+Wiki parrot?
What does the Planck Institute actually say?
How Strongly Does the Sun Influence the Global Climate?
http://www.mpg.de/english/illustrationsDocumentation/documentation/pressReleases/2004/pressRelease20040802/
Studies at the Max Planck Institute for Solar System Research reveal: solar activity affects the climate but plays only a minor role in the current global warming
Since the middle of the last century, the Sun is in a phase of unusually high activity, as indicated by frequent occurrences of sunspots, gas eruptions, and radiation storms. Researchers at the Max Planck Institute for Solar System Research (MPS) in Katlenburg-Lindau (Germany) and at the University of Oulu (Finland) have come to this conclusion after they have succeeded in reconstructing the solar activity based on the sunspot frequency since 850 AD. To this end, they have combined historical sunspot records with measurements of the frequency of radioactive isotopes in ice cores from Greenland and the Antarctic. As the scientists have reported in the renowned scientific journal, Physical Review Letters, since 1940 the mean sunspot number is higher than it has ever been in the last thousand years and two and a half times higher than the long term average. The temporal variation in the solar activity displays a similarity to that of the mean temperature of the Earth. These scientific results therefore bring the influence of the Sun on the terrestrial climate, and in particular its contribution to the global warming of the 20th century, into the forefront of current interest. However, researchers at the MPS have shown that the Sun can be responsible for, at most, only a small part of the warming over the last 20-30 years. They took the measured and calculated variations in the solar brightness over the last 150 years and compared them to the temperature of the Earth. Although the changes in the two values tend to follow each other for roughly the first 120 years, the Earth’s temperature has risen dramatically in the last 30 years while the solar brightness has not appreciably increased in this time.
Damon and Laut on the “links” between solar activity and recent warming.
Click to access DamonLaut2004.pdf
Jim,
There have been numerous links provided to peer-reviewed published articles that demonstrate not only a statistical correlation of climate to solar activity, but also a theoretical process by which it happens, backed up by experiments demonstrating that the theoretical process indeed works as expected (if not better). In return, you have posted a single link to a wikipedia site and claim that WE are the ones deserving of scorn?
Lee,
The Planck Institute quote you reference ignores the fact that the mechanism proposed by the Danish is not tied to solar brightness, but to the strength of the solar wind and ejected mass, which can be high even during low points in the 11 year sunspot cycles.
It is quite clear that we simply don’t know enough about the sun to know how much impact it really does have on climate change. However, the first step to getting further in the climate side of the research is for climate researchers to quit pretending that solar brightness, TSI, solar wind, GCRs, and sunspot activity and strength all fluctuate in lockstep and that they all affect the earth in exactly the same way. Solar wind/GCRs are a completely different animal than changes in TSI and the sooner everybody quits trying to treat them as one, the sooner we will be able to move forward in understanding how they affect climate.
Apologies and strike “featherweight RC+wiki parrot” — sub “lawyer sans relevant science degree.”
#27. Damon and Laut say that other climate scientists have used poor statistical methodology. I haven’t gone through these particular statistics- I can’t do everything in the world. But would the use of poor statistics by a climate scientist (of any persuasion) surprise me? Of course not.
re 28 – Bill F, the Damon and Laut paper I cite in 27 directly addresses much of that – the correlations break down badly for the increasing temperatures of the last 3 decades or so.
Mr Lee-
“3 decades or so,” are nothing climatically — the same can be said of post 1980 end of the temperature multi-proxies you worship. It’s worth refreshing the request this new year Mr Lee, oh pompous bearer of the double-standard, “Bring the Proxies up to date!”
McCall, you are being a twit, and assuming facts not in evidence – incorrectly, I might add.
If complete collapse of a correlation in the later years of a time sequence is “nothing climatically,” then there would be utterly no reason whatsoever to want to “bring the proxies up to date.”
Correction: “nothing (at least in this warming cycle)“
Facts not in evidence? Then the 2.5+ decade collapses of temp increase, when CO2 and GHG was increasing must be material as well? More double-standard, Mr Lee of such catastrophic AGW fanaticism!
That’s what the Team calls a Divergence Problem and simply ignore. Lee, if you hold people to the principle that the models should apply out-of-sample (that’s fine – I agree with this), then you should be consistent and condemn the Team ignoring “divergence” with their reconstructions. I take it that you are now onside with condemning the Team reconstructions on this count.
Extraordinary claims require extraordinary evidence. You seem to have (selectively?) forgotten “the warmest decade of the millenium!” Of course as the pompous bearer of the double-standard, the requirements of extraordinary evidence in such cases are suspended – including failure to update the proxies.
Steve (posting 23):
> Jim Barrett, you said:
> what now interests me more is how this site spreads misinformation.
> Please provide me with an example where I’ve done so.
Don’t be silly, Steve – you are not the only one who writes things on this site. Are you really vouching for EVERYTHING EVERYONE says on here as correct? It seems like a bit of a reality check is needed here.
You also said:
> I’ve provided a citation to Usoskin et al reconstructing millennially high solar levels.
> Their group has a series of publications and are leaders in the field. You say that the
> Team has “many more references”.
You should read what I said, Steve, which was:
“However, it’s just one sole reference and you admit `the data seems to be worse than for temperature proxies’ – hardly something on which to base a firm claim. Even the “Hockey Team” has many more references than that.”
The “more” refers to “one sole reference” (which was all I had been given at the time). I’m not sure if your obscure statement “can you please identify the supposed proxies underlying this particular assertion” relates to this – perhaps it does – but I don’t know what you mean.
You then say “if one accepted the Usoskin et al reconstruction ….. and the comment by Willson of continued increases in the past couple of decades, one could plausibly interpret recent solar levels as being high in millennial terms.” Well, sorry, Steve – I wasn’t talking about things just being “plausible”, I was arguing about whether jae’s short, clear and unambiguous statement that “Solar activity for the past few years has been unprecedented in a milennnnium” is or is not correct. Now I would read jae’s “past few years as being “since 2000” or, stretching a point, “since 1995”. To show jae’s statement is false one does not necessarily need to resort to long-term proxy data (with all its pitfalls), but it is sufficient to show that direct observations of activity at ANY time prior to 1995 was higher than at any time since 1995. It is quite possible that the Wikipedia plots to which I referred were incorrect, although no one seems to have offered that opinion. However the Wikipedia plots DO show (as I said earlier):
“OBSERVATIONS (not proxies) – irradiance, solar flare index, sunspots and radio flux – which ALL show bigger values around 1980 than since, and the longer record of sunspot numbers shows higher values around 1950.
If, indeed, these reported observations are correct then I’m afraid jae is wrong.
Finally, I’m ignoring those who tried to draw me into a discussion of the solar effect on climate. They should just note that nowhere did I use the word “climate” in the above – the discussion is not about that.
Bill F said in #28:
Lee replied:
Ummm … actually, no. All the Damon and Laut paper talked about were the claims of Christensen and Lassen, which is very different than what Bill was talking about. Solar effects, like most forcings, are still poorly understood. In fact, of the 12 forcings discussed in the IPCC TAR, scientific understanding of 9 of them was rated “Low” or “Very Low” … and that’s not counting forcings they didn’t consider (e.g., biogenic aerosols, biogenic methane, plankton generated rain nuclei, coronal mass ejections, solar wind), or unknown forcings …
Finally, you seem to think that the divergence of solar and temperature in 1980 says something about CO2 … but all it tells us is that we don’t understand climate … but we knew that already.
w.
Sheesh, Jim, calm down. My “unprecedented” statement was a tongue-in-cheek half-joke, mocking statements made by some of the climate researchers. Since the furnace for the Earth is the Sun, I do think it is necessary to be very careful to not exclude the possible Solar effects on climate before resorting to attributing EVERYTHING to CO2.
WRT “misleading statements:” Even if my statement is misleading, that has nothing to do with this blog. There are hundreds of statements by posters on this blog, representing people with all POVs. Good grief!
27, Lee: here’s an interesting take on the “errors” in Damon’s work, LOL.
Jim Barret,
In #5 you cite Wiki as a reference but mysteriously avoid any specificity to what information you conclude is authoritative for the last thousand years. Please pardon me for failing to recognize and interpret your obtuseness in #5.
In fact I don’t know if you were focusing on the sunspot number count for the last 300 years or not, or maybe you were just waiting to see which way this discussion went before deciding on which harrangue to employ. I have no way of knowing, particularly when you point to a Wiki page as your source of scientific information but don’t back it up with any substantive discussion of what is contained on the page. Since jae was speaking in terms of millenial solar activity, it is far from misinformation to point to the radiocarbon proxies.
Finally, individual comments are individual comments. The point of this board is to provide opportunities for all interested parties to identify and focus on the technical aspects of proxy science. Please do jump right in to identify the problems in the solar proxies – Steve just started a thread on that very issue.
But I suspect that you’re neither interested nor capable of delving into those issues, otherwise we’d being seeing so much more of you on CA than these puerile plaints against prejudiced postings.
Regards,
Earle
jae (posting 40): good one, jae. When you’ve run out of argument, it is always a good ploy to pretend it was only a joke after all. I assume that your statement “I simply can’t see how anyone can deny that the primary driver of climate is the Sun” was similarly a joke (which of course it is).
Earle Williams (posting 42): Don’t bother spending any more effort defending the indefensible – jae now tells us that his posting (2) was a joke after all. Pity we all had to waste so much time over it.
PS: as I’ve already indicated, I am quite prepared to believe that the Wikipedia reference (as so much other crap on the Internet (!?)) was incorrect – however no one has managed to show this. They have just indulged in dancing around the problem and avoiding the actual issue which I raised.
Barrett: I said “half-joking.” Based on the little I know at present, I think the Sun is the primary driver, but I certainly cannot prove it. I’m not alone; there are some very qualified scientists that agree. BTW, what issue did you raise?
27, Lee: regarding the “errors” in that paper. I’m no statistics expert for sure, but this paper suggests that we can’t even draw the line for the last few years, until we have some more cycles–because of the filtering.
39 – willis,
The Damon and Laut paper specifically talks about issues with the solar – cloud cover hypotheses of Svensmark et al. Your claim that it only addresses Christensen et al simply tells me you didn’t bother to read Damon and Laut.
And WTF is with that last paragraph?! That divergence does not tell us only that we “don’t understand climate.” It tells us that there is no correlation between this solar mechanism and the warming of the last few decades, and there therefore this mechanisms is unlikely to be responsible for the warming of the last few decades. That isn’t only ‘not understanding.’ That is adding a bit to understanding.
re 41, 46
jae – that cite of the Idsos may be the funniest thing I’ve read there. They are attributing the temperature record of the last few decades to the reconstructions by Mann et al? Huh?! They gloss over the collapse of correlation over the last few decades, whci9h is one central point of Damon and Laut, and c oncentreate on teh temperature so f the 1940s – which had NTOHING to do with what Damon and Laut were saying. That is simply an egregiously dishonest attempt by the Idsos to distract from the point of Damon and Laut.
Adn the Marshall thing raises an interesting point – but I don’t think they meant to. In Lassen et al’s correlation – how is temperature in a give solar cycle responding to the length of that cycle if the cycle is ongoing and hasnt run yet and therefore the length is indeterminate at the time? Is temperature responding to future solar events? More directly, the Marshall piece is at leat as strongly damaging to Lassen et al as it is to the pieces they point at.
48, Lee: para. 1: Mann or Jones, take your pick.
para. 2: I can’t figure out what you’re saying. Maybe you don’t understand the smoothing/filtering issue here?
BUT, now I am concerned that some of the solar scientists are also taking liberties with the data, based on this article. I don’t fully understand the article, and they use Mann’s temp. recon. in part of it. We need Steve M’s help!
Lee, you say:
No, it means you didn’t read Bill F’s post before responding. Specifically, he mentioned the disconnect between solar wind, solar magnetism, and solar intensity. Solar wind was not discussed at all by Damon and Laut, and while the D&L paper dismisses Svensmark’s papers on cosmic rays for using what they say are poor data and methods, it does not discuss the underlying claim (that cosmic rays affect cloud formation), which as you know has recently been verified. Thus, the D&L claims about Svensmark’s papers may prove to be unfounded.
Again, all the divergence shows us is that we don’t understand climate. The recent rise is not explainable by solar, CO2, or other known forcings … which is an advance of sorts, but does not tell us what the cause was. It does not invalidate any theories, it just shows us that there are more factors at play than we have accounted for. Which, as you point out, adds to our understanding … but only to our understanding of our limitations. Whatever caused the climate to move in sync with solar forcings of various kinds during the previous centuries didn’t suddenly disappear.
w.
49 – jae, the temperature changes of the last 4 decades are NOT derived from dendro reconstructions. They are derived from measurements of the temperature. Potential problems with those reconstructions of PAST temperature are irrelevant to the observed temperature increase of the last 4 decades – or of the last century-plus, for that matter.
Teh Idspos were citing an irrelevancy.
Willis, I dont think anyone doubts that the sun has an effect on global temperature changes – the link with onset of glaciations and interglacials seems pretty solid, for example. Past correlations with solar cycling may be telling us something interesting about a possible solar effect on temperature – but if that correlation breaks down as completletely as claimed for the last several decades, then it tells us that this effect is not a major cause of the warming over the last several decades.
jae: You ask (45) “what issue did you raise?”. You know very well the issue. I said it succintly in posting (5) and elaborated for the slow-witted in postings (22) and (38). The point, my dear friend, is that if “the primary driver of climate is the Sun” then it is reasonable to suppose that physical properties of the Sun’s output should correlate rather strongly with global temperature – they quite definitely DON’T since around 1950, during a time when we had the BEST observations of both solar output and of the Earth’s temperature – unless you cherrypick proxies or some obscure combination of the Sun’s physical outputs. However, if you were to accept that they indeed don’t correlate well during that period, you would be forced to concede that solar forcing is only a part of the climate forcing, and at present a rather small part – which is, of course, what most climate scientists say.
And we couldn’t have that, could we?
#53. Actually, Jim, there are a number of studies e.g. Reid 1991; White et al 1997, by mainline scientists which observed a rather striking correlation between solar and SST. The IPCC rejected these correlations and the story of this rejection is an interesting one in itself, which I made notes on some time ago and would be an interesting post.
One of the key studies purporting to deny solar correlation was actually MBH98 (see Figure 7), which was relied upon by IPCC TAR in this respect. As has been discussed on this board last year, MBH98 contained flat-out misrepresentations about their results in respect to Figure 7 which eluded peer review at the time and have never been discussed in print.
RE: #11 – Perhaps a sort of ion / plasma flux density function.
51: FWIW, Lee, I do not have much regard for the SAT “measurements,” since we are not allowed to audit the data and methods for calculating it. Moreover, only 18.4% of the Earth is covered by the measurements. (ref.) I wonder if there is any way to determine the “error bar” on this “global averate temperature.” It also looks fishy, because it does not match temperature increases in the troposphere, like the AGW bible says it should.
56 (cont.)And we also have the so-called UHI (land-use)influences that are supposedly incorporated into the record by some mysterious means. Maybe the solar graphs correlate very well, after all.
Re: #53
Steve M, I think that the tone of this discussion (way too snotty in my view) demonstrates the benefits of your posting a lead-in to a thread using a few references as a point of discussion. Generalizations and vague references seem to lead to adversarial and emotional exchanges.
I would suggest that the solar side discussion participants of this thread spend time at the CA thread titled Solar Proxies and deal with the specific point and counter point issues presented by the papers referenced by Steve M — or your own references related to the subject.
RE 21:
SteveM, it’s interesting how your link:
Click to access Sola2-PRL_published.pdf
shows similarity to some of the proxies (Richey’s Fig 3,4) in this post w/high current values.
One advantage of sediment proxies is that they can represent the average of large spatial areas — properly sited Gulf of Mexico sediments can reflect averages over much of the Mississippi’s drainage area. Unlike the way “teleconnections” have been invoked in treering studies, some proxies actually have this type of characteristic.
Steve (posting 54) – once again the discussion about jae’s statements in posting (2) is diverted into talking about other issues (proxies, the IPCC, MBH98 ….. ). Please just bring this to a close by giving us your honest opinion – are the statements “Solar activity for the past few years has been unprecedented in a milennnnium” and “the primary driver of climate is the Sun” supportable or not? If so, where is the support? In particular, if the second statement is correct, then I would assume from the first that is is demonstrable over “the past few years”. Once again, please note the words “the past few years”.
Jim: I don’t know what you mean by “supportable.” Of course they can be supported by some research papers–and refuted by other papers. It seems you are asking for some type of indisputable fact. Few, if any, of those exist in science.
Interesting paper with new and convincing evidence of a GCR-cloud link that is independent of satellite data:
http://www.met.rdg.ac.uk/cag/publications/2006/harrison2006.pdf
Re #60
Jim Barrett,
Exactly what fool’s errand are you on? You refuse to do any heavy lifting regarding your position and expect everyone else to do it for you. Instead of adding substance you harp on Steve for not immediately attacking a brief comment. One gets the impression that you care not a whit about the science behind solar activity but instead are attempting to discredit Steve McIntyre at every opportunity.
You of course could actually research the science behind your Wiki page reference. You of course could provide a summary of various issues on solar variation and the limits of our understanding. You of course could confirm or refute your supposition that the source (which one?) you point to on the Wiki page is unreliable. But no, instead the harrangue continues.
In the interest of consistency and disclosure, do you practice what you preach? Do you equally question all comments on other internet forums? And, as you’ve alluded to in other posts, do you fully disclose your financial interests? C’mon Jim Barrett, I thought you jumped on people who might be communicating a message in return for economic gain.
Regards,
Earle
Earle (posting 63) – what a diatribe! I can only say that no one has provided any evidence to support jae’s original claim (even he now admits it was a “half-joke” and certainly not “indisputable”). If you dispute the curves in Wikipedia then please tell me what is wrong with them.
Re #64
Jim Barrett,
Diatribe is as diatribe does.
I haven’t identified anything in particular in the Wiki page you referenced that may not be supportable in the scientific literature. In #5 you provided a link to the Wiki page that you said refutes jae’s claim, whereas in #14 I pointed to information on the same page that supports it. Taking both at face value, jae’s staement can be supported as readily as it can be refuted.
I also have not assumed that the sunspot observations dating back to 1750 are an absolute measure of all kinds of solar activity. It would seem you have. That is a reasonable area for further discussion and I welcome debate if you so choose. But you’ll have to actually engage on that issue and do some research on your own.
Whether or not you respond to my request for disclosure depends on whether or not you wish to maintain any veneer of credibility on Climate Audit. That’s up to you.
Earle (posting 65): You say “in #14 I pointed to information on the same page that supports it” (i.e. jae’s claim). However, as I pointed out in posting (18) (which I presume you never read), the data to which you refer (carbon-14) is qualified by the statement “There is a roughly 60 year delay between changes in sunspot activity and 14C; in this chart the time scale for 14C has been separated (labelled at the top of the chart) and offset by 60 years”. (en.wikipedia.org/wiki/Image:Carbon14-sunspot.svg). So this information can have absolutely no bearing on the period which I have been discussing (the period since 1950) – it comes 60 years too late! So you have NOT “supported” jae’s clain – you have just presented a facade of support that may be only too quickly demolished. Similarly, jae’s claim is easily demolished by referring to observational data from just the past 50 years (and please note that the plots from Wikipedia are all backed up on that site by reference to data sources).
You also say: “whether or not you respond to my request for disclosure depends on whether or not you wish to maintain any veneer of credibility” – are now saying that all who post anonymously to climateaudit are not credible?
Incredible!
Paleotempestology — A new and exciting field of science that studies past tropical cyclone (hurricane) activity based on geological proxy evidence as well as historical documentary records. (like ship and plantation records)
here’s one example link to a list of publications here they give on this paleotempestology page here
Jim Barrett, you ask whether Earle’s position is that
In this forum, I assess a poster’s credibility on what he says. There are considerable differences in level of knowledge. climateaudit as a site permits comments and, as stated in the post on blog policies (Road Map) does not vouch for comments by individual posters. For example, you post many things that I disagree with and this site definitely does not vouch for what you say (or for that matter what jae or Lee says.)
#53,
Mr. Barrett, I have a question for you: does the global temperature correlate well with CO2 since 1950? If not, can we then imply that CO2 is NOT the main driver of climate since 1950? You seem to be very knowledgeable about climate science, and this has been bugging me for quite a while. Obviously, the “slow-witted” here don’t have the answer, but I trust that you do!
An early paleotempestology simulator…
Francois Ouellette (posting 69): Let’s confine ourselves to instrumental data, which for the CO2 records at Mauna Loa starts in 1959 (for the first whole year). The CO2 data may be downloaded from:
http://www.cmdl.noaa.gov/projects/web/trends/co2_mm_mlo.dat
The GISS global temperature data is available from:
http://data.giss.nasa.gov/gistemp/tabledata/GLB.Ts+dSST.txt
If you average the data to annual values, you will find an R2 of 0.78 over the 48 values from 1959 to 2006. If you plot up the values you will see a good correlation – of course, they are essentially two trends, with the majority of variability in the temperature (I don’t know anyone who would pretend that global temperature is driven SOLELY by CO2!). More importantly, the trends go the way we would expect (more CO2 means higher temperature) and the relationship of the trends is as we would expect from estimates of CO2 and temperature taken over past glacial cycles, with due consideration for changed albedo effects due to snow and ice. In other words, the relationship goes the right way, and with the magnitude which we would expect from other independant observations (i.e the glacial cycles). So I would conclude that CO2 has a quite significant effect on global temperature.
Now, please do the same with the solar records over the same period.
Jim,
Since you don’t have a graph of what you did, and don’t explain it very carefully I need to ask you to clarify one or two things. Did your get your R2 by comparing the CO2 totals to the temperature anomilies or did you compare the yearly CO2 increases with the temperature anomilies? If the former (as I suspect) then you need to allow for the serial correlation of the CO2 concentrations, which is very high. If you find that high a correlation for the latter situation, I want to see your work.
Lean et al 1995 (including Bradley)
They argue against solar causation not because of statistical correlations but because they argue that the estimated changes in irradiance are insufficient to cause the observed changes in temperature.
Prior to MBH, people didn’t seem to think that you could show statistically which was causing the observed temperature changes – allocating between the two trends. When you add in all the possible lag times with oceans and so on, I am extremely dubious that any of the Team-type statistical tests will do what they claim.
#71
Jim, Thanks so much for the enlightenment! Hey, these correlations are fun! So I got the hang of it. In fact, I repeated your calculation, this time using log(CO2), since I’m told that temperatures actually depend on the log. From 1950 to 2006, I got an R2 of 0.745 for the correlation.
But then I did something really nasty. Since I had no data for CO2 prior to 1959, I extrapolated them! Extrapolation is always a dangerous thing to do, I admit. Anyway, to make sure the extrapolation wasn’t totally off the mark, I used a third order polynomial, but set its value at 280 ppm in 1880, which is approximately the pre-industrial value. Anyway, the error between the extrapolated values and the measured values is no larger than 0.09% so I must have done something right.
Having the extrapolation in hand, I could test the theory that temperature is proportortional to log(CO2). I chose the period 1935-1975. I was really excited while doing that, since I would finally have the proof, the smoking gun. After all, physics doesn’t lie (I should know, I’m a physicist).
But then came the big disappointment! For the period 1935-1975, there is an inverse correlation between CO2 and temperature. Moreover, the R2 is only 0.0128, so really there is no correlation at all!
I’m puzzled! At the same time, I’m afraid you’ll accuse me of “cherry picking” my time period to get the result I wanted.
But then, isn’t that what you did?
re 68
re teh coment from Jim Barret quoted in 68
This is a statement that is open to emprical test. Indeed it is a known result in sociology that the ability to contribute anonymously improves interaction. This is for a variety of reasons ranging from shyness to fear of retribution from superiors. Teh ability to anonymously express potentially controversial views improves the generation of new ideas etc.
Hypothetically one could suppose that peeer review as it is now practiced in academia despite its use of anonymous referees contributes to the generation of “groupthink”. papers with controversial views must face the approval of powerful academics with a vested interest in promoting their own ideas.
Re #68
Jim Barrett,
In your efforts to wipe out misinformation and portray skeptics as being in the employ of big oil, you are claiming a moral high ground that you can only remotely have legitimate claim to by disclosing financial interests and relationships of agency. I’ve offered you an opportunity to disclose such interests and you’ve declined.
Regarding the figure you refer to on the Wiki page, taken at face value the C14 data do not track to current time. I acknowledge your point on that graph. However I have read several of the references at the bottom of the page and none of them indicate that there is a 60 year lag before the effect of C14 is detected. I believe you made that up based on the caption under the Wiki graph. If you can point me to a source supporting this 60-year effect I’ll reconsider based on the evidence. I don’t think you’ll find it. What the references do state is that C14 decay can only be reliably calibrated up to 1950, as anthropogenic radiation since that time has made C14 calibration problematic. Hence for C14 dating the ‘present’ is anchored at 1950. See http://en.wikipedia.org/wiki/Radiocarbon_dating.
So to summarize my conclusions:
1) A casual interpretation of the original figure I cited supports jae’s initial comment.
2) Years BP means years before 1950.
3) The graph with the offset indicates that the C14 data stops at 1950 and isn’t carried forward.
4) There is no 60-year lag effect. You made that up.
5) Your vociferous and boorish harrangue, while supported by the sunspot counts, is so out of proportion for what even you acknowledge was an offhand remark that it leads me to speculate as to the purity of your motives. In an effort to keep in line with the guidance put forth in the Road Map I’ll keep that speculation to myself.
Should you care to continue a dialog off-site I can be reached by my posting name (sans space) at yahoo dot com.
Regards,
Earle
What a naive position to take. Does posting using a full name somehow make a person more credible? How does one determine whether that full name is or is not a pseudonym for a different real name. e.g. The person posting under the name Jim Barrett might actually have the last name of Jones. How do you know.
Seems to me, credibility should be judged by content not name.
Oh dear – the wolves are howling – they are obviously getting agitated.
Dave (posting 72): I calculated R2 for the CO2 record and the temperature record. I never said anything about comparing anything with “yearly CO2 increases”. I’m sure you know that R2 is pretty widely defined as the covariance squared divided by the product of the two variances. It DOES NOT (as normally defined) depend on “serial correlation” of either series. I thought the “serial correlation” issue had been done to death on climateaudit – but I do also realise that there are still an awful lot of misconceptions going around. Firstly, you need to consider the “serial correlation” issue only when you actually get to the point of estimating parameter uncertainties (e.g. the ratio between the variations of of two series – which R2 is not). Secondly, although workers often use the serial correlation of one record to estimate such uncertainties, this is not really what is wanted. The correlations which are actually required involve both the SIGNALS and the RESIDUALS, and ACROSS-RECORD correlation is also important. There are many ways of estimating the parameter uncertaintities due to such correlations – they all involve approximations and they all give different results. Using serial correlation of one of the raw records is just one (rather naive) way.
Steve (posting 73): You quote “surface temperatures correlate well with solar activity over this period” – this may well be true of the “past 130 years” – but can you show that it is true of the last 50? Remember I only started considering the last 50 years because jae said “solar activity for the past few years has been unprecedented in a milennnnium” which appears to me to be disprovable by simply looking at only the past 50 years.
Francois (posting 74): You say “For the period 1935-1975, there is an inverse correlation between CO2 and temperature. Moreover, the R2 is only 0.0128, so really there is no correlation at all!” I’m not surprised – as I said in posting 71 “I don’t know anyone who would pretend that global temperature is driven SOLELY by CO2!”. I always thought the “1935-1975” period had been adequately covered by Fig. 4 of the TAR SPM (http://www.grida.no/climate/ipcc_tar/wg1/007.htm) – I also recall that this has also been discussed to death on climateaudit, so let’s not go there. You also say “but then, isn’t that what you did?” (i.e cherrypick). No – I didn’t cherrypick – as I noted to Steve above “I only started considering the last 50 years because jae said ‘solar activity for the past few years has been unprecedented in a milennnnium’ which appears to me to be disprovable by simply looking at only the past 50 years”.
Stan Palmer (posting 75) and Bob K (posting 77): You both quote me (“all who post anonymously to climateaudit are not credible”) as if I was the source of the “anonymity/credibility” issue. However, I was only repeating the thrust of Earle’s argument (posting 65: “whether or not you respond to my request for disclosure depends on whether or not you wish to maintain any veneer of credibility”) – so please direct your comments to him and not me (but I’m sure you won’t!). I note that Steve also (skillfully?) handballed the issue away from Earle and towards me (posting 68).
Earle (posting 76): I’ll just address your “conclusions”:
1) A casual interpretation of the original figure I cited supports jae’s initial comment.
AGREED – you were being casual.
2) Years BP means years before 1950.
I agree that is the normal convention – if it is so in the case of the plot to which you directed me, then the plot CERTAINLY says nothing about solar activity after 1950.
3) The graph with the offset indicates that the C14 data stops at 1950 and isn’t carried forward.
I’m not sure if you are making a serious point here or just stating the “bleeding obvious”.
4) There is no 60-year lag effect. You made that up.
NO – of course I didn’t make it up – I read it from a page related to the one to which YOU referred.
5) Your vociferous and boorish harrangue, while supported by the sunspot counts, is so out of proportion for what even you acknowledge was an offhand remark that it leads me to speculate as to the purity of your motives. In an effort to keep in line with the guidance put forth in the Road Map I’ll keep that speculation to myself.
I think if you take a look, you will find that your own responses were “vociferous”, “boorish” and “out of proportion”.
You also say “should you care to continue a dialog off-site I can be reached by my posting name (sans space) at yahoo dot com – do you mean [snip – to avoid spammers]
#78 As for howling wolves-takes one to know one!
You say:
Astronomers have been counting sunspots since the days of Galileo, watching solar activity rise and fall every 11 years. Curiously, four of the five biggest cycles on record have come in the past 50 years. “Cycle 24 should fit right into that pattern,” says Hathaway.
link from NASA
Jim Barrett you also miss this on that same Wikipedia page where it says:
Here’s an interesting out of the box page/paper and person (just to yank Jim Barrett’s chain!):
“”Galactic Explosions, Cosmic Dust Invasions, and Climatic Change””
Excerpt from Paul LaViolette’s 1983 Ph.D. dissertation
link
bio page
“predictions” page
#78 Jim,
So which is it? Is solar activity NOT unprededented over the past fifty years BECAUSE there happens to be a good correlation between CO2 and temperature? What exactly is the link between those two statements?
My point is that if you state that the fact that CO2 correlates well over the past 50 years implies that CO2 is a major driver of the climate (or of global temperatures, whatever that means), then that assertion is contradicted by the lack of correlation over the previous period (and the lack of correlation can be shown to extend over a 50 year period as well). But then you retreat and say that nobody thinks that CO2 is the SOLE driver. What are the others, then? Aerosols? Fine, just show me reliable data for aerosols in the atmosphere over the full 20th century, including uncertainties, as well as a proven model of their effect on the global climate. As far as I know, none of those exist, so aerosols remain a convenient ad-hoc hypothesis.
So really it comes down to whether the Sun was unprecedently active or not over the past 50 years. Fine, let’s debate that and examine the value of the various measurements and proxies! That is what CA is all about.
But your rhetorical arguments and patronizing tone àƒ➠la RealClimate won’t pass the test here. We may be a bunch of “slow-witted”, but taking the time it takes to reach correct conclusions is in the end better than accepting everything at face value.
#78 Jim,
If you consider the TAR SPM a “scientific” document, fine. But according to all standards of modern scientific practice, it isn’t. Let’s confine ourselves to discussing peer-reviewed publications. There’s plenty of good material there.
re 78
Jim Barrett made a statement
This statement is, in the general case of anonymous in interaction, false as has been shown by sociological research. Why not admit your mistake?
Re #78
Jim Barrett,
You certainly could have tried any and all of those email addresses. The fact that you opted to put them in text, free for all the spammers of the world, confirms the baseness of your motivations.
Jim,
I’ve downloaded the sunspot data, and whichever way I look at them (raw, running averages of all sorts), the sunspots are always higher during the period 1950-2006 than during any other period since 1751. I agree that there is not a tremendous 1:1 correlation with temperatures, but then neither is there one betwen CO2 and temperature over the same period (say the 20th century).
One sensible working hypothesis would seem to be that since both the sun and CO2 concentration have been exceptionnally high during the second half of the 20th century, it is not surprising that the global temperature has been rising. The exact proportion of both forcings(an a multitude of others) is yet to determine, IMO. The IPCC TAR dismissed the influence of the Sun, but only for lack of a suitable mechanism. Since then, various plausible mechanisms have been proposed. It’s clear to me that we need more work in that area in view of getting a better idea of the relative forcings. People like you and, say, the “hockey team”, seem absolutely terrified by such a simple statement.
#84 Francois, actually the line that IPCC 4AR is taking is that solar forcing is now believed to be less than in TAR. They rely on Wang, Lean Sheeley 2005, an “unseasoned” paper [in Gerry North’s terms], which argues that there was little change in irradiance from the Maunder Minimum to the present, and essentially ignore or disparage the Usoskin/Solanki school. IT strikes me as a bit like TAR inhaling MBH98 a little too quickly. Wang et al looks very speculative to me. We’ll see how it all stands up.
Francois, another point in the solar-temperature correlations. The early proponents of a correlation tended to use SST, especially tropical SST, as an index. Also as is well-known the Jones index diverges from satellite indexes in this period. The discrepancy between solar trends and satellite trends is much less than between solar and Jones. There’s a lot of disentangling of data that’s involved.
Francois (posting 84): This discussion has got way off my original contention which was, taking a selection of my earlier statements (for the umteenth time):
“It looks to me as if the maximum was just after 1950 and not ‘for the past few years’ – and it was then at about the same level as around 1780.” (posting 5)
“….. jae’s posting 2, in which he said ‘Solar activity for the past few years has been unprecedented in a milennnnium’ is, as far as I can see and as far as anyone else has been able to demonstrate, COMPLETELY UNFOUNDED.” (posting 18)
“….. if ‘the primary driver of climate is the Sun’ then it is reasonable to suppose that physical properties of the Sun’s output should correlate rather strongly with global temperature – they quite definitely DON’T since around 1950, during a time when we had the BEST observations of both solar output and of the Earth’s temperature – unless you cherrypick proxies or some obscure combination of the Sun’s physical outputs. However, if you were to accept that they indeed don’t correlate well during that period, you would be forced to concede that solar forcing is only a part of the climate forcing, and at present a rather small part – which is, of course, what most climate scientists say.” (posting 53)
“….. jae’s claim is easily demolished by referring to observational data from just the past 50 years (and please note that the plots from Wikipedia are all backed up on that site by reference to data sources).” (posting 66)
“….. I only started considering the last 50 years because jae said ‘solar activity for the past few years has been unprecedented in a milennnnium’ which appears to me to be disprovable by simply looking at only the past 50 years.” (posting 78)
So I am NOT claiming that the Sun has NO influence on climate, nor that CO2 is the ONLY influence. I would, however suggest that inspection of solar activity and global temperature over the past 50 years is a good reason to doubt jae’s claim (posting (2)) that “the primary driver of climate is the Sun”.
Stan Palmer (posting 82): Thank you for giving another excellent example of the promulgation of misinformation on this site. What I said in posting (66) was (in response to Earle Williams):
“You also say: ‘whether or not you respond to my request for disclosure depends on whether or not you wish to maintain any veneer of credibility’ – are now saying that all who post anonymously to climateaudit are not credible?”
Which you interpret (posting (82)) as:
“Jim Barrett made a statement
‘all who post anonymously to climateaudit are not credible’
This statement is, in the general case of anonymous in interaction, false as has been shown by sociological research. Why not admit your mistake?”
I find the openess of your distortion quite astounding – or as I said to Earle – incredible!
Jim Barrett: just what is your explanation for the LIA and MWP? This is one of the the biggest problems the AGW fanatics have to overcome in order to sell me on a major role for CO2.
Earle (posting 83): Can you give me one good reason why, after your continuing diatribe, your continuing resort to conspiracy theory and your continuing implications of the “baseness of (my) motivations”, that I would want to email you and give you my own email address?
#85 Steve,
It’s a shame if 4AR is ignoring not only Solanky, but a lot of other serious pieces of work.
About correlations: actually I’m not a big fan of correlations. There are too many variables. My view is that correlations are useful if you have a model to explain them. Otherwise, you never really know if it’s spurious or not, and debating that can last forever, as we see in the hurricane threads. On the other hand, I kind of like Scafetta’s work, because he goes beyond simple linear correlations. I’ve also seen a paper by Quassim and Attia using fuzzy logic and neural networks to predict the sun’s influence that seemed neat, but with too few details.
Jim: please stop accusing people here of spreading misinformation. Nobody here is funded by Exxon. I’m not exactly sure what you were trying to prove (or disprove). Let’s just call it a draw.
Steve M. makes an interesting comment in 86. It blows my mind that literally hundreds of climate scientists accept, evedently as a matter of pure FAITH, the so-called SAT, when there is no way to check whether or not it was calculated properly (if it even CAN be calculated). The Global Change fanatics should demand an audit of this basic part of the debate.
Re #90
Jim Barrett,
I look forward to an apology for you posting those email addresses, should one be forthcoming. Either here or email would do. I’m sure the other net denizen that share my name would appreciate one as well.
Regards,
Earle
My thanks go to Steve or John for editing out the email addresses that were posted above. And my apologies to CA for my part in taking the discussion so far off topic.
Regards,
Earle
Posting 94: “my apologies to CA for my part in taking the discussion so far off topic”.
And thank you too, Earle, for admitting it. Your attempts to divert a simple discussion were completely uncalled for.