I realize that not all CA readers are interested in multivariate methods and that dendroclimatologists want to “forget the math”, but I find it interesting to try to relate dendro and paleoclimate recipes to known statistical methodologies that you can read about in texts.
I commented the other day on the form of Principal Components Regression used in Wilson et al 2007 and prior articles by Luckman’s students: their reconstructions are a form of inverse OLS regression but on 3 or so PCs rather than 20 proxies. I thought that it might be worthwhile to write up some of my thoughts on multivariate methods. The approach here is based on an interesting article and tutorial by Magnus Borga entitled “A Unified Approach to PCA, PLS (Partial Least Squares), MLR (Multiple Linear Regression) and CCA (Canonical Correspondence Analysis)” . I use OLS and MLR interchangeably below.
In my opinion, Borga provides a very elegant way of keeping track of these different methods, such that some insight is actually shed on their relationships. I’ve added my own twist to his analysis by fitting Ridge Regression, Canonical Ridge Regression and Principal Components Regression into this “unified approach” – I don’t think my analysis is particularly profound, but I haven’t seen it anywhere and it seems pretty to me.
Let’s start with the relationship between OLS and PLS regression (accept for now that the regression step in MBH98 is a form of Partial Least Squares regression although the authors did not recognize this in their linear algebra, nor for that did Bürger and Cubasch in their recent consideration of the matter). PLS regression is implicitly used in Hegerl et al 2006 and the Juckes et al submission, again without being aware of it. The difference between PLS regression and OLS regression can be viewed as a rotation of the coefficients, as follows:
(1)

The idea that the 

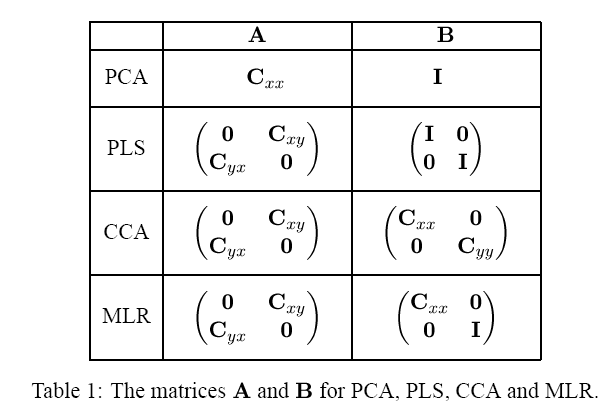
Borga groups all the above multivariate methods as solutions to one eigenvalue equation shown below using different combinations of covariance and identity matrices:
(2)

He summarizes the different combinations of covariance and identity matrices in the following table. The different multivariate methods are encompassed in different 


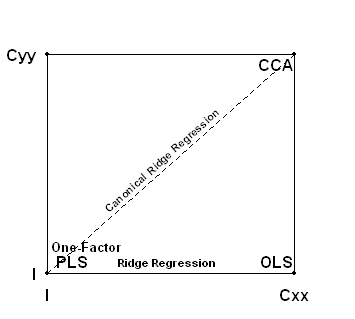
Borga didn’t discuss Ridge Regression, but I think that it fits rather elegantly into this formulation. Hoerl and Kennard 1976 define the ridge regression (RR) coefficient as follows:
(3)

In effect, the ridge regression coefficient k “blends” the PLS B-matrix 

(4)

Canonical ridge regression can be viewed in precisely the same way – with the canonical ridge regression coefficient acting as a mixing coefficient blending the
I’ve represented these methods in the following diagram that I find helpful. The three corners of my diagram are simply a visual representation of lines 2,3 and 4 of Borga’s Table 1, with Ridge Regression being the path along the “X” axis of the mixing coefficient and Canonical Ridge Regression following the line from PLS to CCA.
What made me think about this again was the form of Principal Components Regression used by Rob Wilson and other Luckman students. We observed the other day that the coefficients using Principal Components Regression were given by (changing the nomenclature slightly):
(5)

If one expands the 
(6)

In effect, as you go from 0 to m retained PCs, you define a path from PLS to OLS in which each step is generated by 
Now Hoerl and Kennard 1976 proposed a method for selecting a ridge regression coefficient. In the context of an inverse regression, you have to think long and hard about whether a procedure for regression of effect upon causes (tree ring ~ temperature + precipitation) where you want orthogonality can be transmogrified into an inverse regression of cause upon effect in the style of dendroclimatologists ( temperature ~ bristlecones+ Gasp” + …), where you actually want multicollinearity (i.e. a signal). At this point, I’m not prepared to say that any procedure for selecting a mixing coefficient is “right”. Indeed, my own preference, in the absence of any reason to prefer one series to another, is for averaging where the issue of mixing coefficients doesn’t arise. Note that some of the recent work of Mann and Rutherford involves ridge regression, although the methods themselves are not related to methodology as it is known off the island. (Plus as CA readers have observed, there are some seriously weird things in their RegEM implementation.)
The above analysis does not include simple averaging (or similar things like CVM). It looks to me like averaging is an even more trivial implementation in which the 


Von Storch and Zorita observed that the low-frequency variation in regression-based reconstructions was attenuated. I don’t think that they explored the reasons for this effect very fully and some of my notes last year on VZ pseudoproxies are relevant. I discussed OLS reconstructions, not because they were used in present-day reconstructions (although it was used in Groveman and Landsberg 1979), but because it was a type of extreme case that sharpened the contrast between methodologies. In terms of preserving low-frequency variability, OLS had the worst performance in a tame network, as it introduced irrelevant variation in the regression coefficients. PLS (Mannian regression) although by no means the worst possible technique, were worse than CVM in preserving low-frequency variability. If the proxies are “naturally orthogonal”, PLS and OLS are the same.
Back to the Wilson-Luckman type reconstruction: with 3 or so PCs, they are moving part-way from a PLS to an OLS reconstruction, losing low-frequency variability as we’ve already observed, which is perceptible in comparing the Wilson-Luckman reconstruction to the Esper chronology using only RW.
Rob Wilson and JMS have purported to explain the “natural orthogonality” of RW and MXD series by suggesting that they measure different seasons. “Target” seasons run the risk of being a deus ex machina, but that’s a story for another day. In one of the articles on Rocky Mountain climate, I’ve seen a reference to a very high correlation (0.92 – I’ll try to find the reference) between July and August temperatures. If so, this would not explain the natural orthogonality of the RW and MXD series.
However, there’s an interesting twist on this in terms of the multivariate alternatives discussed here. If the covariances between the different months matter, then they need to articulate their methods in terms of a 

Does it “matter”? Who knows? The fit will definitely be artificially increased; the 20th century trend will be increased; the low-frequency variance will be decreased. How much is impossible to assess without the data.
References:
Magnus Borga, Canonical Correlation: A Tutorial http://www.imt.liu.se/~magnus/cca/tutorial/tutorial.pdf
M. Borga, T. Landelius, H. Knutsson, 1997 A Unified Approach to PCA, PLS, MLR and CCA, Report LiTH-ISY-R-1992, ISYhttp://www.imt.liu.se/mi/Publications/Papers/LiTHISYR1992.pdf


3 Comments
One case that would be interesting is the relationship between the PLS where n=1 and the simple average. The Wilson-Luckman results look like there is only one really dominant PC. Lots of ‘natural’ data look like that. If the PLS and n=1 reduces to a simple average then it would show simply that PC analysis is simply ‘overkill’.
Steve,
I think CCA means in this context Canonical Correlation Analysis, and not Canonical Correspondence Analysis. This latter method is a different method mostly used in ecology, and it is only very loosely related to Canonical Correlation.
A comment on the natural orthogonality. There has been some debate on the difference between the Artic Oscillation and North Atlantic Oscillation, which is related to this question. It boils down to the situation in which one has 3 time series, A,B,C. A pathological example would be that A and B are correlated only for even timesteps, A and C are correlated only for odd time steps; B and C are uncorrelated when considering all timesteps. If one performes a PCA of these three series, one would obtain an eigenvector where all three series are contributing, and yet B and C are uncorrelated.
I have not looked into the data, but something similar could be happening here if, for instance, the correlation between T and RW and T and MXD is only present in subsegments of the record, RW and MXD being uncorrelated for the whole record.
Equation (5) here looks like it is connected to the EIV approach in Mann et al 2008, which inverts the (X^T X)^{-1} matrix by using a truncated SVD re-combination. For the reasons implied in the above thread, it’s not at all clear that this represents an improvement over the regression methods of MBH.
2 Trackbacks
[…] one-parameter arc between PLS and OLS solutions that we’ve observed in previous posts e.g. here – a picture that I personally find very helpful in de-mystifying these […]
[…] is equivalent to Partial Least Squares regression of the target against a network (e.g. here for a discussion). Any regression against a large number of predictors is vulnerable to overfitting, a phenomenon […]