I’ve been seeking an engineering-quality exposition of how 2.5 deg C is derived from doubled CO2 for some time. I posted up Gerry North’s suggestion here , which was an interesting article but hardly a solution to the question. I’ve noted that Ramanathan and the Charney Report in the 1970s discuss the topic, but these are hardly up-to-date or engineering quality. Schwartz has a recent journal article deriving a different number and, again, this is hardly a definitive treatment. At AGU, I asked Schwartz after his presentation for a reference setting out the contrary point of view, but he did not give a reference. I’ve emailed Gavin Schmidt asking for a reference and got no answer.
James Annan, a thoughtful climate scientist (see link to his blog in left frame), recently sent me an email trying to answer my long-standing inquiry. While it was nice of him to offer these thoughts, an email hardly counts as a reference in the literature. Since James did not include a relevant reference, I presume that he feels that that the matter is not set out in existing literature. Secondly, a two-page email is hardly an “engineering quality” derivation of the result. By “engineering quality”, I mean the sort of study that one would use to construct a mining plant, oil refinery or auto factory – smaller enterprises than Kyoto.
Part of the reason that my inquiry seems to fall on deaf ears is that climate scientists seem to be so used to the format of little Nature and Science articles that they seem not to understand what an engineering-quality exposition would even look like.
Anyway on to James who writes:
I noticed on your blog that you had asked for any clear reference providing a direct calculation that climate sensitivity is 3C (for a doubling of CO2). The simple answer is that there is no direct calculation to accurately prove this, which is why it remains one of the most important open questions in climate science.
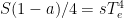
We can get part of the way with simple direct calculations, though. Starting with the Stefan-Boltzmann equation,
where S is the solar constant (1370 Wm^-2), a the planetary albedo (0.3), s (sigma) the S-B constant (5.67×10^-8) and T_e the effective emitting temperature, we can calculate
= 255K (from which we also get the canonical estimate of the greenhouse effect as 33C at the surface).
The change in outgoing radiation as a function of temperature is the derivative of the RHS with respect to temperature, giving
. This is the extra Wm^-2 emitted per degree of warming, so if you are prepared to accept that we understand purely radiative transfer pretty well and thus the conventional value of 3.7Wm^-2 per doubling of CO2, that conveniently means a doubling of CO2 will result in a 1C warming at equilibrium, *if everything else in the atmosphere stays exactly the same*.
But of course there is no strong reason to expect everything else to stay exactly the same, and at least one very good argument why we might expect a somewhat increased warming: warmer air can hold more water vapour, and I’m sure all your readers will be quick to mention that water vapour is the dominant greenhouse gas anyway. We don’t know the size of this effect precisely, but a constant *relative* humidity seems like a plausible estimate, and GCM output also suggests this is a reasonable approximation (AIUI observations are generally consistent with this, I’m not sure how precise an estimate they can provide though), and sticking this in to our radiation code roughly doubles the warming to 2C for the same CO2 change. Of course this is not a precise figure, just an estimate, but it is widely considered to be a pretty good one. The real wild card is in the behaviour of clouds, which have a number of strong effects (both on albedo and LW trapping) and could in theory cause a large further amplification or suppression of AGW-induced warming. High thin clouds trap a lot of LW (especially at night when their albedo has no effect) and low clouds increase albedo. We really don’t know from first principles which effect is likely to dominate, we do know from first principles that these effects could be large, given our current state of knowledge. GCMs don’t do clouds very well but they do mostly (all?) suggest some further amplification from these effects. That’s really all that can be done from first principles.
If you want to look at things in the framework of feedback analysis, there’s a pretty clear explanation in the supplementary information to Roe and Baker’s recent Science paper. Briefly, if we have a blackbody sensitivity S0 (~1C) when everything else apart from CO2 is held fixed, then we can write the true sensitivity S as
where the f_i are the individual feedback factors arising from the other processes. If f_1 for water vapour is 0.5, then it only takes a further factor of 0.17 for clouds (f_2, say) to reach the canonical S=3C value. Of course to some extent this may look like an artefact of the way the equation is written, but it’s also a rather natural way for scientists to think about things and explains how even a modest uncertainty in individual feedbacks can cause a large uncertainty in the overall climate sensitivity.
On top of this rather vague forward calculation there are a wide range of observations of how the climate system has responded to various forcing perturbations in the past (both recent and distant), all of which seem to match pretty well with a sensitivity of close to 3C. Some analyses give a max likelihood estimate as low as 2C, some are more like 3.5, all are somewhat skewed with the mean higher than the maximum likelihood. There is still plenty of argument about how far from 3C the real system could plausibly be believed to be. Personally, I think it’s very unlikely to be far either side and if you read my blog you’ll see why I think some of the more “exciting” results are seriously flawed. But that is a bit of a fine detail compared to what I have written above. Assuming I’ve not made any careless error, I think what I’ve written is entirely uncontentious among mainstream climate scientists (I certainly intended it that way).
Feel free to post and/or pick at as you please (maybe you’d like to LaTeX the maths first).
James

A Few Comments
As noted above, the above note contains only one (not very useful) reference and fails my request for something in the literature.
Annan says:
if you are prepared to accept that we understand purely radiative transfer pretty well and thus the conventional value of 3.7Wm^-2 per doubling of CO2
I do accept that we know radiative transfer of CO2 “pretty well”. I’m not as convinced that all the details of water vapor are understand as well. IPCC TAR GCMs all used a HITRAN version that included an (undisclosed) clerical error in water vapor NIR that amounted to about 4 wm-2 or so. This error had been identified prior to IPCC TAR, but not in time to re-do the GCMs. The error was not disclosed in IPCC TAR. The water vapor continuum seems to have a certain amount of hair on it yet.
Worse, as far as I’ve been able to determine, radiative transfer theory is not itself sufficient to yield the “conventional value of 3.7 Wm^-2 per doubling of CO2”. Getting to that value requires assumptions about the atmosphere and lapse rates and things like that – I’m not saying that any of these calculations are poorly done or incorrect, only that they are not simply a matter of radiative transfer.
Next, James identifies a second important assumption in the modern calculations:
constant *relative* humidity seems like a plausible estimate and GCM output also suggests this is a reasonable approximation
It may well be a “plausible estimate” but something better than this is required. I cannot imagine someone saying this in an engineering study. Lots of things “seem plausible” but turn out to be incorrect. That’s why you have engineers.
Annan goes on to say “GCM output also suggests this is a reasonable approximation”. I’m not sure entirely what he means by this as he did not provide any references. I interpret the statement to mean that GCMs use the constant relative humidity assumption and yield plausible results. Could one vary the constant relative humidity assumption and still get reasonable results from a GCM or a re-tuned GCM? I don’t know. Have people attempted to do so and failed? I don’t recall seeing references to such null experiments AR4 or elsewhere, but might have missed the discussion as it’s not a section that I’ve read closely so far.
[UPDATE: JEG below criticizes my rendering of Annan’s observation, saying that GCMs do not use the relative humidity assumption. I’m not making a personal statement on whether they do or not, I’m merely trying to understand Annan’s meaning and will seek clarification. I note a comment in HAnsen et al 1984 which states of his then model:
The net water vapor gain thus deduced from the 3-D model is g_w ~0.4 or a feedback factor of f_w ~1.6. The same sensitivity for water vapor is obtained in 1-D models by using fixed relative humidity and fixed critical lapse rate (Manabe and Wetherald 1967), thus providing some support for that set of assumptions in simple climate models.
Perhaps the right interpretation of Annan’s oracular comment is that the 3-D models do not use this assumption, but their parameterizations result in behavior that is virtually equivalent to using the assumption. ]
In an interesting Crowley paleoclimate article (that I’ve not discussed yet but will at some point), he questions this particular assumption on the basis that allowing for varying lapse rates could explain otherwise puzzling paleo data.
Obviously in an engineering quality assumption, the constant relative humidity assumption would need to be thoroughly aired. I think that this is probably a very important topic and might take dozens of pages (if not a few hundred). A couple of sentences as done here by Annan is merely arm-waving through the problem.
Clouds
Annan says quite candidly:
The real wild card is in the behaviour of clouds, which have a number of strong effects (both on albedo and LW trapping) and could in theory cause a large further amplification or suppression of AGW-induced warming. High thin clouds trap a lot of LW (especially at night when their albedo has no effect) and low clouds increase albedo. We really don’t know from first principles which effect is likely to dominate, we do know from first principles that these effects could be large, given our current state of knowledge. GCMs don’t do clouds very well but they do mostly (all?) suggest some further amplification from these effects. That’s really all that can be done from first principles.
If we go back to the Charney Report in 1979, clouds were even then identified as the major problem. Given the seeming lack of progress in nearly 30 years, one wonders whether GCMs are really the way to go in trying to measure CO2 impact and whether irrelevant complications are being introduced into the assessment. There was an interesting discussion of cloud feedbacks at RC about a year ago, in which Isaac Held expressed astonishment when a lay commenter observed to him that cloud feedbacks in the models were all positive – Held apparently expecting the effects to be randomly distributed between positive and negative.
James says:
We really don’t know from first principles which effect is likely to dominate, we do know from first principles that these effects could be large
This is a pretty disquieting statement. If we don’t know this and if this is needed to assess doubled CO2, how does one get to an engineering-quality study?
As far as I’m concerned, James’ closing paragraph about feedbacks is tautological: if you know the feedback ratio, you know the result. But you don’t know the feedback ratios so what has James done here other than re-state the problem?
Thus, James’ exposition, while meant kindly, is not remotely close to answering my question. So the search for an engineering-quality explanation remains.
As I’ve said on many occasions, I do not jump from the seeming absence of a reference to the conclusion that such an exposition is impossible – a jump that readers make much too quickly in my opinion. Murray Pezim, a notorious Vancouver stock promoter, actually had a couple of important mineral discoveries (e.g. Hemlo). I do think that the IPCC has been seriously negligent in failing to provide such an exposition. Well before the scoping of IPCC AR4, I corresponded with Mike MacCracken and suggested that IPCC AR4 should include an exposition of how doubled CO2 leads to a 2.5-3 deg C overall temperature increase – the sort of exposition that readers here are thirsting for.
He undertook to pass the suggestion on to Susan Solomon. However, this idea was apparently rejected somewhere along the process. The first chapter of AR4 consists instead of a fatuous and self-congratulatory history of climate science that has no place whatever in a document addressed to policy-makers.
A side-effect of this IPCC failure is perhaps the dumbing down of the AGW debate, giving rise to shallow and opportunistic expositions like An Inconvenient Truth, in which we get polar bears, hockey sticks, Katrina, all artfully crafted to yield a promotional message. This places thoughtful climate scientists in a quandary, since, by and large, they agree with the AIT conclusion, but not the presentation and the details, and have tended to stay mute on AIT.


490 Comments
This somewhat assumes that an engineering quality exposition would have more detail than this; i.e. that there’s more “there” there. I think what James is telling you is that this is all there is, and an engineering quality exposition would just wrap this up in a polished wrapper, but wouldn’t contain any more meat.
Engineering studies can run thousands of pages with lots of details. They are not little arm-saving memos. One might write up a short memo about the study, but there’s a difference between the memo and the study.
Arthur and others accused me of being wrong when I said that climate sensitivity without feedbacks is 1. Now Annan says the exact same thing. Will they criticize him and demand he change it to 1.35? Please do, gentlemen. Because otherwise I’ll want an apology. More seriously, Annan’s treatment is obviously to brief. What’s more its “not peer reviewed” 😉
I think part of the problem is understanding that this sensitivity is a gain.
Recall what Dr. Curry said about feedbacks:
“Observing feedbacks:
A feedback cannot be observed. Variables are observed.”
Gains for complexity systems are not derived. LIMITS may be derived, the actual gain values
are discovered empirically through trial and error.
Old man story time: when I looked through the flight control software for a particular system
I found all these odd undocumented numbers. Magic numbers I called them. When I asked the programmer
what they were he said “gains” DONT TOUCH THEM. Basically, he would spend hours tuning those numbers
to keep the system stable under external forcing. There was no derivation of the gain…it was
pick a number, fly the plane, opps that’s unstable. Pick a number, fly the plane. stable but sluggish.
At some level there were upper and lower bounds that could be derived, but they didnt help the actual
guy trying to figure out the sensitivity or the gain.
FWIW.
re Steve McIntyre #2
I am not sure you need a lengthy (page count) study. A few good hypothesis substantiated by results from a practical test method can go along way. I recall there was some discussion on a CA thread recently with attempts to cook up a cheap test. There is clearly a need for large scale testing, commensurate with the importance of the problem. A couple of multi million dollar tests to identify the best test methodology, could easily be financially justified. That could be followed up by a more costly test, using greater scale on the most successful test method to increase the fidelity of the result. Again the cost of AGW certainly justifies the expense to raise the certainty.
But hey, this is climate science, let’s just take their word for it.
My understanding (possibly erroneous) is that the absorbsion bands for H2O are much broader than CO2. Thus, in an area with significant humidity, doubling the CO2 will not result in any significant increase in radiation absorbsion, since the H2O has already absorbed the radiation that the CO2 would absorb. The gas absorbsion interactions are not independent! Thus, doubling CO2 would only increase radiation absorbsion in areas where the relative humidity is low. These tend to be the areas of higher latitude where incident radiation is also lower. The argument that doubling CO2 and changing nothing else will cause 1 degree increase seems incorrect from the very start even before discussing the feedbacks. If I have this wrong, I would love to have someone explain to my why.
If you have a system where a 1 unit perturbation causes 2 units of change. The system is inherently unstable. The system will run away until it hits some other limit. In a motion control system you will have pieces of robot all over the floor. In a thermal system you will melt something. I believe in control theory this means that the poles in the s domain are on the positive side of the graph but it been a while since I have been in college.
On the absorption bands question, Wayne, CO2 and water share some but not all of there absorption spectra:
I would imagine that the presence of water vapor does reduce the effectiveness of CO2 somewhat.
For those interested in radiative transfer it is very instructive to play around with models. A simple web interface to the MODTRAN3 model can be found here.
In the model double the concentration of CO2 and you can see the reduction in outgoing radiation. Then increase the surface temperature to get back to the original outgoing radiation. That’s the temperature sensitivity of CO2 doubling with no feedback.
Have fun.
Consider a simple problem: determine the speed of sled going down a hill
The physical laws of gravity are well defined but require a number of parameters including:
– the mass of the sled
– the gravitational constant
– the initial speed
– the slope of the hill
– the air resistance
– the co-efficient of friction between the sled and the ground
The first three are well defined and/or easily measured.
The slope make not be known or may vary over time.
The last two are non-linear and can only be determined with experimentation.
If you had historical records for sled speed you could come up with estimates of the slope/air/friction parameters but the historical record does not allow you to accurately assign the correct weighting to each one. Making predictions with inaccurate weightings would likely give you the correct result if the conditions remained the same – however, your predictions would be wildly wrong if the conditions changed (i.e. the slope angle or wind speed changed).
This example is a system without any feedbacks yet it seems to me that producing an engineering quality derivation of for the coefficient of friction would be quite difficult if one cannot conduct lab experiments that are reasonably similar to the real life scenario.
Obviously, one could make any number of assumptions that would simplify the problem but without the ability to experiement you would have no way to demonstrate that the assumptions are reasonable.
Is there something I am missing? Could this simple problem be solved without the need to resort to lab experiments?
If it can’t be solved then that suggests that accurately deriving climate related parameters such as CO2 sensitivity would an even more intractable problem.
Does anyone have any insights on how NASA solved these kinds of problems when planning space flights? Can that experience be applied to the climate problem?
First of all you have to describe what kind of engineering analysis you are looking for. Are you looking for a *real* engineering analysis, or the type of “engineering” analysis where “all you gotta do is reboot”?
Assuming you’re talking about a real one where lives are on the line (because in fact they are) you first have to have the variables nailed down. That means if you don’t know what’s going on with clouds, you can kick the whole decimal point concept out, and start figuring your +/- in whole numbers as well – a *one percent* change in albedo is 3.4 w/m^2, the same as a doubling of CO2.
I remember an RC post about the fact that it doesn’t matter if CO2 in the troposphere is saturated because it’s the CO2 in the stratosphere that counts, since that’s what determines the effective height of radiation. Which is it? If it doesn’t matter whether or not CO2 is saturated in the troposphere, how can it matter how much water vapor is there? All more ghg’s in the troposphere are going to do is adjust convection, correct? The lapse rate is constant throughout the solar system. No matter what else man can do, I don’t think we can overrule the laws of thermodynamics.
Think muons and no evidence of CO2 *ever* leading temperature in the paleorecord, and Spencer’s latest here. Since we’re talking lives on the line, we also need to consider the fact that CO2 is the base of the food chain.
If you want a real engineering analysis, I don’t think you can do better than 1 +/- 3 K.
Steve Hemphill, PE
re 9. We all know Modtran here some of us poor souls actually had to work with it.
The question is the gain, the sum of feedbacks. that cannot be analytically derived.
There is the challenge to the warmers!
Now, it’s an unfair challenge because the gain
is empirically estimated. The only way the warmers can estimate the gain is by
running a GCM. Paleo records put BOUNDARIES on the sensitivity but the actual
sensitivity is non deriviable.
PLus the gain changes with changes in the atmospheric conditions, so you would
actually have a schedule of gains. Hansen hints at this as well.
Steve
It is interesting that you talk about this in engineering terms. The GCM’s are an incredibly cumbersome set of code that have evolved over time. I wonder, that if with very advanced control systems software such as Matlab’s Simulink that you couldn’t write some simplified code that incorporates feedbacks in the proper manner. The good thing about this software is that it has been verified as to structure and performance against real world systems. I don’t know if it would be possible to do this but I don’t see any reason why it should not.
To me as an engineering physics working engineer who is used to control systems work, climate does seem to me as a multiple feedback loop control system with solar energy as the ultimate input.
One thing that struck me in the presentation here is that 1370 watts/m2 is too high by several watts/m2 for the nominal case. Also as a control systems engineer, that number is only good in a static case. I would never use the static normalized number for a system that continuously varies from 1328 watts/m2 (July 3) to a maximum of 1388 watts/m2 (January 3). That is a significant variation in insolation and to take and use a normalized number such as 1370 watts/m2 is a simplification that would never work in a control system analysis for a multivariate real time system.
Here is a graph of the data from the SORCE spacecraft that shows the normalized (orbital variation removed) TSI from 2003 to today.
As an engineer this is an error on the order of a half of a percent which would also be a no no, especially when the right number is very well known.
It is also interesting that many studies have shown that the Earth’s albedo varies around that constant number in the email by quite a bit. Also, you have to use the real numbers, not a simplified constant. Would never work in a real time system that lives depend on.
dennis, those numbers dont match up with the judith lean numbers I have that are at approx 1366W
What’s the difference?
re: 8 Thank you for the absorbsion graphics. The presence of H2O seems to have a much larger impact on absorbsion than just “somewhat”. Is there anybody that has gone through the effort of posting absorbsion curves as a function of humidity? I would expect the curves to be dominated by H2O until the humidity gets into small single digit percentages, but I have seen no graphs to support or reject this hyposthesis. Again, thanks.
Don’t forget that the derivitation of jus tthe energy forcing does not provide all of the necessary information regarding temperature change. for that you need the heat capacity of the earths ‘climate system’. Schwartz has recently published his paper in this topic, I think I might have even gotten the reference here. The point is, that even this so called ‘heat capacity’ likely has a big unertainty to it.
I won’t even mention somone elses paper on CO2 forcing….
Love this site.
Roger
I was bothered by the assumption of constant albedo, as well. Here’s something to ponder:
Re #6
Yes your argument is erroneous, don’t believe the cartoon version of the spectra they don’t come close to giving a true picture much higher resolution is needed also there is no indication of the concentration at which the spectra are recorded.
Steve Hemphill
Parts of the UK are showing a 20% increase in sunshine hours in the winter since 1929.
I wonder how many w/m^2 that is?
Re # 8 Andrew,
It would be instructive to replace the Y-axis figures on your graphs with a parameter related to heat so that the relative importance of the absorbers can be seen.
Re Steve,
I read your header as I was about to find a place to post this. You are not alone in your frustration from failing to get concrete answers – but many excuses.
There are omnipresent calls for more funds to go to climate research overall. I just read a call for flotillas of boats to measure several ocean parameters at hourly intervals at many depths, generating millions of numbers per hour; and for supercomputers larger than any so far to cruch the data to understand the influence of oceans on climate.
Maybe now is the time to switch emphasis from chasing pies in the sky or sea, to demanding more practical and productive expenditure. The ample flaws of the past decades generate pessimism about future understanding. Climate science has failed the cost:benefit ratio. Thank you for showing evidence of this so often.
There are other ways to spend funds of this magnitude, eg alleviation of poverty and disease. For example, when we spend money on a vaccine we know with fair probability that it will produce a positive benefit that can be observed and progressed.
With climate science, what positive benefit have we observed and what are the plans for progress?
Let me retreat on what I said in #1. This is what Gavin would call a “cartoon”. When you start listing all the various things that impact the climate sensitivity, it gets into a lot of radiation esoterica, including band broadening, overlaps of different components, water vapor heterogeneity, and ends up dealing with GCMs and convective heat transfer, and with cloud formation, I can see where one could, as Steve suggested, produce a 1000 page report laying all of this knowledge out.
However.
Somewhere between the beginning and the end, there will be a handwave, because the dots aren’t connected. The sensitivity is only as good as the guess as to the magnitude of the feedback. And that’s a guess.
It would be appropriate to include such a report a Schwartz-style attempt at backward determination of these parameters, and a general critique of that approach.
It would necessarily end up looking somewhat like the IPCC reports, however. Rather disjointed and incoherent.
Ah, I see the problem here! Steve McIntyre is hoping for an “engineering-quality” discussion of something that is very far from being suitable for engineering!
With a mechanical engineering project, say, you know precise mechanical properties (within narrow error bars) of materials you’re working with, including three dimensional shape and mass, elastic properties, fatigue issues, and so forth. You have a long history of how certain construction techniques work in practice so you can put numbers on the reliability of welds, cross-bracing, etc. You design for specific conditions – floor loading, wind loading, and add in a safety-factor margin just to be sure. As a general rule, engineers do their jobs very well, with the occasional failures like the recent Minnesota bridge collapse only highlighting how much we rely on their calculations.
What’s the corresponding situation with climate? It’s definitely not an engineering discipline at this point – we’re still in the frontiers of science. But some of the components are there, or at least close.
First is the CO2 radiative forcing effect. There are a large variety of ways to parametrize the atmospheric layers, even with our apparently pretty good knowledge of the radiative physics. Chapter 10 of IPCC AR4 WG1 goes into the projection issues in some detail, with section 10.2 in particular looking at radiative forcings. Table 10.2 shows the forcings for doubled CO2 from a variety of different models: there is some residual uncertainty but the average is 3.80 W/m^2 forcing, with standard deviation 0.33 W/m^2.
Now a nearly 10% standard deviation in a key number is pretty good for science, but it’s pretty abysmal for engineering – perhaps the first clue that we’re not talking about engineering here!
Second is the temperature response to forcing. Assuming the forcing is small, the response should be linear in the perturbation; the question is what is the ratio. James Annan gives the mean Stefan-Boltzmann response, which would be fine if the Earth were uniformly at the effective temperature and the total greenhouse effect was small. But it’s not (though not bad as a very rough approximation – Annan perhaps thought an engineering account would be happy with 50% error-bars…). You have to take into account the range of present temperatures and atmospheric layers to get an accurate response temperature; this is roughly Moeller’s calculation of 1966 referenced at Spencer Weart’s site:
Möller, Fritz (1963). “On the Influence of Changes in the CO2 Concentration in Air on the Radiation Balance of the Earth’s Surface and on the Climate.” J. Geophysical Research 68: 3877-86.
http://www.aip.org/history/climate/Radmath.htm
Moeller’s number for the bare response to doubling CO2 was 1.5 K. This is under the assumption of no water-vapor response (no increased evaporation and latent-heat effect either). The error-bars on that should be at least the 10% standard deviation in the pure radiative number (so 1.35 K wouldn’t be unlikely).
Adding in the water-vapor response is where you actually have to go to the detailed climate models. Contrary to Steve M’s claim above, the climate models these days don’t “assume constant relative humidity”, they calculate physical processes at sea surface/air boundaries and look at the resulting water vapor, temperature, and other numbers for the different atmospheric layers in the grids.
But of course that’s getting into the modeling business – if you don’t believe any of them, there’s not much point discussing further, because the only other way to get to the bottom of the water vapor response is to run the doubling experiment and see what happens…
Steve: You say: ” Contrary to Steve M’s claim above, the climate models these days don’t “assume constant relative humidity”… ” I made no claim whatever about climate models. I discussed what Annan said. Why would you put words in my mouth?
I’m going to close the comments overnight on this thread. I really don’t want to encourage people just submitting their own bright ideas about GCMs or what’s wrong with them. I’ll reopen tomorrow.
I’m interested (as always) in suggestions as to nominations of a non-armwaving exposition.
Climate scientists seem to have no idea what an “engineering” study looks like, but that doesn’t seem to deter anybody. I’m not an engineer and, to some extent, I’m merely a one-eyed man here. But I can’t imagine an engineering study of a climate model that didn’t include a careful assessment of each critical parameterization, describing its provenance, what testing has been done on it, what sensitivity there is to it,…. Not just radiation code, but everything in the model.
#24 says:
I’m sure that this is a summary of the models, but it is not an exposition of the calculation, which is not simply a MODTRAN calculation as assumptions on atmosphere have to be made as well.
Unfortunately S.McI has temporarily closed tha Annan thread so I have to comment here . Once it is reopened , I’l copy and paste there .
I am actually very surprised that nobody reacted on the below quote because it can’t get wronger .
J.Annan wrote :
Despite the fact that these and similar trivial errors have already been debunked here 100 times , it tends to appear again and again .
So here goes the list of all that is wrong in such a short statement .
Error N° 1 : A careless reader might have missed the small “e” in T_e (“effective emitting” temperature) used in Stefan Boltzmann law . Stefan Boltzmann law applies however to the real local temperature T(x,y,z,t) – applying it to T_e is illegal .
Error N°2 : The left hand side of the equation contains an average albedo . The equilibrium equation being only valid localy , the local albedo should be used . This equation should then be integrated with the right a(x,y,z,t) .
Error N°3 : Applying illegaly Stefan Boltzmann to T_e and using illegally an albedo average yields indeed T_e. This T_e is unphysical and specifically doesn’t equate to any local or average value of the real temperatures field T(x,y,z,t) and is not an approximation of anything .
Error N°4 : This unphysical T_e (255K) is then substracted from the SPATIAL AND TEMPORAL AVERAGE of the real temperature field T(x,y,z,t) and the result of 33K is called “estimate of the greenhouse effect” . As T_e is unphysical and of course is not equal to a spatial and temporal average of a temperature field , the value of 33K doesn’t mean anything and is an estimate of nothing . It can be called comparing apples with oranges .
Error N°5 : The derivative of S-B is ONLY valid locally with a real temperature . It is invalid for any unphysical parameter like T_e .
The right expression of the sensibility is therefore 4.s.T(x,y,z,t)^3 . It varies between 2 W/M²/K (high latitudes) and 7 W/M²/K (low latitudes) . It’s anybody’s guess what the street number 3.76 W/M²/K might be but it most certainly is not the average Earth’s sensibility even in the most idealised and symetrical temperatures field case .
Depending on the real temperature distribution this “average” value is somewhere between 2 and 7 and varies wildly with time . On a particular note , let us stress again that even if the true (spatial) average was calculated what is not the case , the sensibility of the whole system would not depend on that average but again only on the local distributions and that is a trivial consequence of the non linearity .
Amusing note N°6 : As we have seen that the value of 3.76 W/M²/K was unphysical and certainly not derived from first principles , the fact that it would NUMERICALLY equate the so called “radiative forcing through CO2 doubling” should be enough to not allow much credibility to the claim that the sensibility of the system to CO2 doubling be 1K .
So please , if you are really interested in science and the next time you hear “the effective radiative temperature” run away because the person you are talking to , either doesn’t know what he talks about or supposes that you don’t .
Since comments for Annan are closed (I understand the reason) let me post here this list I compiled the first time Steve asked for some peer-reviewed article “different” from Ramanathan 1975. I found none. Maybe the citation list I compiled of articles citing Ramanathan explains why. It’s a kind of what we call in spanish a “vicious circle”. Maybe english-speaking use the modism catch-22 or deadlock. All the literature I found refers to Ramanathan. Nothing new in 30 years (afaik). It is ordered by year, starting with Ramanathan 1975
1975
Ramanathan, V., 1975: Greenhouse effect due to chlorofluorocarbons:
Climatic implications. Science, 190, 5052.
1976
Greenhouse Effects due to Man-Mad Perturbations of Trace Gases –
WC Wang, YL Yung, AA Lacis, T Mo, JE Hansen – Science, 1976
1977
Climate and energy: A scenario to a 21st century problem
H Flohn – Climatic Change, 1977 – Springer
1978
Stratospheric photodissociation of several saturated perhalo chlorofluorocarbon compounds in current
CC Chou, RJ Milstein, WS Smith, H Vera Ruiz, MJ – The Journal of Physical Chemistry, 1978
PHYSICAL CHEMISTRY
CC Chou, RJ Mllsteln, WS Smith, HV Ruiz, MJ Molina – pubs.acs.org
1980
Coupled effects of atmospheric N 2 O and O 3 on the Earth’s climate –
WC Wang, ND Sze – Nature, 1980
1981
Increase of CHClF 2 in the Earth’s atmosphere
MAK Khalil, RA Rasmussen – Nature, 1981 – nature.com
1982
Carbon dioxide and climate: has a signal been observed yet?
SL Thompson, SH Schneider – Nature, 1982 – nature.com
Long-term stabilization of earth’s surface air temperature by a negative feedback mechanism
SB Idso – Meteorology and Atmospheric Physics, 1982 – Springer
1986
Future global warming from atmospheric trace gases –
RE Dickinson, RJ Cicerone – Nature, 1986 1986
1988
The Greenhouse Theory of Climate Change: A Test by an Inadvertent Global Experiment –
V RAMANATHAN – Science, 1988
Scientific Basis for the Greenhouse Effect –
GJ MacDonald – Journal of Policy Analysis and Management, 1988
1989
TRACE GAS EFFECTS ON CLIMATE: A REVI EW
V RAMANATHAN – Carbon Dioxide and Other Greenhouse Gases: Climatic and , 1989
1991
Inadequacy of effective CO 2 as a proxy in simulating the greenhouse effect of other radiatively
WC Wang, MP Dudek, XZ Liang, JT Kiehl – Nature, 1991
Biogeochemistry: its origins and development
E Gorham – Biogeochemistry, 1991 Springer
1992
Cold comfort in the greenhouse
JT Kiehl – Nature, 1992 – nature.com
Adsorption and reaction of trichlorofluoromethane on various particles
S Kutsuna, K Takeuchi, T Ibusuki – Journal of Atmospheric Chemistry, 1992 Springer
Past, present and future climatic forcing due to greenhouse gases
S Guangyu, F Xiaobiao – Advances in Atmospheric Sciences, 1992 – Springer
1993
Aqueous greenhouse species in clouds, fogs, and aerosols
NA Marley, JS Gaffney, MM Cunningham – Environmental Science & Technology, 1993
1994
[PDF] Hierarchical framework for coupling a biogeochemical trace gas model to a general circulation model
NL Miller, IT Foster – 1994 – osti.gov
2000
GLOBAL ENVIRONMENTAL MANAGEMENT
J Taylor – info.mcs.anl.gov
2001
[PDF] from the Vostok ice core after deuterium-excess correction
NJ SHACKLETON, MA HALL, J LINE, C SHUXI – Nature, 2001 – emsb.qc.ca
Nature 412, 523 – 527 (02 August 2001);
2002
Direct ab initio dynamics studies on hydrogen-abstraction reactions of 1, 1, 1-trifluoroethane with
L Sheng, ZS Li, JF Xiao, JY Liu, XR Huang, CC Sun – Chemical Physics, 2002 – Elsevier
2005
Introductory LectureChemistryclimate coupling: the importance of chemistry in climate issues
AR Ravishankara – Faraday Discussions, 2005 – rsc.org
2006
Resistity (DC) method applied to aquifer protection studies
L Marani, PC Alvalá, VWJH Kirchhoff, LPM Nunes, – Revista Brasileira de Geofísica, 2006 – SciELO Brasil
2007
The importance of the Montreal Protocol in protecting climate
GJM Velders, SO Andersen, JS Daniel, DW Fahey, M – Proceedings of the National Academy of Sciences, 2007 – National Acad Sciences
[PDF] Historical Overview of Climate Change Science
CL Authors, L Authors, C Authors – ipcc-wg1.ucar.edu
To clarify, I meant 1% from, 30% to 31%. That could be construed as 3%, which matches the graph in #18.
#21, Geoff, just because we have failed in our present course does not mean we should not try more research. I completely agree, though, that handicapping society from our present state of knowledge is not a reasonable thing to do, and is simply the result of fear.
#24, Arthur, you are quite correct. The less we know about the materials and the higher the penalty for failure, the higher the safety factor. 0.33w/m^2 as a standard deviation is a joke. That may be the standard deviation for the models, but you can’t have a standard deviation for something never observed that you don’t understand. Since the highest penalty for failure may well be sequestering carbon instead of feeding the world with it, we really should be sure…
#27 rafa, see the thread here about Spencer on Cloud Feedback.
I will also note there is a severe lack of understanding of simple thermodynamics in this thread.
Where can I buy a copy of the engineering-quality exposition for the bridge to St Paul?
I have a different issue with the argument which Dr Annan’s email presents.
The Stefan-Boltzmann equation is fairly straightforward (notwithstanding the albedo uncertainty), but it seems to me that the interpretation should be quite different. The temperature Te is calculated as -18C, 33C below the assumed surface temperature of 15C.
However, the jump to assuming this is all due to GHG effects is a very large logical jump to my mind.
I would argue that the -18C is the result of the following:
This interpretation is so obvious, it is hard to see why AGW supporters ascribe the 33C to GHG, without argument from other scientists.
What am I missing?
*The average is biased by the T^4 dependence and the average position of the emitters is higher than that (because the lower-temperature molecules are emitting appreciably more than the lower-temperature)
31
Correction: the altitude would be higher than the 3km I stated there. It is more like 5km, or 15,000 ft.
The Stefan Boltzmann equation doesn’t apply to T_e but only to the real temperature T(x,y,z,t) .
T_e doesn’t therefore represent any real temperature or average or approximation thereof and any interpretations that could be done with it is wrong and irrelevant .
Specifically the 255 K don’t represent anything physical relating to the real Earth’s temperature fields .
Please do NOT use Stefan Boltzmann with anything else than a local temperature as it is only valid for isothermal bodies in equilibrium .
You can of course integrate local equilibrium equations over arbitrary time-space domains but what you get then is no more the usual Stefan Boltzmann law and depends on many things the integration domain being one of them .
There is an interesting timeline on the derivations of climate sensitivity here too:
http://www.skepticalscience.com/argument.php?a=115
I think it’s quite a good summary. Thankfully the author, despite the nature of the website, kept his thoughts to himself. The follow up comments are interesting too. At least some of the empirical “evidence” seems to come about from assumptions about the influence of CO2 in the historical records eg ice core data, which is not too far from guesswork.
I expect the engineering documentation for the Thames barrier ran to many tens of thousands of pages. But even now its mode of operation is constantly changing due to new findings. Should they have delayed building it till these findings had been completely nailed down?
James said:
Steve Mc said:
James’s phrasing was a little loose, so the resulting interpretation is wrong. As Arthur stated in #24 GCMs do not enforce a constant RH approximation. Remember the physics in a GCM needs to work both at the cold poles and in the hot tropics, so if you start fiddling with the relationship then the model will likely go out of kilter somewhere.
#26 Tom Vonk
Similarly, the simple model is easy to criticise in this way as it assumes uniformly spread radiation on a uniform globe. But the GCMs solve the same basic equations on each grid square each of which takes into account the differing solar input, temperature and albedo at each location of the earth. I’ve used “effective radiation temperature” and “effective radiating level” here before – if I fully qualified them every time I used them, even fewer people would read my posts.
I don’t mean to be obtuse here, but if an engineering-quality exposition is desired, then the place to start seems to be a Request for Proposal laying out the terms and objectives. Maybe a system controls engineer can draft some specs?
#34, JG, and it all comes down to the time constant(s), which is ‘not too far from guesswork’ with the present state of knowledge.
========================
31 33 Tom Vonk
Strictly speaking, you are correct. However, averages are often used (e.g. the sun’s temperature and emission) and have some usefulness as long as one remembers that the “average” is biased by the strong T^4 dependence.
Strictly speaking, there is no Global Anomaly, either…..
Just as the ideal gas law applies to ideal gases, the Stefan-Boltzmann equation applies to black-bodies. And just as the ideal gas law really doesn’t work with non-ideal gases, the Stefan-Boltzmann equation doesn’t really work well with non-black-bodies. Neither the earth nor the atmosphere are black-bodies, no matter what kind of fudge factors are applied. Why is it, then, that Stefan-Boltzmann keeps being applied to them?
And, speaking of bridges that fall down: The engineering paper that was drawn up is merely the theoretical basis for building the bridge. A lot can occur during the building that cannot be designed for, such as taking shortcuts, using inferior materials, or lack of competent oversight and management.
You don’t get the point .
There is nothing wrong with simple yet physical models where the right laws or valid approximations thereof are used .
So again one more time .
There are at least 5 errors in that “model” . Not approximations of a real system (Earth) . Errors .
Wrong use of natural laws . Wrong use of concepts like “estimator of the greenhouse effect” . Wrong inferences from wrong values . Mixing up of apples and oranges .
All that taken together is called wrong physics .
Thinking that so many errors can give even an approximate order of magnitude of “the climate sensitivity” is certainly no science .
The only qualification for the effective radiation temperature is unphysical and that is short enough .
re 36
I would argue that the Millennium Bridge in London would be a better example of this. The point of AGW research is not to find some scientific truth but to discover the policies by which this problem should be addressed. If our understanding of this is only superficial then massive hardship could be created without effectively addressing the problem.
A good example of this would be found at the URL
http://en.wikipedia.org/wiki/Hyatt_Regency_walkway_collapse
A very elegant design that caused many deaths.
That’s a totally irrelevant observation. If you’re going to build a bridge, then you need engineering documentation – and even then you can have problems. No one would start building a Thames barrier based on something like Annan’s email or a little “peer reviewed” article in Nature about Thames barriers. You’d do proper engineering.
#37. That’s a big undertaking.
Perhaps when large mirrors in orbit are used to evaporate sea water to control weather and rainfall that will provide the lab data needed to quantify parameters for GCMs. ISTM that any period of relatively stable climate precludes the possibility of strong net positive feedback.
If GCMs use lots of positive feebacks to achieve historical climate tracking they may just be substituting tweaked instability for unknown forcings. Small wonder they would predict haywire futures.
43, that’s right. Even the RFQ is a big job.
#36, SM, remember ‘cautious interpretation’ before ‘precautionary principle’. Where’s the science to cautiously interpret?
=======================================
37, and btw, as a licensed control systems engineer (and chemical, as well), I wouldn’t presume to have the tools to even begin to write such an RFP. Even the basic definition of the problem requires a level of interdisciplinarianism that would be unprecedented.
re 44. then again, they may be tracking tweaked historical data.
#43 and #47. Yeah, I know, but an engineering-quality exposition deserves some measure of quid pro quo to be a fair request. Perhaps with such a complex problem, breaking it into a structured set of questions to be answered is the point to which climate science needs to return.
#43 Steve Mc
I don’t think so – one of its key aspects is its height, but the chosen height will be based on many uncertain variables. The engineers picked one choice of the variables to make the decision on the height. No doubt they could give you the engineering documentation that produced that decision, but some equally competent engineer will have picked a slightly different set of datasets and models, and come up with a slightly different but equally justifiable answer.
Similarly climate science is not transfixed on 2.5C. Some models are more sensitive and some are less. Some are equally sensitive for different readings. Similarly, empirical observations of past climate give higher or lower results depending on assumptions about albedo etc.
For example, how do you get the approx. 25W/m^2 swings that are needed to explain the extremes of the ice age cycles? What proportions were albedo, water vapour, greenhouse gases, clouds and the sun? Can you describe that in an “engineering exposition”.
As it happens, I am working on long-term projects to try and improve descriptions and management of climate model components and earth system models, so a scientist can point to an unambiguous description of the model that produced the data s/he is using. So I’m not just trying to be awkward here.
re: #42 Boris,
For example, the difference between taking a walk with a 3 foot pole hanging between two fingers and balanced on one. You can get good with balancing it but a change, like in the length of the pole, will have little effect on the hanging pole, but considerable effect on the balanced one.
Thats a totally irrelevant observation. If youre going to build a bridge, then you need engineering documentation – and even then you can have problems. No one would start building a Thames barrier based on something like Annans email or a little peer reviewed article in Nature about Thames barriers. Youd do proper engineering.
I wonder what the engineering proposals for the Great Pyramids,for Xerxes’ final bridge across the Hellespont, for the Roman bridge across the Rhine, or a Gothic Cathedral looked like. I am not being facetious, I really wonder what degree of certainty they thought they needed for what they were doing and how they got it — or did not since the Hellespont bridge took a couple of tries.
Steve: I’m not saying that we should do nothing. If we don’t have the time or skill to do things properly and we have to make a decision, then we have to make a decision and rely on the best institutional advice that we have. But that doesn’t mean that we should stop pressuring the intellectual resources that are available to produce better and better information. Surely climate scientists can do better than Xerxes.
A couple of people asked or raised questions about that absorption graph (it distorts the impression from casual perusal, etc.) Unfortunately, it isn’t “my” graphic, so I can’t help improve it.
I think one of the things here that needs to be discussed further is what effect varying albedo would have on his calculations. Anyone want to give it a shot?
Also, I notice no one criticized Annan’s derivation of a feedback-free sensitivity of 1. Why the double standard? You guys vilified me over this!
As if all the problems in Nature, science and life could be explained and solved in a good old engineering style!
Asking to explain the value of 2.5 deg C temperature increase for doubled CO2 with “an engineering quality” is like asking to describe the functioning of the brain in a 5 pages user-guide as clear, complete and easy to understand as a user-guide for a flatiron!
Sorry, but some problems are too complex for the engineering approach (at least initially). That’s all. We call that Science.
Steve: No, I’m not suggesting a 5-page explanation. I’m suggesting something that might cost millions of dollars to write and run thousands of pages. The issues are important enough to warrant careful study. I’m not suggesting that the conclusions of such a study would necessarily be to do nothing. They might conclude that the matter is more serious than people think. IT’s time to move beyond little articles in Nature.
I have a dumb question re James Annan’s kind contribution to our discussion.
After he calculates the 3.75 watts/m^2 per C by differentiating wrt Te, he says
But this is the nub of the calculation.
Where does that come from?
47, the IPCC did get a start on that. The problem started to come in when instead of contracting the job to a consulting firm with experience in these matters and liability to worry about, it ended up becoming an internal UN project, and soon the diplomatic and NGO types ended up calling the shots. I actually think that the basic structure of the IPCC reports is generally right; the problem is more with execution.
54, perhaps it did get started with the best of intentions, however it seems the IPCC was too interested in answers before fully elaborating the questions (to maka a gross generalization). Steve seems to be calling for a Manhattan project.
When the GCMs derive a certain amount of “global” warming for a doubling of CO2, do they come up with clearly separate figures for the two Hemispheres?
Let’s take the mid tropospheric temperature anomalies in the Southern Hemisphere since 1979 (RSS MSU or UAH MSU). No discernible warming is apparent. If we go in more detail and take the Southern Polar anomalies we even see a clear cooling trend. So is this difference between hemispheres replicated in the models? And what then explains the lack of warming in the Southern Hemisphere despite the increase of CO2?
Andrew said :
Then you didn’t really read because I did .
Pat Keating said :
In the same vein as Andrew above . The T_e is unphysical and the 3.76 is wrong so nothing can be inferred from that figure .
As for the radiative transfer question , this answer (3,7 W/m² per doubling) comes from a numerical model .
There is no simple , intuitive and easily understandable derivation of that figure .
You simply MUST run a multilayer model with Hitran database plugged in it 2 times .
Once with a value X for CO2 and once with a value 2 X everything else being equal .
Then you make a diference between the 2 runs and find whatever you find .
Useless to say that even if it is fashionable to say that “the radiative transfer is well understood” there are many components of the same that are not and there are many assumptions (like clear sky , adiabatic lapse rate , no particulates , gaz emissivities etc) that are questionable .
There are even people running radiative transfer models which are of course “well understood” who were extremely surprised when I taught them that nitrogen and oxygen did absorb and radiate in infrared .
Of course as they did not do so in the numerical model , how could they know ?
So yes , much about the radiative transfer is (relatively) well understood but not everything is known by people doing the models and even less is then actually modelled .
So that’s the short version of an answer on your question .
Tom, I meant the people who criticized me earlier. But thanks anyway.
55, Manhattan project is a very good model, because unlike the German and Russian nuke programs, the American project had a technical director (Oppenheimer) and an administrative director from the Army Corp of Engineers (General Groves). We remember Oppenheimer, but Groves was just as critical to the project’s success. The UN seems to have followed the German/Russian model, and is getting similar results. Including the analog to the massive screw-up that Heisenberg made on the critical mass calculation.
Larry, are you suggesting that Groves would have caught Heisenberg’s mistake? It seems to be that the problem is that some people were over eager to use preliminary results. Just think: what if the had used the bomb before testing it? Well, of course they wouldn’t do that. Your right, though, if we had some engineer type discipline, they’d figure out a result more clearly, then use it to make predictions.
Given the large number of parameters available for tweaking, I would be very surprised if one could not get “reasonable” results from the GCMs with just about any assumption regarding water vapor feedbacks.
Then again, there seems to be widespread disagreement regarding just what a “reasonable” result consists of.
You act as if the short articles and letters in Nature and/or Science are the only climate science papers out there. Yes, these papers end up getting cited more often because they are written for a broad audience. They presume the reader either knows the background literature or will dive into them, and references therein, and references therein therein, and so on, if they don’t.
Would this be summary of all climate science to date? You’ve been asking for such a document for years … and, as you’ve stated ad infinitum, climate scientists aren’t familiar with such a format and/or refuse to write it. Why doesn’t someone show them? If they don’t know how to do it, yet you keep asking for it, clearly you will never receive what you are asking for.
60, very good question. Groves insisted on redundancy. That’s why they perused the U235 enrichment process and the Pu breeding process simultaneously. Groves actually was involved in the selection of Oppenheimer, and made sure that everything was checked by as many different sets of eyes as possible. That generally doesn’t happen when you put the scientist in charge of operations.
Of course, the US program was also blessed by abundant resources of both the natural and human type, since Hitler chased his best and brightest out of the country and off of the continent.
Steve McIntyre’s request for an “engineering-quality” exposition is reasonable, but may not be achievable for very innocent reasons.
I have also been interested in the question of how to get 3.7 W/m^2 from a C-O2 doubling, and how to get a temperature increase from that forcing. Based on the responses I have gotten from the RealClimate folks, my impression is that these numbers come from rather detailed radiative-transfer models (for the forcing) and even more complicated GCMs (for the warming).
The problem with explaining the results of a complex calculation like that is that you can’t: Even when you’re quite sure that all conceptual & systematic errors have been identified, there is no way to prove that it is really correct; and there is no way to easily describe the “reason” the results came out the way they did. The best you can do is:
– Explain the physics behind the calculations
– Present the equations expressing the physics
– Explain the simplifications you must employ
– Discuss the architecture of the calculations
– Display the results
– and then do some sanity-checking to see if the results give a reasonable match to what has been measured or could be expected. In doing this, the limitations imposed by the simplifications are of course critical.
I have some exposure to this area myself, as in an earlier career I worked on the physics of free-electron (X-ray) lasers. The simulation was humongous, but the results matched the measurements. There was NOTHING like what any engineer would have wanted to describe the calculation: Just programmer’s notes, and published papers providing (in a very minimal fashion) what I described above.
A good radiative-transfer model for the atmosphere (if 3-dimensional) would probably be as complicated as my FEL; a good GCM more complicated. The documentation corresponding to what I had accessible to me for the FEL would likely be a set of internal documents. Only two things would be likely referenceable:
i) Published papers, which would discuss the physics, some idea of the calculational strategy, and measures taken to avoid some known weak points
ii) Textbooks on the art of GCMs.
For i), I would imagine that the best starting point would be papers out of Hansen’s group.
For ii), I have found a few recent textbooks on GCMs, and would like to study them further, to see how far they go.
Now, what Annan has provided is not (and does not seem intended to be) this level of explication. He is just providing a “back-of-the-envelope” calculation which is part of the sanity-checking that I mentioned earlier, addressing the question: “Does this result bear any reasonable relationship to what a simple-minded way of thinking about this problem would give?” And his conclusion is that it does.
Attacking issues concerning T vs. T_e are, I believe, off the point: the use of the Stefan-Boltzmann law is itself a gross approximation (as pointed out by others above). Annan’s discussion addresses the question, “Is this ballpark-reasonable or not?” It does not (and is not intended to) provide a fully consistent argument.
Unfortunately, the book that I got, An Introduction to Three-Dimensional Climate Modeling, by Washington & Parkinson, is not accessible to me right now. I hope to get into it this year.
A particular questions that I would like to know more about:
How is the distribution of C-O2 vs. H2-0 taken into account? Something I’ve thought about is that, if there’s enough C-O2 above the level at which H2-0 settles out (about 10 km), then the presence of water vapor (at least for the infrared region where the two overlap) doesn’t make any difference: the C-O2 will dominate. As I understand it, if the altitude at which the optical depth of C-O2 in that band equals 1.0 is well above the water-vapor level, the total amount of atmospheric water vapor is irrelevant. This might be the explanation of why such tiny amounts of C-O2 are critical in the 15-micron IR region (which is, after all, shared with water-vapor).
The physical picture I have in mind for this question can be found in the in-progress text by Pierrehumbert:
Section 3.3 (near equation 3.8), http://geosci.uchicago.edu/~rtp1/ClimateBook/ClimateVol1.pdf
#62
That’s not true. Sometimes it takes a long while and a final strong push for a great idea to break through the inertial tropopause of policy world. They know how to do it: Manhattan. They just aren’t doing it.
What if the climate system is a truly chaotic system, and you cannot model it, as any input may be a postive feedback at one time, and a negative feedback another time.
This seems to fit with Weather Forecasting expeirience, and the geological record. Anything can happen at any time.
Or maybe you just cannot engineer the planet’s climate, perhaps it’s futile to try!
#66 Over short timescales, chaotic (nonlinear) systems respond nearly linearly to forcings. It is a fallacy that you can not model chaotic systems. The chaotic jointed pendulum is easily modeled, for example.
Neal J King’s #64 is substantive, worthy of reflection.
Steve has a question. I have an answer. It will take ten plus years and cost roughly the amount spent on two aircraft carriers but an answer would be forthcoming although the details are sketchy. Here it goes.
Due to our current level of understanding combined with a lack of computational power (anyone who has attempted to solve the fully expanded Navier-Stokes equations in cylindrical coordinates for compressible non-Newtonian fluids will know what I speak of) has been antithetical for a proper four-dimensional (time dependant) dynamic treatment. No rolling of eyes just yet let me finish.
To mathematically describe weather or climate we likely need to employ the use of dynamic chaos statistical mechanics (order in systems with no periodicity) in order to describe such things as cloud formation and dissipation. We need also utilize complexity mechanics (complex systems that spontaneously become organized) to describes such things as hurricanes, tornadoes, and thunderstorms so we can resolve some of the more imponderables we are wrestling with currently. No one is doing this right now and I doubt it will happen any time soon. This on top of the things we have a partial handle on like heat transfer effects (radiation, conduction, and convection), convection being the least understood heat effect with respect to global climate theory. There is this thing called wind (not breaking wind Steve Mosher), which is a devil of a thing mathematically to handle because of its non-linearity let alone its cause and effect paradox. A future paper may show that radiation is not a simple matter of exploiting the Stefan-Boltzmann equation, well see.
Diffusion, mass transfer in fluid systems (breaking wind applies here), is non-trivial concerning atmosphere/oceans and needs an engineering analysis including a suitable thermodynamic handling of mixtures instead of treating air and oceans like a homogeneous solution, multireaction equilibria and whatnot, including a detailed treatment of fugacity, in locations where pressure is not at STP (standard temperature and pressure), like most of the atmosphere and most of the oceans. I appreciate the GCMs attempt to account for such things, but more work is required to get it to engineering standards.
The above-mentioned tools are the bread and butter of the engineer (chaos and complexity will be a tool of the future). An engineer would fail if they attempt to design something with nothing more than data from a computer model to go on. Engineers begin with first principle theoretical formalisms like F=ma, or a=dv/dt, or v=ds/dt, and when necessary, extrapolate from a series of predictive and reproducible experiments in the absence of a tested mathematical based first-order theory.
Since we lack an engineering-quality exposition of how 2.5 deg C is derived from doubled CO2 we need reliable experimental work to establish an empirical description that is reproducible and falsifiable. Now for a rhetorical slight, rather than the collective sigh (exhale noisily) from modelers when they realized that all feedbacks turned out to be positive (giggle quietly).
More rhetorical and conservative cant: An honest engineer could never write a policy that affected everyone on the planet without first understanding the underlying mechanics that describe the system. The precautionary principle need only apply when over-engineering a design to account for the unpredictable, but certain to happen, like earthquakes. To over-engineer (plan) the economy is an engineering malfunction, gross and minor (Kyoto). Did we not learn anything watching sixty years of planned economies fail one after the other? Okay, now that Ive pissed off the modelers and the Marxists, Ill continue in a non-partisan manner.
I guess I should make my point now. We need the experimental people to get busy and they need the means to do it. It is the only way in my opinion that this problem (which happens to be the crux of the AGW dialectic) will be resolved satisfactorily. After which, we can with confidence, assign a true level of uncertainty to the results with real error bars, not artificial ones.
How might we realistically simulate weather to answer Steves question. The facility (the bricks and motor part) necessary would likely resemble the size of, well, ever seen the movie The Truman Show? Hoping no one will notice the lack of details here. We will inaudibly skip to the important stuff. The experimenters could test what forcings influenced what variables, and so forth, and which forcings had the greatest impact on the system, CO2, water vapor, magnetic fields, cloud dynamics, phase equilibria (water = liquid, solid, gas, plasma), and so forth. I suspect the results will not be intuitively obvious. Meaning there will be surprises. Engineers call this serendipity. Laity calls it science. We do not need to consider feedbacks or teleconnections because we will have a real experiment with real data, wow, how novel.
The Truman SCCE (self-contained climate experiment or ess-see SC for short), cannot model real weather, but it would be orders of magnitude better than what we have now, which is essentially nothing. The data would be invaluable for GCM modelers, whom Ive slagged earlier but have maximum respect. Moreover, it will answer Steves question with uncertainty limits and we neednt argue about the nuances of esoteric statistical mechanics because we will have real data.
Now for a reality check. How much? There is a precedent. Answer this question. How much did it cost to construct CERN? Ill leave that with you for your homework assignment. Who would pay for it? We would all pay for it of course because the answer is globally important. Perhaps we could persuade Warren Buffett and Bill Gates to mitigate some of their liquidity that they claim is for helping humanity? More rhetoric: The cost would surly be less than even one year of the proposed Kyoto Protocol if it was ever put to practice. Great idea: Once we have our answers, and I think Buffet would like this part, we could convert the damn thing into a theme park and let it pay for itself.
If you have a cheaper idea that would garner the same kind of results, then I humbly genuflect and announce red in the face a Roseanna Roseannadanna, never mind. If not, then it is worth considering. We could call it the Truman Ess-see SC Dome with teams of engineers from around the world to design and build the thing, scientists to design and interpret the experiments, and modelers to keep us honest. UN beaurocrats need not apply.
Anomaly graph
These discussions remind me of my stance that the “global mean temperature anomaly” is probably just some basically meaningless number. Even if it’s derived correctly. BTW, the main GISTEMP page gives the anomaly base period as 1951-1980, and so do the data pages. Interestingly enough, the start of the period has uncertainty lines of .2C, then .15C now .5C In any case, if you look at the tabbed daata, they don’t have 2007, but 2006 the value (notice I said value) was lower than in 1998, 2002, 2003 and 2006. It’s looking like 2007 will be more (average for first 11 months is .74C, partly due to the highest Jan in history of 1.09C). By the way, they now only use ice-free water for ocean temps. It doesn’t say if it counts them as land though. Hmmmm…..
meteorological stations
Interestingly enough, the meteorological stations show monthly mean surface temps that don’t seem to be doing much of anything the last decade….. Does this include readings of the ice at the poles as land?
And how are those last few percent of SSL numbers the satellites can’t reach taken into account anyway? One would imagine the water and/or ice would be quite cold…. The poles with their cold dry air and either ice or cold water. What could their behavior do to the average. Hmmmm……
Forget all that. The question is, what does the ~.8C trend in what we’re sampling and averaging and calculating tell us? What’s the margin of error? Forget that too, forget questions about the number or location in and of itself.
What does an average per year of 13.9 C over 100 year base period (or GISS’s suggestion to estimate 14C for 1951-1980) that is now at about 14.5 or 14.7 or 14.8 C, what does that show us on a planet that has a single point measured range of -89C to +58C? Anything?
So even if you ignore the number itself (which is in and of itself probably meaningless; it could be just showing us how we’ve improved the accuracy of the instruments and methods in the first place; and is in any case simply an average of averages of samples covering too large and varied an area) and focus on answering the main question:
(Remember; the trend is land/ocean, but the range is land only — at two different points that are chronologically and geographically separated at one time on two days where the temperature happened to be being monitored.)
What does a trend of .8 (over 127 years in a range of 147 degrees (.54%) on land) in the lower troposphere and ocean (minus areas not covered by satellites) signify?
The answer? Probably nothing. And there is no such thing as A global temperature.
So what is there then? There is a sampled temperature reading averaged (daily) averaged (monthly) combined and calculated (cell and cell versus cell) calculated and derived average (all cells) of air 5 feet above the land of the material of the surface combined with sampled (etc) sea satellite readings of the top layer of water. Then that is compared to the average of 14C on a +/- basis from the average of that number over 30 years. This is what’s trending up .8 since 1880, based off of that 30 year period of the same number, what they have termed the “global mean temperature anomaly”.
Of course, as you go back, the way those are done now used different types of thermometers for the air at various times, and vessels and other things for the water. So the GMTA could be that (how the measurements themselves are taken) (all some none) or it could be the way climate is changing on its own (all some none) or it could be the burning of fossil fuels and land-use change (all some none).
The models suggest it is the last one, the IPCC claims it is the last one based upon that. But there are too many unanswered and unanswerable questions to come to any firm conclusion, because of the models, the assumptions, and the reliability of the readings. I mean, if it signifies anything in the first place. Then you have to start discussing how much of which is doing what.
But it’s trending up .8! 😀
We need significant new investment in the modeling work, to take it out of the alarmists’ hands and put it back in the hands of the engineers.
The only thing I would add to #68 is make damn sure that uncertainty is a central part of the calculation. I want REAL, full ensembles, not cherry-picked partial ensembles that match some activist’s definition of “convergence”.
Yes, this is hand-waving.
Re: #1
I have to agree with Larry here. In my view what Annan wrote is the “simple” explanation with the major uncertainty once the effects of clouds enter the picture.
The part preceding the cloud effects would fit the email format while the uncertainties of the cloud formation effects and probably considerations on moisture feedback would more appropriately fit an engineering quality exposition. The fact that this part has not been rendered in such an engineering exposition format must be indicating that the analogy has broken down at this point, i.e. the underlying science is insufficiently defined to support such an exposition.
I believe Judith Curry has indicated confidence in future climate models handling moisture/cloud feedback, but did not supply any details as to what bolstered that confidence when she commented here. Surely an engineering exposition would not be constructed based on a show of hands by scientists, no matter their eminence in the field or IPCC precedents for favoring such evaluations.
#68: Ian McLeod:
The problem with your proposal is that in order to make that investment into calculational hardware worthwhile, you also need to gather data points on an appropriate length- and time-scale: rather fine. The amount of monies spent on climate-science today would not be a drop in the right-sized bucket to deal with this.
The problem we face is that the GW issue is not one that we can defer. If you want to say that the question is open, then it is OPEN, and that means that real danger is a distinct possibility; and the fact that an engineering-quality calculation is not available does not get us “off the hook”. If you want to say that there is no danger, then you are claiming that the question is NOT open, and then I would ask you for your proof.
It is an unfortunate fact that the climate issue is not nearly as simple as the free-electron laser issue I studied before (as discussed in #64.
As a start I’d like to see:
1. a list of unknowns, or partially-knowns, where assumptions are needed,
2. the assumptions which might credibly be made,
3. the sensitivity of the final result to each of these possible assumptions,
4. the assumption chosen, and a good discussion of why it was chosen
Re #73
The launch of DSCOVER would have been a good start!
71 Kenneth
Annan said:
Kenneth Fritsch:
The problem is that even the ‘simple’ explanation is not there. As a research physicist, I would like to see the 3.7 watts/m^2 calculation before I accept it, or at least be able to see the assumptions on which it is based.
Right now, I am going way back to basics and looking at those, so if anyone can point me to where I can find the missing bit, I will appreciate it.
#75, Pat Keating:
As I mentioned in my #64, the general picture of the problem is described in Pierrehumbert’s text. However, a better book for the radiative-transfer issues is:
John Houghton’s The Physics of Atmospheres. He does the basics of the calculation, spread out through the entirety of the text, but doesn’t come anywhere close to calculating the specific numbers for the Earth. (His book spans several planets.)
But it was useful for getting an idea of how the radiative-transfer part of the greenhouse effect really works.
(It is unfortunate that a real explanation of the GHE, as in Pierrehumbert, is quite a bit different from the “high-school physics” version that is presented almost everywhere, even by people who know enough to know better. The only reason that I’ve happened to learn it was to clarify issues raised in disputation on the topic.)
Pat Keating writes:
This is precisely what is discussed in Ramanathan and Coakley (1978). But their analysis doesn’t support your conclusion.
Re: Ramanathan
Prof Ram is still going strong — his web page nakes interesting reading:
http://www-ramanathan.ucsd.edu/
I can’t find his 1975 paper online, though it may be avail. at http://www.jstor.org/
If so, and you hav access, can someone email me a copy? pdtillmanATgmailDOTcom
Re: Idso, Inverse greenhouse?
SB Idso, 1984, “What if increases in atmospheric CO2 have an inverse greenhouse effect? I. Energy balance considerations related to surface albedo”, International Journal of Climatology Volume 4, Issue 4 , Pages 399 – 409
Did anything ever become of this? I didn’t realize this was so old a paper http://www3.interscience.wiley.com/cgi-bin/abstract/113490285/
but, since I’ve gone to the effort, wth… 😉
3) Annan’s email: anyone know what “RHS” stands for? Context, para. 3:
TIA, Best for 2008, Pete T
#77, me:
A further thought: The reference I gave, by Houghton, could not be considered as an authoritative source for the 3.7 W/m^2 (since it doesn’t mention it), but is rather a book intended to explain how certain aspects of physics (such as radiative transfer) can be applied to atmospheric issues. So it depends upon (and references) textbooks on radiative transfer, like Chandrasekhar’s.
There are also more recent books. One that looks relevant is Thomas & Stamnes, http://www.amazon.com/Radiative-Transfer-Atmosphere-Cambridge-Atmospheric/dp/0521890616
although it seems to be confined to 1-dimensional calculations; but that might be good enough.
Steve, have you ever read the paper by Manabe and Wetherald, (1967) “Thermal Equilibrium of the Atmosphere with a Given Distribution of Relative Humidity” J. Atmos. Sci 24(3) 241-259? They give a pretty transparent description how they calculated the effect of doubled CO2, where the model is laid out for examination. They calculated a change of +2.36 C for doubling of CO2 to 600 ppmv, for fixed relative humidity. The number also assumes no change in average cloudiness. This may be the source of today’s estimate.
I see a sensitivity of 1C, calculated somewhat confidently, then an excercise in hand waving, with copious appeals to cimate community opinion, to get it to 3C. This would be a normal step in the scientific process, if they weren’t asking for trillions of dollars and control of the economy.
Why climatologists are so married to the 3C number, when it has so little empirical support, can only be ascribed to the political and economic stakes. Gavin can choose to ignore the recent McKitrick paper, as well as the disagreement in general between surface and sat temps, but at some point a tipping point is going to be reached and Hansen’s numbers are gonna get tossed. Without the surface temps, how will anybody get the models, as currently constructed, to agree with any physical measurement?
Concerning Oppenheimer and Groves, the story in the ’50’s and ’60’s was that Oppenheimer succeeded not *with* Groves’ help, but *despite* it.
Of course that was before the glamorization of Groves in the last few years.
But I agree, a Manhattan type project is what’s needed. The penalty for failure is immense.
#78 RHS = Right-hand side
Three things.
1. #12 Mosher “Now, its an unfair challenge because the gain is empirically estimated.”
Empirically, I have a model, described in an article in Steve’s intray, which combines CO2 and solar cycle effects, which gives a sensitivity of 1.4+/-0.3C, assuming the CO2 effect lags by 10 years (which fits best). Without resorting to aerosols it shows a flattening of temperatures from 1940 to 1970, which apparently the GCMs struggle with. But it does, admitteddly perform poorly on the last 10 years of HadCRUT3.
2. #13 Wingo, saying that the 1370 figure is wrong. Well, it’s wrong, but since it is only used to calculate T_e, whose value is not critical here, I don’t think it matters too much.
3. I remember on one thread 2-3 months ago someone mentioning the thought experiment of the greenhouse being a metallic hollow shell, and how viewing it that way the sensitivity to CO2 radiative forcing comes out as one half of the sensitivity to solar forcing, because of the directional effects. Is this relevant here, and if not why not, and as I seem not to have bookmarked it, can anyone repeat the reference?
Thanks,
Rich.
Re: #75
Not sure what you are looking for but I always liked NJ Shaviv’s simple explanation here:
http://www.sciencebits.com/OnClimateSensitivity
#78, Peter Tillman:
– RHS: Come on, Pete, where’s your imagination? “Right-Hand Side” !
– Idso: So in 1984, he was proposing that two speculative ideas would cancel each other out, leaving only the result that more C-O2 in the air will be good for agriculture. It seems we’ve been hearing this hope for sometime; but all the detailed discussion I’ve seen on this topic conclude that the impact on agriculture will be negative. Whatever improvement there may be from increased C-O2 has to be traded off with the likelihood of reduced water availability.
Neal J. King #72
You read me correctly. However, I am more open-minded than you may perceive me to be when it comes to AGW, excluding the unconscionable exaggerated view the IPCC holds concerning their assigned levels of certainty.
The issue of determining how much warming with how much CO2 is the question we are all desperate to answer. A resolution will not be available until a project on the scale I suggested in #68 goes from the blueprint stage to implementation.
David Smith #73
You forgot about the unknown unknowns al la Donald Rumsfeld. [B]ecause as we know, there are known knowns; there are things we know we know. We also know there are known unknowns; that is to say we know there are some things we do not know. But there are also unknown unknowns the ones we don’t know we don’t know.”
Andrew (#51) – you must have missed my critique of Annan in #23. He’s doing a very rough calculation which others have pointed out also.
However, Tom Vonk’s list of errors in #25 is somewhat absurd… the whole point of the simplified Stefan-Boltzmann argument is to match up incoming (solar) and outgoing (thermal) radiation; those only match on an averaged basis, the equation actually has no meaning on a local basis (simple example: at night, incoming solar radiation = 0. Outgoing thermal radiation is almost as high as during the day, depending on location – so clearly not balanced). The temperature described is most certainly an “effective” temperature corresponding to the averaged rate of thermal emissions from our planet into space.
If we had no greenhouse effect but somehow maintained a uniform surface temperature across the planet, then Annan’s “T_e” would match the real temperature of the surface. With no atmosphere at all (or ocean) we’d be like the Moon, with extremely high daytime temperatures and very low temperatures at night. But even on the Moon the average radiative emissions between daytime and nighttime across the surface correspond to the same effective (“average”) temperature of about 255 K.
But more CO2 = more water vapor from feedback!
RE: #78
Pete Tillman says:
I posted it last night, but it was run over by the zamboni:
RHS = Right Hand Side
i.e. the derivative of is
is 
HNY
Pielke Sr might take issue with the claim that “the relative humidity remains nearly constant as the atmosphere warms” and water vapour feedback:
http://climatesci.colorado.edu/2007/12/18/climate-metric-reality-check-3-evidence-for-a-lack-of-water-vapor-feedback-on-the-regional-scale/
Steve: You wrote:
Worse, as far as Ive been able to determine, radiative transfer theory is not itself sufficient to yield the conventional value of 3.7 Wm^-2 per doubling of CO2″. Getting to that value requires assumptions about the atmosphere and lapse rates and things like that – Im not saying that any of these calculations are poorly done or incorrect, only that they are not simply a matter of radiative transfer.
I don’t think this is so. Just go to a radiative transfer model, do a run w/ pre-industrial CO2 and one with double pre-industrial CO2 and you get a difference of 3.7 W/m^2 at the tropopause. I don’t think you need to make any assumptions about lapse rate, etc.
84 Rich
I thnk you may referring to Willis Escenbach’s post #251 on this thread:
http://www.climateaudit.org/?p=593
Remember your catechism people!
Annan is somewhat more circumspect:
Re: #64
Neal J. King says:
Would this dome work: http://www.b2science.org/?
77 78 Jon, Peter
Thanks for the Ramanathan suggestion.
I have found the R & Coakley paper thanks to the info you both gave me. Now comes the hard part…
The estimate of Climate sensitivity reminds me of Drake’s formula to calculate the number of radio-wave
emitting civilisations in the universe: A few well known parameters and a lot of guessing.
reminds me of the geohysicist joke that was revealed to me at university:
A mathematician a physicist and a geophysicist go for an exam: There is only one question:
How much is two plus two?
Mathematician: “4”
Physicist: “3 +/- 2”
Geophysicist: “What do you want the answer to be?”
Andrew #8 shows informative absorption spectra for carbon dioxide, methane ,water and other molecules. What is missing is the blackbody spectrum of an object at 255°K (Annan’s effective earth temperature).
By the Wien dislacement law, this spectrum would peak at ~11.4 microns. Now, if Andrew or someone else with more computer graphic ability than I,
would ovelay the 255°K blackbody emission spectrum with the absorption spectra, it will be apparent that an increase in carbon dioxide would be relatively insignificant since the bands are already almost totally saturated and, also lie far from the peak of the blackbody curve.
Thanks Arthur. Sorry I missed it and I’m glad you are willing to criticize Annan for his rough derivation as much as anyone else.
FWIW, here’s a semi-empirical derivation of the temperature rise caused by 2 X CO2, which does not rely on computer models.
Re 64, Neal King
Yes, that’s the answer I’ve gotten too, and it’s rather disconcerting, until you reflect a bit about how fearsomely complicated Earth’s climate really is. Which is why I’m a lot happier to see empirical results, like the Pinatubo natural experiment http://www.climateaudit.org/?p=1335#comment-187366
Ian MacLeod (68) thinks similarly,
Nevertheless, there’s a place for models, and especially for something like climate that’s too big and too messy for intuition to be much help. As King points out, we have quite a bit of experience in dealing with this by now, and I suspect the virulent detestation the climate models get here is because, with good reason, we don’t trust the modelers.
As Steve Mc keeps saying, we need to get the AGW question out of the hands of partisans, in favor of disinterested third parties. Engineers are a good bet. Plus a kick-ass project manager. George Washington comes to mind… 🙂 –really. I just finished Paul Johnson’s masterful short biography, and ol’ George would have been our man….
More realistically, Steve McIntyre would be an excellent choice.
Cheers — Pete Tillman
Phil #95
Nope, that was me who said that, Ian McLeod in #68.
Answer to question: No. Biosphere II is no more complicated than most climate controlled shopping mails. What I am referring to is something where experimenters can input different parameters and then record how the system behaves including letting the system run away or go into cascade failure. That kind of system is very different and would be a massive engineering enterprise. Something on the scale as CERN was I think.
97 Hans
We actually had a true story of a meeting with a technical customer where the technical representative didn’t make the flight. The marketing representative had to give the spiel. At one point, he was asked “Is that at 1-sigma or 3-sigma?”, to which he replied “Which would you prefer?”
98
Look at the bands at 10u and 15u, where the water-vapor has a “dirty window”. Those are pretty close to your peak.
#75, Kenneth Fritsch:
Shavivs explanation is just the same old Stefan-Boltzmann hand-wave. Its really not serious. It doesnt take into account the role played by the different absorption as a function of frequency, key to the GW issue. See just below:
#77, Jon (and thus Pat Keating):
Indeed, that is a critical point: Due to the GHE, the effective altitude of radiation is at 3 km. Thus, that is the altitude at which the incoming solar radiation must balance against the IR radiation outgoing. If there were no GHE, the radiation balance would be happening at ground level. So, the difference in ground-level temperature is indeed due to GHE.
This difference between high-altitude temperature and ground-level temperature is due, indeed, to convection: Its known as the adiabatic lapse rate, which is in the neighborhood of 6 degrees K per km, depending on humidity. If the lapse rate were 0, the GHE would do absolutely nothing to temperature, because the effective temperature of radiation would be the same as ground-level temperature, and both would have to balance the incoming solar radiation. But because the lapse rate is finite, when the GHE moves the balance point up, the ground-level temperature is forced to a higher value for equilibrium.
Further increase in C-O2 will move ever higher the radiative-balance point, which means that the temperature differential (in equilibrium) between ground level and effective radiation level keeps growing.
#80, Pat Frank:
Thats an interesting reference. There seems to be an updated version, from around 1975. Ill have to print it out to read it.
#87, Ian McLeod:
Perhaps I should have used the word one instead of you: I did not mean to imply that I consider you closed-minded.
However, I do not believe that it will be possible to complete the calculation you are hoping for within this new century. And I think we must come to a conclusion on the issue well before then.
#92, Bill Bixby:
Im afraid I agree with Steve (?) on this point: the 3.7 W/m^2 does depend on lapse rate, etc., as discussed in my comment to #77 above. If the temperature at the top of the atmosphere were the same as ground-level temperature, there would be no GHE.
However, I dont see that particularly as a problem: There is nothing particularly mysterious about the lapse rates, either.
My current curiosity is whether or not the concentration of GHGs as a function of altitude was properly taken into account; since the profile for H2-O and C-O2 are very different.
#95, Phil:
I didnt say that. That was #68, Ian McLeod.
#98, pat:
This is a point of confusion caused by the high-school version of the GHE. The GHE is not caused by photons being absorbed by the atmosphere, it is caused by the reduction of the temperature at which radiation escapes to space. Saturation of absorption doesnt make any difference at all: The only thing that matters is the altitude (and hence temperature) at which a photon has a 50% shot at escaping into space without being absorbed by another molecule. All that matters is how much GHG is ABOVE that altitude; having tons of GHG below that altitude makes no difference to the calculation. (Of course, in real life, if you didnt have all that GHG below, the GHG above would diffuse downward.)
#100, jae:
I regard that as a very detailed response to the wrong explanation of GHE.
#102, Ian McLeod:
As said before, the problem is that your toy model would be only a CERN, but to answer the question with the scope you are aiming for needs a measurement instrument that embraces the Earth, with very fine granularity. This is nothing CERN or the Manhattan Project could ever hope to do.
Steve – When you say you want an “engineering-quality exposition” people think you are pitting “science” against “engineering”. I think that all you are asking for is to see the chain of reasoning and the supporting calculations brought together as a coherent package. The 3 C for doubled CO2 paradigm is apparently bolsterd by widely scattered papers, calculations, and assumptions. The problem is that the scatter is so wide that the certainty of the conclusion is in much doubt.
The issue here is that engineers are required to document their conclusions, while academic scientists rarely do.
Re 100, jae, http://brneurosci.org/co2.html
Finally, something sensible! At first glance, anyway. Thanks, jae.
So, let’s audit it!
94, constant RH at higher temperature = more WV in the atmosphere.
I have a simpler question than S. McI’s, how do we convert energy (3.7Wm^-2 per doubling of CO2) into heat and then into temperature? What does the plot of “Earths average Temperature” vs “Wm^-2” look like? Is it linear, exponential, sigmoidal, or is it a rectangular hyperbola dancing around the loci of the energy midpoint of waters change of states?
Peter D. Tillman #101
I did say later in #68, The data would be invaluable for GCM modelers, whom Ive slagged earlier but have maximum respect.
My biggest beef with some modelers is their incessant claim they are non-partisan when it clear to anyone with a particle of sense this is counterfeit.
pat, I’m afraid I have neither the skills nor the data to do such a thing. the best I can do is give you this:
Seems like there’s still plenty of infrared. could be wrong though, and obviously not all is available to CO2.
109 See the first equation in Annan’s email posted by Steve, above.
111Andrew
You have to be very careful with plots like that. At low pressures, those rounded curves are actually a set of sharp spikes spaced apart like a picket fence, with gaps where energy can pass through, for the other gas to absorb.
So, the interference of one gas with another in the IR is quite different at high altitudes than at low altitudes.
Are you claiming that CO2 in the upper atmosphere actually increases the effective thermal conductivity* of the upper atmosphere?
*i.e. what the TC would be if it were a conduction problem.
re 64:
the 3.7 W/m2 stems from
Myhre, G., E.J Highwood, K.P Shine and F. Stordal, 1998, New Estimates of radiative
forcing due to well mixed greenhouse gases, Geophys. Res Lett. 25, 2715-2718
#115. Yes and no, Hans. The figure comes from that article, but it isn’t really derived in that article.
Neil J. King #105
My point in #68, despite the rhetoric, was to produce an artificial environment that could generate some real world data through experimentation with known uncertainty limits. Models produce artificial data based on scientific hunches and are limited in many cases because of a lack of computational power. The modelers have to compromise based on this fact.
If we had an experimental chamber, at least we could say convincingly that based on design x and parameter a, b, c, d the experiment gave us this value. As an engineer, I am inclined to be more trusting of this result so long as we agree that the design simulates real world environment given clearly defined constraints.
If you assumed my thought-experiment was the last word, then I have been negligent explaining myself. I consider it more of a starting point until we can bring to bear a full arsenal of satellite and ground based sensors with known sensitivity and associated error instead of swimming in a sea of questionable proxy data.
Re #31
This interpretation is so obvious, it is hard to see why AGW supporters ascribe the 33C to GHG, without argument from other scientists.
What am I missing?
For what it’s worth, this is the way i learned it (which must be wrong because all of climate science is so egregiously misguided, as opposed to engineering, which is flawless) :
You start from writing a zero-th dimension model for the climate system. Conceptually, imagine the Earth is a black-body sphere with no gaseous envelope around it ; perform an area average of surface temperature and albedo, and write the corresponding values T_g and \alpha. IF the Earth behaved as a black-body, the thermal balance would write :
but this leads to much too cold an equilibrium temperature T_g (255K or so), in contrast to an observed T_g of about 288K. This means we’ve forgotten something important about the system : that gaseous envelope.
A crude way of expressing this is re-writing the balance as :
where $\epsilon$ is some “emissivity” I interpret the statement to mean that GCMs use the constant relative humidity assumption and yield plausible results”, and then go on to trash GCMs for making this shaky assumptions. I quote : Obviously in an engineering quality assumption, the constant relative humidity assumption would need to be thoroughly aired. I think that this is probably a very important topic and might take dozens of pages (if not a few hundred). A couple of sentences as done here by Annan is merely arm-waving through the problem.
Tis, leaves, to this reader at least, the distinct impression that you are accusing all of “IPCC climatology” so stand on an unwieldy assumption without bothering to check it.
An alternative explanation is that your interpretation is simply erroneous. As Arthur Smith points out, GCMs do NOT assume constant Relative Humidity. I think James Annan only mentioned the assumption because it simplifies some analytical estimates of climate sensitivity, which you can use as cross-checks to understand what models are doing. (though i acknowledge the distinction is not crystal clear from Annan’s email).
In a *second* step, he uses GCM results to argue, a posteriori that the constant H in a warming world is quite reasonable. (consistency check).
The REAL problem i see with it is that it is circular reasoning : the argument assumes that GCMs have the “correct” physics to predict changes in RH – whereas the crux of the matter, as you and J.Annan point out, is that cloud feedbacks could change things a great deal, and affect temperature as well as relative humidity.
Re : the glorious virtues of engineering at out supposed ignorance of it all… Are you aware that the formulation of climate sensitivity in terms of feedback factors is taken straight out of the electrical engineering literature ?
Now, please enlighten me : What are the rigorous guidelines that grant a document the enviable superlative of “engineering-quality” ?
Re # 118 :
post got messed up, perhaps because of LaTeX code. How do i fix it ?
#106, Tom C:
Well, I think the real point is that engineers produce documentation that allows someone else, who is on the same team, to carry out a task that the originator wants done. A scientist is presenting the results of a study, the exact details of which he may prefer to keep confidential because hes presenting to potential competitors. The payoff for a scientist is the big talk, where people get to hear about his results. Only a few people will be interested in implementation details, and if he has to explain this, its easier to do it by in-person discussion rather than the hard work of developing really good documentation.
For a scientist, the only time when its worthwhile to do really clear explication is in preparation for classroom lectures or if writing a book. Otherwise, it just takes up time that one could be using to go onto the next topic, or experiment.
The point is that the incentives operating for scientists and engineers is quite different.
#107, Peter D. Tillman:
As mentioned before, this whole argument is based on the idea that GHGs are absorbing the radiation, and this is just the wrong way to think about it.
#109, DocMartyn:
– The 3.7 W/m^2 is the imbalance between incoming solar radiation and outgoing radiation, and it is POWER, not ENERGY. The point is that an imbalance cannot go on forever, and so what happens is that there will be a build-up of energy due to the power imbalance. That will lead to a temperature increase in a way analogous to the temperature increase occurring when you put a pot on the stove, and the increase will continue up to the point that the outward radiation matches the incoming solar radiation. At that point, the imbalance will be 0 W/m^2.
– So the graph would have to be the imbalance vs. rate of temperature increase; or of C-O2 level vs. equilibrium temperature.
– What is that graph? I believe Gavin told me that, within the range that they had varied parameters, it was roughly linear.
#110, Ian McLeod:
Im not sure precisely how you mean the term non-partisan.
If with respect to the theory of AGW: If thats the conclusion that the modeler comes to, thats the side hes on. If I think Im right, I also think that someone with a different opinion on the topic is wrong. Nothing particularly untoward about that.
If with respect to Democratic/Republican politics: If you were to take the point of view that your models indicate that AGW is happening, it seems fairly obvious that this hasnt been the Bush Administrations point of view, and from news reports it seems that the Administration hasnt been shy about making sure that its point of view is promoted over the opinions of the little people working in the actual scientific agencies. So, if one were a climate modeler, why shouldnt one take a distaste to that Administration?
#114, Larry:
Thermal conductivity is completely a non-issue. This is an issue of radiative transport: the energy is conducted by photons.
Ive given a sketch of the explanation in my postings (#64 and onward).
#115, #116: Hans Erren & Steve McIntyre:
Yes, the issue is What is the calculation behind those sorts of graphs?
Plus, my question of, What if the gases arent well-mixed? Although, I guess if the radiative altitude is 3 km, and water vapor goes up to about 10 km, the question is not so important, because the (optical-depth = 1) point still has plenty of water vapor above it.
#117, Ian McLeod:
No, I think I understood you. My point is that your part-1 is only a CERN-level of expense, but your goal is for a part-2 that is hopelessly expensive. I think you would need measurements done every kilometer every few seconds; and not just temperature but wind and humidity.
Re jae (#100) – the article here http://brneurosci.org/co2.html is full of mistakes. Most basic is the very starting assumption:
While there are several minor errors in this realclimate discussion, the table in the middle is highly informative: in particular, a “90 to 95%” attribution to H2O, to the extent you can actually allocate responsibility for the greenhouse effect (since there are overlaps in absorption between different molecules) is simply wrong. Including both H2O and clouds, water and water vapor is responsible for between 66 and 85% of the greenhouse effect (66 is what you lose if you take all the water out, 85 is what’s left after you take everything else out).
Similarly, CO2 is responsible for between 9 and 26% of the basic GHE. That multiplies all the remaining results on the page for climate sensitivity by a factor of between 2 and 3.
A second error halfway down the page:
This seems a little confused (depends on what “lowering carbon dioxide” means), but given the point about fossil fuel use, it seems to be definitely referring to emissions rates, not the CO2 levels in the atmosphere. And that is simply manifestly completely wrong. We are emitting enough CO2 every year to add 4-5 ppm to the atmosphere. But the CO2 concentration in the atmosphere at 380 ppm has accumulated close to 100 ppm total, above pre-industrial levels. So it is most definitely accumulating, and that 100 ppm is not going to disappear “almost instantaneously” if we stop emitting!
The page does not address feedbacks at all: the estimate provided is of the pure CO2 effect only. But they don’t seem to recognize this in comparing their number with the IPCC range of models! So counting the factor of 2-3 error from the start, all this page tells us in truth is that the temperature response to a doubling of CO2 *with no other changes to the atmosphere* is bounded above by 8.6 K (26% of 33 K). That’s helpful indeed!
#30,31. PAt K, you say:
and then proceed to describe your own thought experiment. I REALLY wish that people would stop discussing their thought experiments. As JEG observes, climate scientists aren’t naive and these sorts of thought experiments are usually things that have occurred to someone. Similarly, Andrew, cool it on the presentation of spectra diagrams – these are elementary issues that I’m well aware and are simply a diversion in this context.
In this case, the comment has a predictable result. We’ve found that visiting climate scientists always pick weak comments to dine out on and this case is no exception, as we see here with JEG, who picks this issue.
#118. JEG, you ask:
I’m only a one-eyed man here. I’ve seen engineering documents and they are different than Nature articles. I’m not saying that engineers are smarter than scientists, just that they do things differently. Scientists writing for Nature need to be original. Engineering studies often require ingenuity but they are not “original” in the same way. JEG, you’re at Georgia Tech. I’m sure that someone there knows what an engineering study looks like. Ask around.
122 Arthur
I don’t disagree with most of what you say, but, re:
,
the article said “almost instantaneously on a climatological scale” which I interpret as, say, within 800 years.
Neal J. King says:
#109, DocMartyn:
– The 3.7 W/m^2 is the imbalance between incoming solar radiation and outgoing radiation, and it is POWER, not ENERGY. The point is that an imbalance cannot go on forever, and so what happens is that there will be a build-up of energy due to the power imbalance. That will lead to a temperature increase in a way analogous to the temperature increase occurring when you put a pot on the stove, and the increase will continue up to the point that the outward radiation matches the incoming solar radiation. At that point, the imbalance will be 0 W/m^2.
– So the graph would have to be the imbalance vs. rate of temperature increase; or of C-O2 level vs. equilibrium temperature.
– What is that graph? I believe Gavin told me that, within the range that they had varied parameters, it was roughly linear.”
I thank you for the paragraph, I really like the analogy of the pot on the stove. As it happens I have a pot, a stove and some water. I place a thermometer in the water and put the heat on 5. After a while it comes to a STEADY STATE, the water is at 100 degrees. I repeat the experiment and this time I turn the stove to 10. The water comes to steady state and the water reachs a temperature of 100 degrees. So doubling the power does not change the steady state temperature.
Now on earth we have a half sine wave of energy input, 0,1,2,3,4,5,6,5,4,3,2,1,0,0,0,0,0, and back to the start. So we warm up water, convert it to gas and then, during the evening water vapor is converted to liquid and solid, emitting IR.
Now, what is the heat in the system over 24 hr’s. What is the average temperature?
Finally, this imbalance idea is pathetic, the Earth is a rotating body undergoing a perodic inputs of energy. During the course of 24hr’s there is a cycle, there is an energy input a one side of the cycle and not the other. The idea that you can “average” over a whole cycle and then apply equilibrium thermodynamics to the system is nonsense. You might as well measure the average pressure in the cylinder of a gasoline engine to calculate r.p.m. You might get some measure, but you sure as hell can’t model it.
re 116:
Of course it’s not derived, it’s a least squares fit model output.
5.35ln(C/C0) is an empirical formula.
120, thus the footnote.
Steve
I guess I’m guilty, but I think if you read it more carefully you will see that Julien was ‘feasting’ more on the engineering/science and humidity arguments, et al than on my ‘dumb question’, which was directed at getting more out of Dr. Annan’s email.
Why is mars colder than earth? Because the surface temperature responds to solar input.
try this:
http://home.casema.nl/errenwijlens/co2/sb.htm
I challenge you also to do a time/surface integral, using local irradiance:
download excel 2000 version
http://members.lycos.nl/ErrenWijlens/co2/insol.zip
based on the celestial mechanics formula:
horizon altitude = asin(sin(LAT) * sin(DEC) + cos(LAT)* cos(DEC) * cos(H))
here are some response curves for different arctic climate zones:
James gives this equation for the closed loop:
I dont think James is suggesting that this is a steady state gain. For example, there is no mention the final value theorem and Boris emphasises an active feedback mechanism as follows:
If the equation is accepted as a closed loop transer function, the negative sign in the denominator denotes positive feedback and the model is hopelessly unstable.
The first step transfers 1C to 2C (as James mentions). But the next step would transfer (1+0.5*2)C to 4C, then 6C and so on…
In practice something will eventually saturate. The system would resist change from that point.
In terms of the above model, it would be natural for f_1 to decay to zero with the onset of saturation. The relationship mentioned by Boris will no longer hold. Two possible causes could be water vapour saturation or closure of the LW bands.
Spencer Weart discusses something along these lines at http://www.realclimate.org/index.php/archives/2007/06/a-saturated-gassy-argument. Summing up near the end:
If I can paraphrase – to see the enhanced greenhouse effect, you need to look for the cold, thin and dry regions of the atmosphere which are not already closed to LW.
Cold, thin, dry regions. Does that mean regions with no water vapour? Does that mean f_1=0?
I’ve strongly suspected that, seeing as the terminology and concepts are out of elementary systems dynamics. But what does that have to do with what Steve is asking for in the way of a report?
Bender,
You say “The chaotic jointed pendulum is easily modeled, for example.”
I built one of those, and coded a model in MATLAB, in conjunction with my undergraduate physics senior project. While your statement is ostensibly true the dependence of the system on small changes in initial conditions makes predictions of position and velocity based on practical observations and measurement essentially impossible over any nontrivial time period.
θ1” = −g (2 m1 + m2) sin θ1 − m2 g sin(θ1 − 2 θ2) − 2 sin(θ1 − θ2) m2 (θ2’2 L2 + θ1’2 L1 cos(θ1 − θ2))
L1 (2 m1 + m2 − m2 cos(2 θ1 − 2 θ2))
θ2” = 2 sin(θ1 − θ2) (θ1’2 L1 (m1 + m2) + g(m1 + m2) cos θ1 + θ2’2 L2 m2 cos(θ1 − θ2))
L2 (2 m1 + m2 − m2 cos(2 θ1 − 2 θ2))
Now that is a physical system with only two coupled non-linear differential equations and it kicked my ass as far as trying to predict real world positions of the pendulums at a time only minutes in the future. The chaotic nature of the system gives VASTLY different results for EXTREMELY small perturbations from initial conditions.
Not to mention the friction in the bearings of the joints and mounting pivots which are not part of the model I made and would have made the system even more unwieldy to model.
That little exercise gave me a great deal of insight into, and trepidation about, the complexity of such models. I can only imagine the problems in trying to model something as complex as the planets climate system.
When I bring this up to people that claim to know about climate models, and have confidence in their results, they claim I am using the wrong paradigm. That it is just a matter of stochastic probability and not actually modeling the results of a nightmare inspiring set of linear and nonlinear, some coupled some not, equations and their ever so finicky and sensitive boundary conditions and associated constants and parameters.
I have not looked at the code of one of these beasts so I really dont know how they work, but to blithely dismiss the complexity of nonlinear chaotic systems is to whistle past a very scary graveyard.
#124, DocMartyn:
The problem with your pot boiling on the stove: Your pot is losing water, which is escaping to the atmosphere as vapor. This is not a steady state.
As long as you are adding power to the system, there is no steady state. There will be two phases:
1) Pot boils, temperature steady, but water evaporating.
2) Water gone, temperature rising.
OK, plus:
3) Pot loses structural integrity from overheating and falls off the flames.
What happens with the Earth and the radiative imbalance is like having that turned-on heat. During the daytime, on one side, it will be receiving radiation and radiating; during the nighttime, on the same side, it will not be receiving but it will still be radiating. In a balanced situation, these will even out, just like a bathtub that is being run while the plug is pulled (even if the tub is only being run half the time).
#125, Hans Erren:
I believe that the ln(C/Co) factor is derived, but the 5.35 is likely to be from parameter-fitting.
Does anyone have a link to an online copy of the IPCC’s first assessment report, the one from 1990? I’ve been told that the derivation of the 3deg C climate sensitivity value was discussed at length in the first report, hence no need to discuss it in subsequent reports.
IPCC’s web site says the 1990 report is available from Cambridge University Press, but I was unable to find it there.
Even though I’ve been reading your blog since its early start, I have never dared to try to take part in the VERY qualified diskussions.
But I am really pleased with the work you have done Steven, especially coming Denmark where I have seen how people like Svensmark and Lomborg has been treated in the climate discussions.
But at your question, I just went over a very old J. Hansen paper that could be the source of what Annan is explaining.
It has not been discussed on your blog so maybe you haven’t been over it.
I have only seen it as ‘C. Lorius et al., Nature 347, 139 (1990)’.
The title is:
Nature 347, 139-145 (13 September 1990) | doi:10.1038/347139a0
The ice-core record: climate sensitivity and future greenhouse warming
C. Lorius, J. Jouzel, D. Raynaud, J. Hansen & H. Le Treut
Its available from NASA as OCR pdf on
1990_Lorius_etal.pdf
#126, Jordan:
I think Weart’s point is the same as mine: all the action of the GHE is taking place at the upper atmosphere, where there is not much water vapor, and the barrier between the outgoing radiation and space is C-O2.
However, this does not mean that f_1 = 0 (although I was speculating about that earlier): As long as there is still SOME water vapor above the radiation-balance point (where the optical-depth = 1), adding water vapor will elevate the altitude of that point further, which will result in more GHE.
I guess that, only if there is so much C-O2 that the OD=1 point is at 10 km (where the water vapor quits) will there be no further feedback. But right now, it seems that the OD=1 point is at 3 km.
#131, Lance:
The modelers are very aware of the chaotic nature of the GCMs. Their results come from running them a whole bunch of times, to generate distributions.
They’re trying to model climate, not weather predictions.
Please excuse my lack of blog posting ability. The equations of motion should be ratios with the first line representing the numerator and the second representing the denominator in each expression.
Cutting and pasting failed me.
#135, Søren Søndergaard:
I think what they are looking for could be in the references to the paper you cite: Refs. 6 – 11.
Box 1 on page 139 seems to frame the relevant argument, but doesn’t explain the numbers other than by reference.
@75 As a research physicist, I would like to see the 3.7 watts/m^2 calculation before I accept it, or at least be able to see the assumptions on which it is based.
Perhaps here? Kiehl, Ramanathan, 1982 (Table 1)
Click to access i1520-0469-39-12-2923.pdf
@78 I cant find his 1975 paper online
This one? Ramanathan, 1975
Click to access i1520-0469-33-7-1330.pdf
121, Arthur: I linked to that article because I thought it was interesting, not to support it. However, to be fair, you should look at the references for documentation of the 90-95% contribution by HOH vapor. The RC article you linked also discusses one of those references (Lindzen). And as far as addressing feedback issues, please read the article more closely, as it claims that all these are subsumed in the analysis.
#140, RB:
Those papers look pretty relevant! It looks like it’s based on pretty hard-core radiative-transfer calculations.
#141, jae:
As I recall this paper, it’s based on the idea that a GHG blocks photons. It doesn’t: when the photons get absorbed, the atoms get excited, de-excited, and emit the photons again.
That’s why it becomes a radiative-transfer problem, as discussed in the papers RB cited.
135 139 Soren Neal
Thanks. Useful additions to my collection of the literature.
I’ve observed for some time that the Ramanathan papers from the 1970s are the closest that I’ve seen to an exposition of 4 wm-2. THey are instructive and well worth reading, but where do they stand in light of the subsequent 30 years of work?
140
Thanks, RB.
This argument is circular. It is true that if the surface warms, the entire temperature gradient shifts upward given a consistent lapse rate. Similarly, your assumption is that if the upper atmosphere warms the ground will warm as a consequence of consistent lapse rate. Please provide an exposition demonstrating why the lapse rate is an intrinsic property or how to bound the change such that your argument is reasonable.
This, I believe, is Steve’s point in mentioning that 3.7W/m^2 depends on the lapse rate, and why I disagree with you that there is nothing troubling to the argument here. The argument isn’t convincing without this point.
#144, SteveSadlov:
Give it a break. The whole calculation is only a back-of-the-envelope thingy anyway.
#145, Steve McIntyre:
Since the papers are (apparently) still cited, one has to assume that nobody has felt them wrong enough to correct.
Quick question Neal J. King, if the majority of CO2 GHE takes place at a height of 10 km (or 5 km) where there is little to no water vapour, how does that stored heat get transported back to the surface where it is warmer?
#147, Jon:
No, the adiabatic lapse rate is not something calculated within the GCM: It is calculated from thermodynamics.
For dry air, the calculation is often done in textbooks (like Fermi’s little book). Here you can find a summary: http://pds-atmospheres.nmsu.edu/education_and_outreach/encyclopedia/adiabatic_lapse_rate.htm
For moist air, more computation is needed, but the calculation is set up analytically. It depends on the thermodynamic properties of water.
No circularity entailed!
#151, me:
Actually, a better reference seems to be:
http://en.wikipedia.org/wiki/Lapse_rate#Dry_adiabatic_lapse_rate
Darn, that Wikipedia is getting good.
Re Smith 121, Keating 123, http://brneurosci.org/co2.html
Arthur: yeah, his ref list for H2O accounting for 90-95% of warming are not encouraging, eg one ref http://www.dailyutahchronicle.com/home/index.cfm?event=displayArticlePrinterFriendly&uStory_id=950e44aa-78bd-4fb8-b131-b272090659be
is to a Utah student newspaper, quoting a “International Association for Physical Science in the Ocean” whose only Web presence is that article 😉
But I can’t say I’m terribly comfortable using a RC article as the only substitute. Does some other auditor have a peer-reviewed ref for this?
FWIW, here’s Gavin Schmidt’s comment on Nelson’s article:
http://www.realclimate.org/index.php/archives/2005/12/one-year-on/
——————————————————–
Re
–from http://brneurosci.org/co2.html
I agree this is poorly-worded — WTH does “on a climatological scale” mean?
However, I went to a lecture recently by a respected geologist/climatologist (& AGW proponent) whose name escapes me. He’s the guy promoting CO2 sequestration in nearshore marine sediments. Anyway, ims he said the present “lump” of excess CO2 would come to equilibrium with the ocean in roughly a century.
T.J. Nelson, the author, appears to be a well-published biochemist and computer scientist
http://scholar.google.com/scholar?q=%22T.J.+Nelson%22&hl=en&lr=&btnG=Search
who works for the Image Measurement and Analysis Lab http://brneurosci.org/
— more to come, as time permits
Cheers — Pete Tillman
Neal J. King
My question #150 was not rhetorical, but in fact genuine. Sorry, was the response about lapse rate my answer?
RE: #144 – You’ve made my point. Annan has not given us an engineering analysis. Only a beery napkin scribble from an after work drinking session at the old “Wagon Wheel” over yonder on Middlefield Road. (Silicon Valley old timers will definitely understand that reference.) Of course, many a start up began that way, but trust me, those which never advanced beyond the stained napkin stage ended up failing to breaking even.
(#15) Stephen
Sorry but when I was putting my response together last night Steve closed the comments in the middle of it and I lost my text.
Bottom line is that none of the Watts/m2 measurements agree to within a few watts/m2. That is ACRIM, SOHO, ERBS, SORCE all have a systemic error. I don’t quite understand why as the calibration is quite good on the instruments but it is there none the less. I don’t buy 1370 watts/m2 or it would show up as a systematic increase in the output of solar panels used in space as it is almost 1% greater than the 1358 watts/m2 that we use in the space solar panel design world. It is quite easy to get the relative variability from solar panel output with the exception that the panels have to be in a LEO orbit where the radiation degradation per year is very slight.
I really don’t like seeing normalized data. I would really like to see the raw un-normalized TSI measurements. I bet there are some assumptions built into the equations that would explain at least a small part of the variation between the instruments.
Just pointing out again, that these theoretical calculations cannot be correct when one considers the empiricial geologic record of CO2 and methane levels in Earth’s history.
Was it really 12C warmer 150 million years ago? The periodic ice ages that Earth has gone through would be impossible considering the relatively higher CO2 levels of times past.
The average global temperature in the past 540 million years has varied by +7.0C to -5.0C from the current average while CO2 has varied by 4.5 doublings to 0.5 times that of today’s CO2 level.
http://www.globalwarmingart.com/wiki/Image:Phanerozoic_Carbon_Dioxide_png
#149, #153, Ian McLeod:
Sorry, Ian, but I had to think carefully about the question. As advertised, radiative transfer theory is not that simple, and I don’t find it intuitive. It seems a bit like hydrodynamics: things depend in funny ways on the end-conditions.
– The radiation balance is set, currently, at about 3 km. That means the interest is in the C-O2 & H2-O above 3 km, not above 10 km.
– There is no stored heat: One way to see what happens is that you impose the -18-deg C temperature as a kind of boundary condition at the balance point, and then drop the temperature at 9-deg C/km from there to the surface, to find the equilibrium warmer temperature. But this is just a way to see how the answer will turn out, this isn’t how the dynamics acts.
– To understand the dynamics, we have to do a thought experiment. (Sorry, Steve.) Start with our Earth in equilibrium, and then inject some C-O2. Because C-O2 gets well-mixed in nearly all the atmosphere, it gets into the upper atmosphere, and raises the OD=1 point by (say) 1 km. The local temperature at the new OD=1 point doesn’t change (to first order), but now it is the effective radiation temperature for that C-O2 frequency band, so that means that less IR is escaping the Earth than was before. But if less power is escaping from the top, that must also mean that less is escaping from just below the top, and so on downward. In fact, what is happening is that there is more radiation that is “bounced” down from the upper atmosphere, so the net radiative loss at every altitude is reduced. (There’s actually just as much radiation streaming upwards, but there’s more of it being bounced back downwards, by atmosphere that previously didn’t “count”, because it didn’t have a chance to catch the photons.)
So overall, the picture is not that “stored heat” comes down from the atmosphere to the surface, but rather that the rate of power escape from the surface slows down. (The origin of this power is solar radiation, that has been absorbed and converted to heat.)
This results in more local heating than local cooling (ground-level), causing the ground-level temperature to rise and lift the atmospheric temperature with it. When, due to the adiabatic lapse rate, the temperature at the OD=1 point has been raised to -18-deg C, equilibrium has been reached.
(Until the next dollop of C-O2 comes in!)
This explanation may seem a bit strange, but it’s not really weirder than the explanation of the Venturi effect in hydrodynamics.
#152, Peter Tillman:
– on the lump of C-O2: in 100 years, it goes into equilibrium with the surface of the ocean, but that doesn’t mean that it reduces to pre-industrial levels, because the ocean surface will also be carbonated. I believe it takes about 1000 years for the carbon to find its way into the deep ocean (via foraminafera), reducing the acidity of the surface ocean and the carbonation of the atmosphere.
– You might not like to depend on RealClimate’s analysis, but his criticism seems to be correct.
#154, SteveSadlov:
Nor did he promise anything rigorous. To quote him, Annan said: “The simple answer is that there is no direct calculation to accurately prove this, which is why it remains one of the most important open questions in climate science.”
It hardly seems fair to beat up on somebody for not providing something that he never promised to provide.
#157, John Lang:
These calculations do not take into account the generally credited causes for the ice-age cycles: Milankovitch cycles, continental drifts, etc.
These don’t seem to be doing much on the timescales of interest (~100 years).
158 Neal
I think your post is valuable, so I have a couple of questions:
1. What exactly do you mean by The radiation balance is set, currently, at about 3 km.? How do you define ‘balance’? What or who sets it at that altitude?
2. What do you mean by OD=1 point? What is OD?
Neal J. King, not to suggest that I have contributed more than you, but I don’t think anyone has given anything even close to what Steve wants.
[snip – Andrew – puhleeze]
As Arthur Smith #23 points out above the scientific understanding of all the processes involved in modeling global climate has not advanced to the level that would make an “engineering phase” providing a precise and accurate value feasible. All that is possible at this point is a prediction of a wide range of values that future temperature change will probably fall within. I’d be very surprised if Steve McIntyre is not well aware of this so it is not at all clear to me what he is trying to achieve with his oft repeated 2.5 deg C from double CO2 question. Here are some recent IPCC technical reports providing background material to the current predictions:-
http://ipcc-wg1.ucar.edu/wg1/wg1-report.html
Click to access AR4WG1_Print_TS.pdf
Click to access AR4WG1_Print_Ch08.pdf
Click to access AR4WG1_Print_Ch10.pdf
The key uncertainties like the role of clouds is mentioned in these reports so it is far from a propaganda exercise, in my opinion.
Neal J. King, he isn’t talking about the scale you think either, he’s talking about the scale of hundreds of millions of years, i.e. Phanerozoic climate. Milankovitch cycles do indeed cause ice ages, on the scale of hundreds of thousands of years. I haven’t seen the evidence for the role of continental drift on climate, so I can’t speak to it. But I have heard of the theory. The point is that it was as cold as it is now when CO2 levels were much higher. Presumably this is becuase the Sun was fainter, but it would actually have been to faint, hence the faint sun paradox. Something else must be at work.
re 152, 158, contrib of H2O to GHE
To answer my own question ,
Actually, Gavin already did [doh]. His model=derived chart agrees almost perfectly with Ramanathan and Coakley (1978), Rev. Geophys. & Space Sci. 16 (1978) 465 (and is so credited by Schmidt). Here’s the original R&C chart:
So Arthur & Gavin are correct: Nelson’s 90-95% H20 contribution figures are just plain wrong.
Cheers — Pete Tillman
[snip – Andrew, the issue is not whether your politics was civil or not, but the discussion of politics. There’s enough centrifugal force on these threads that I’m now just deleting these sorts of things to avoid foodfights as much as possible.]
#162, Pat Keating:
To some extent, I am making up my own terminology to explain these points. So some of it may seem awkward, perhaps even inconsistent. Hopefully all will be clear by the end:
Let’s look at one particular frequency in the IR. Due to all the gases in the atmosphere, wherever they may be, radiation at this frequency is absorbed; and after being absorbed, is re-emitted. There is an absorption coefficient that defines the likelihood of a photon being absorbed as it passes through the gas: it depends on frequency, gas density, gas composition, and (to some extent) temperature & pressure. If you integrate this absorption coefficient along a straight line, you get the so-called “optical depth”. The point of it is, roughly, that when the length of the path in this gas has optical depth = 1, the chance is only 1/e = 1/2.78 that the photon will make it through that path without being absorbed. If the path is only of OD = 0.1, it will probably make it through that path without being molested; if the OD is much greater than 1, it will certainly be absorbed.
(But this doesn’t mean that it’s “blocked”. Once the photon is absorbed, its “death” causes the excitation of an atom/molecule to a higher quantum state; when this state of excitation ends, another photon of the same energy/frequency is emitted, but likely in a different direction. Thus, the photon is “re-born”.)
What is of interest is the so-called photosphere: a sphere around a radiation source such that radius is at the OD=1 point, as measured from space inwards towards the center of the source. This means that a photon that is emitted from the surface of the photosphere, or above it, will almost certainly escape to outer space; whereas a photon that is emitted from within the photosphere is very likely to be re-absorbed by another atom/molecule.
Every frequency has its own photosphere, because every frequency is absorbed with varying degrees of eagerness by the gases (depending on the absorption coefficient). However, for the purpose of discussing the GHE, I will pretend that there is just one frequency (band) of interest (say the 15 micron band), and pretend that radiative equilibrium is maintained by a balance between incoming solar radiation and the outgoing IR radiation at 15 micron. In equilibrium, then, the sun’s radiant power = the radiant IR power. This is the equation that defines a thermal steady-state: anything else has to result in warming or cooling. So, I’m calling it a “balance”.
At the moment, the photosphere for 15 microns has radius at 3 km. This means that the temperature at the surface of the photosphere is the temperature appropriate to the altitude of 3 km, because of the adiabatic lapse rate.
So, to try to answer your questions as you asked them:
– The point at which outward radiated power must (in steady state) equal inward solar power is at the OD=1 point, which is currently at 3 km.
– Balance means thermal steady state: 0 net radiant energy flux.
– Assuming the frequency, it is determined as the point at which OD = 1, which is determined by how much C-O2 is in the atmosphere.
– Optical Depth (in this case) is the integral over distance of the absorption of the GHGs at the 15-micron band of IR; taken on a path from infinity towards the center of the Earth.
#164, Andrew:
Few have claimed that C-O2 is the only factor responsible for climate change – and none of climate scientists have.
The point has been that none of the non-human factors are changing on a timescale that can be relevant to the effects observable over the industrial period.
Re TJ Nelson, “Cold Facts on Global Warming”, http://brneurosci.org/co2.html
Since Nelson seems well-intentioned, and clearly has put considerable effort into his page, I’ve emailed him a summary of the criticisms here and at RC, and invited him to respond.
So we’ll see if he does…
Cheers — Pete T
Neal, although I do not want start a fight, the statement that there are no relevant non human factors presently isn’t even believed by the IPCC, which does in fact assign an amount of warming to varying solar activity, though not much, becuase the focus mainly on Total Solar Irradiance. Here’s a graph of the IPCC’s forcings:
And solar activity is included becuase it has changed.
You should have no problem with excepting this, as long as you can believe that the whole effect has been accounted for.
Andrew:
The problem is that there is an issue of timeliness. The documentation/explanation of the GCMs is certainly not as well-presented as one would like, because it’s been done in the context of science & investigation, not in the context of engineering: After all, what is it that one was wanting to build here? I have argued that there is no possibility of modeling the Earth to the degree desired to pin down the last decimal point.
So we are left with doing the best we can with the information available. It seems to me that the papers cited above by Ramanathan et al. go a long way to providing some insight. It would certainly be worthwhile for some expert to put together a full picture. But I don’t see the need to “stop the presses” until this is done.
Re my 165, wonky Ramanathan chart
–and here I had the darn thing looking just right in the preview!
Sigh. Is there a trick to columns? I was trying the Code commands.
TIA, PT
#170, Andrew:
I misspoke: I meant that there are no non-human factors that would be relevant with respect to replacing the human factors as dominating inputs for currently observed global warming.
Variations in solar and (especially) volcanic activity have clearly contributed to observable climate change, but cannot alone explain what is going on.
#173, me:
The graphs I find clearer:
http://www.grida.no/climate/ipcc_tar/wg1/figspm-4.htm
Sorry, I don’t know how to paste things in.
a) Shows only natural forcings: solar and volcanic
b) Shows only human forcings: GHGs and sulfate aerosols
c) Shows both together.
c) gives the best fit to AGT.
Re #122 :
JEG, youre at Georgia Tech. Im sure that someone there knows what an engineering study looks like. Ask around.
Neal J King has a good point that nowadays, the emphasis in science is in originality , not so much reproducibility – which engineering seems to make much more seriously. While I agree with your general complaint that our field would stand much taller if reproducibility was a core concern, I don’t really see what improvements come from asking climate science to abide by standards that you don’t even care to specify. To take up the challenge, one has to see the color of the gauntlet first.
Now, re #23 :
Steve: You say: Contrary to Steve Ms claim above, the climate models these days dont assume constant relative humidity I made no claim whatever about climate models. I discussed what Annan said. Why would you put words in my mouth?
Wel, sorry, but you do say :
and then go on to trash GCM users for making this shaky assumptions :
This, leaves, to this reader at least, the distinct impression that you are accusing all of IPCC climatology so stand on an unwieldy assumption without bothering to check it. Maybe it’s just me, but your post leaves the strange impression that you are dissatisfied with explanation of the 2.5 Deg climate sensitivity, so proceed to tear apart an explanation provided to you (seemingly graciously) by James Annan. I re-post what i had tried to say the first time :
An alternative explanation is that your ‘interpretation’ is simply erroneous. As Arthur Smith points out, GCMs do NOT assume constant Relative Humidity. My gut feeling is that James Annan only mentioned the assumption because it simplifies some semi-analytical estimates of climate sensitivity, which can be used as cross-checks for model results. (though i acknowledge the distinction is not crystal clear from his email). They do NOT enter GCM calculations where specific (hence relative) humidity is a predicted variable.
In a *second* step, he uses GCM results from presumably distinct GCM experiments to make the case, a posteriori that the constant H in a warming world is quite reasonable. (consistency check).
The REAL problem i see with this argument is that it is circular reasoning : it assumes that GCMs have the correct physics to predict changes in RH – whereas the crux of the matter, as you and J.Annan point out, is that cloud feedbacks could change things a great deal, and they affect temperature as well as relative humidity, so cannot be used independently.
But all in all, it seems you are conducting an unfair trial of Annan’s explanation here. He only purported to hint at some elements of the answer, after starting from the disclaimer that “it is an open question”. So why put him in front the firing squad for something he never claimed to do ?
That being said, it would be nice if the document you ask for existed and was widely accessible. That’s a great literature search project for a senior thesis or a first-year grad student…
#174, Andrew:
Despite plenty of proposals, no one has been able to give convincing evidence that other aspects of solar activity have anything to do with the industrial-age GW.
– Solar luminosity has changed very little in the last two solar cycles (satellite observations), and earlier studies show a very limited possible effect
– Explanations in terms of cosmic rays fail: despite the suggestiveness of experiments at CERN, the problem is that the cosmic-ray cycles don’t trend the way the GW does. How do you explain an effect with a non-cause?
– Etc.
No one is saying to stop thinking – but the fact that the explanation that has been studied for 100 years has not been documented as fully as we would like does not mean that we need to stop any remedial action and put all energy into finding alternative causes.
As even Richard Feynman, a great maverick in theoretical physics, stated in his Nobel Prize speech: “The likelihood is that the conventional view is right.”
Some define any FIR as a moving average
Neal, you have chosen by far the least robust of the critics of Shaviv, and don’t think I’m not aware of these things becuase I disagree with you. Just becuase you didn’t understand it doesn’t mean the reply was wrong. It just means it was more complex.
Nir said, when someone brought up this paper:
No one has done so becuase it is completely false that there is anything in it for them other than the shame of being a “denier” and looked down upon by your colleagues and having funding yanked and your work criticized by the folks over at realclimate.
#188 Boris
FIR = finite-duration impulse response
Thanks, Boris!
[snip – Pat, I don’t disagree, but I’m trying to discourage venting]
JEG, you say:
It’s pathetic that it doesn’t exist. Climate scientists should spend a little less time calling the public “stupid” a la Pierrehumbert and Tamino, and little more time looking in the mirror. And BTW IPCC AR4 is merely a literature review – just not a very good one, in that they overlook key aspects of the exposition for the public.
The problem with Annan’s email is that it is, as Steve Sadlov observed, simply scratching on the back of an envelope. I didn’t ask Annan (or anyone else) to explain the effect to me. I’m familiar with quite a bit of literature although I’ve not talked much about it. What I asked for (and perhaps you can answer) is a detailed step-by-step exposition of how doubled CO2 leads to 2.5-3 deg C. I’ve never expressed any view that this number is incorrectly calculated, only that I’ve been unable to identify an exposition that I could work through step by step, as I would be able to do for a feasibility study.
You criticize my interpretation of Annan’s statement that:
Both you and Arthur misconstrue my point. Annan used this assumption in his napkin and, in that context, I criticized this as arm-waving. I made no assertion on whether this assumption was used in GCMs other than what was justified by Annan’s statement. If GCMs use different assumptions, bully for them. All I said was that the topic would be a central topic in an engineering test, simply on the basis that it appears to be a critical assumption and therefore there is a need to examine how realist such assumptions are and how sensitive the models are to them. Again, I’m not asking anyone to explain this to me, I’m just asking for a reference to a self-contained up-to-date exposition on a topic that is said to be important.
Folks, I don’t want any foodfights overnight. If you’re not familiar with the literature, please avoid the temptation to pile on or ask for help on this thread. Do that over at Unthreaded.
JAE: you said
I thought that reproducibility was a core element of science, cf. Wikipedia (“Science” entry, section “Scientific Method”)
Neal J. King #157, & #167
Thanks for your explanation of how CO2 absorbs and emits photons in the atmosphere at a level that was both informative and persuasive.
Re # 25 Tom Vonk
Thank you for your help. I was just warming up to a series of math questions when the post closed, because too many of us armwaved.
We have a major problem with the global management and direction of science on this topic. In the corporate world of achievers, there is a Board whose very important functions include selection of managers and adherence to corporate governance. The outfit is only as good as its managers, who have to specify the questions they want answered. This seems not to have been done with IPCC & offspring. The managers appear not to have the innate ability to define problems needing answers, or to see poor numbers coming back from their workers and so question them.
So the situation is like the dog that chases cars. Even if it caught one, it could only bark.
The CO2 doubling question is simply another example of the managers failing to specify the problem to be solved. Its public acceptance is a measure of the failure of the Board to govern the dissemination of crude results. Governance has failed in an embarrassing way.
I have to say that my interest is shifting from the continuation of this poor science (which might beyond our ability to solve), to more productive ways to spend money.
Science is full of major unanswered questions that are fruitless to pursue. Example: There is evidence that the earth’s magnetic polarity reverses now and then. Questions: What causes this; what effect does it have on civilisation and nature in general? Problem: Even if we knew, we could do nothing about it. Bow wow, car.
#167 Neal J. King says:
The surface temperature of the earth varies greatly between daytime and nighttime. Does the temperature at the OD=1 point vary between daytime and nighttime theoretically? Is there any data of actual measurements at the OD=1 point to compare the theoretical temperature(s) with the measured temperature(s)?
P.S. My apologies for not referencing correctly before. Hopefully this time I have not erred.
Re my post @129:
My bad. These points are nonsense.
(Previously) #186, Pat Keating:
– Pressure-broadening: It has to be included, since this has to do with the absorption coefficient.
– A vital point is that the photons of interest have energy that is already in the range of the thermal energy of the molecules, as well as being (obviously) nestled among the line spectra: This is thermal radiation. So, I over-interpreted by saying that the photons would be the same frequency; it would be fairer to say that there is a local thermodynamic equilibrium, so the number of photons in a small band will be the same, determined by the local temperature.
– The point of OD=1 is that this is the point above which the mean free path (for PHOTONS) is long enough that the photon stands a good chance of getting away. Remember, the MFP for photons is inversely proportional to the absorption coefficient, it’s not determined solely by the average distance between molecules.
But if we get much further into these details, it will be difficult, because my text (Houghton’s book cited above) is thousands of miles away, and I haven’t had the same amount of time to play with radiative transfer theory as I’ve had with some other aspects of physics.
#178, Andrew:
When I read two sides of the story, I tend to favor the side that I can understand.
If you truly believe you understand what Shaviv was saying, feel free to explicate it.
#181, Steve McIntyre:
I agree that it would be very nice to have a very thorough explanation of the argument lain out. The closest thing I’ve seen is Pierrehumbert’s in-progress textbook (freely available by download, cited above): Even there, it is not 100% complete, because the entire book is about atmospheric physics and sets up lots of stuff besides the GHE.
Even in this textbook, lots of aspects are assumed (and that is how he is able to keep that section wieldy). Unfortunately, that means that when Pat Keating asks for clarification on something, I have to think very hard to justify an assumption or shortcut.
#183, rk:
To clarify my point:
– Engineers write something to explain: “This is how I want you to do this.”
– Scientists write something to explain: “This is what I found out.”
These goals need completely different attitudes and implementations. Only the equations are the same.
#185, Geoff Sherrington:
I do not believe that the IPCC acts in any way as a Board controlling climate-change research. They prepare a report every few years, summarizing the state of the science, and calling attention to certain important issues and outstanding problems. Then they see what comes out a few years later. They are not responsible for directing the efforts of thousands of climate scientists all over the world, who work for different countries / agencies / universities / companies.
It does not make sense to blame the IPCC for not being what it is not intended to be. It is also inappropriate to expect the scientific enterprise to operate like a corporation. The only time that I am aware of, when scientists operated in that way, they weren’t doing science: It was the Manhattan Project.
They did a great job. But it wasn’t science.
#187, Phil:
– Does the temperature at the OD=1 point change between daytime and nighttime: In principle, yes, because the temperature would be something like the increment due to the radial height multiplied by the adiabatic lapse rate, added to ground-level temperature.
– But it’s not necessary to take it so seriously: This is a method for thinking about doing a calculation to determine whether heat energy is building up on the planet or not. No one goes around trying to find the OD=1 point exactly, anymore than anyone worries about the exact height as a function of time of the water level in a tub which has some water pouring in while some is draining out: You just want to make sure that the rates are set so it won’t overflow.
re: 190.
Um, no. After writing literally thousands of pages of documentation over the past 20 years describing exactly what I found out, with details as to how I wanted others to do it, I pretty certain you’ve missed this boat.
Mark
Sure, those that don’t understand (or work with) filter theory.
Mark
#195, Mark T:
Feel free to give your own explanation of the differences in scientific papers vs. engineering documents.
I think I already pointed that out. It is, however, rather tiring to hear all the “scientists” try to explain what we “engineers” really do. We do research, we publish papers. Where do you think the concepts of system theory, control theory (feedback), component analysis (principal, minor, and independent) come from? Electrical engineering literature. We’re just as much “scientists” as the academians that call themselves scientists. The difference that I’ve been able to clearly identify is that the engineering disciplines usually require a demonstration of the underlying theory, i.e. proof of the science behind the idea.
Mark
STeve: This is absolutely not the distinction that I, for one, have in mind. I’m distinguishing between reports by practical engineers doing feasibility studies rather than academic engineers doing the same sort of work as other academics.
RE: #25,57 Tom Vonk, 38 Lady Gray are definitively correct, refer to chapter 4, “Thermal Physics”, Kittel & Kroemer, the application using the SB constant and Kirchoff equations to gases is invalid–they are for plane solids at constant temperature only. Gerlich and Tscheuschner thoroughly treat Steve’s query in a recent paper (some broken English encountered).
There is no simple route to establishing the GHG sensitivity, for that matter even the sign, it must be experimentally measured as Ian M. observed. Pat F. is also correct that Manabe is a classic in the departure of climate science from orthodox physics, e.g., as cited by Braslau, 1971, at research.ibm.org justifying GCM models re: the overlap of H20 and CO2 absorption spectra.
IMHO, there is no heuristic that climate science seems to get right.
Steve: G and T do not “thoroughly treat this query”.
JEG # 118 wrote :
And the droning goes on and on .
Please people if you want to comment on radiative issues , try to go back to the basics of thermodynamics .
The above is again the same misconception of what temperatures , equilibriums and black bodies are about and therefore is full of errors .
First if T_e is the average surface temperature and a the average surface albedo of a spherical body then it is NOT TRUE that :
(1-a) S/4 = s . T_e^4
Black body hypothesis has nothing to do with that , it is MATHEMATICALLY wrong .
The reason is that a non isothermal body does NOT radiate at its average temperature .
It is absurd to suppose in the same phrase that a body is :
– non isothermal
– in equilibrium
– a black body
Making such absurd and contradictory hypothesis has never made a “zeroth dimension model” , it creates only non sense .
The “model” could be saved by assuming the Earth isothermal with an albedo independent of coordinates .
Everybody will of course agree that the explaining quality of a model that would approximate a higly non isothermal body by an isothermal body is near zero .
Second , there is no reason that the global energy balance be written (1-a) S/4 = s .eps . T_e^4 .
Why the exponent 4 ? What is the law saying that a macroscopical non isothermal body radiates with an exponent 4 ?
There is no such law and it is certainly NOT Stefan Boltzman law (even not as an approximation) .
I could very well write (1-a) S/4 = s . T_e^4 + f(T(x,y,z) f being an ad hoc function of the temperature field .
Third as this equation is trivially wrong , it is not astounding that using it to calculate T_e
(that is supposed to be the AVERAGE surface temperature !) yields an obviously wrong value .
There is nothing reasonable that can be inferred from wrong equations and wrong use of natural laws .
Re#25,27 (Tom Vonk), 38 (Lady Gray), 198 (Gary Gulrud)
Tom Vonk:
You described the only correct way of application of SB equations, but I am afraid Lady Gray and Gary Gulrud are right: it is not directly applicable. Take a look at some satellite measurements of outgoing LW radiation, for example presented here:
http://www.ukweatherworld.co.uk/forum/forums/thread-view.asp?tid=16928&start=81
It is quite different from gray-body radiation pattern.
Interesting thing. If one fit gray-body radiation curve to as measured by satellites outgoing LW radiation at atmosphere radiative windows, it would be possible to estimate real radiative temperature of the surface.
In the post, Steve wrote:
I’m wondering just how many IPCC officials still think what Isaac Held thought. IPCC reports clearly indicate that the net effect of clouds is still unknown — so give them credit for a frank admission on this point. Yet, they seem to operate from the premise that the current ensemble of models has the climate bracketed, allowing them to express confidence that temperature changes will fall within the range predicted by the models. These are smart people, so it is difficult to believe that they wouldn’t see the inconsistency in such a position.
Of course, it’s also hard to believe that they are unaware of how the models treat clouds. It’s puzzling to me.
Re #105 –
Neal J. King says: January 3rd, 2008 at 3:32 pm
Has this been shown to be the case? 3km is only 3000 metres – there are plenty of places on land at this altitude, I wouldn’t have expected it to be that difficult to test this.
#199 Mark T. I’m sure Pat F. and Ian M. will concur, there isn’t a lot for one to contribute to the study of climate without minors in Physics and Math.
#105 Neal King
1 Does the altitude at which a photon has a 50% shot at escaping into space without being absorbed by another molecule, increase or decrease in proportion to the amount of heat stored in the atmosphere, and therefor the density of the atmosphere? At a given height, will there be more or fewer molecules in the way of the Photon in a hotter atmosphere?
2 If all the heat transfer mechanisms (apart from radiation) balance out, then doesn’t that just leave Photon radiation balance. That is the average time delay between a Photon entering the atmosphere, and leaving? And isn’t that time delay a function of the density, volume, and chemistry of the atmosphere.
3 Wouldn’t a practical way of testing the absorbance of Photons in the atmosphere be to point a laser skywards, and measure the spectra of what leaves the atmosphere. And to compare tests with a laser starting from the earths surface, through different mixes of gasses.
4 It seems obvious that someone will have already done that analysis, although they may have had good reason not to publish.
188 Neal
– Yes, I agree it needs to be included. My question was: is it included in calculating the 3km? (Perhaps this is where you are missing the Houghton book)
How good is that number? It seems rather low — I would have expected something between 5 and 10km, tho’ that’s only a guess.
– OK, I see we agree on the photon emission issue.
– Yes, I think that is fine. As you say, not only is the MFP relative to collisions with say N2 molecules increasing with altitude, but the probability of absorption by a GHG is falling too.
191
I think there is another large difference between working engineers and research scientists.
Because engineers are building something that has to work, they are much more conservative regarding new, and therefore unconventional, technical ideas. If it isn’t in the text-books, it shouldn’t be used (quite rightly).
To research scientists, on the other hand, new and unconventional ideas form their primary goal. If it IS in the text book, it’s old hat and uninteresting.
The clash we see here is due, I think, to the fact that folks like Gore and Hansen want to use half- or 3/4-baked research results to do major social and economic engineering. But for that, the two communities would have let each do its own thing, without controversy.
Re #167
My post from last night appears to have been lost so I’ll try again:
In fact the photon isnt re-born it is collisionally thermalized with the rest of the atmosphere in the lower atmosphere.
What data are you using in that integration? My interpretation of the satellite observations would put the OD=1 for the CO2 15 micron band at rather more than 3km.
207, I think you’re right, although it’s got less to do with what’s in textbooks than it does with what’s been started up and run in the past. Nobody wants to use the bleeding edge of technology when the leading edge will do. There’s a certain pragmatism in that, although it does make it slow for new good ideas to catch on. that, in addition to the fact that if you try something new, you have a huge training and documentation task that you wouldn’t otherwise have.
But that’s not the issue here. An “engineering” report as Steve refers to has nothing to do with leading edge v.s. bleeding edge. It has to do with exposition. It has to do with laying everything out, and not leaving any stones unturned. It has more to do with producing a document that is so thorough, that a “summary for policy makers” is unnecessary, because the document can be used by policy makers.
My theory as to why this occurs so frequently is that many of these people have never been inside a meteorology classroom. I not contending that a basic meteorology education a panacea. But, it is helpful in understanding many of these concepts and the strengths and weaknesses of weather and climate modeling.
In general, I find that operational meteorologists are much more skeptical of AGW in general and GCM’s in particular than other scientists.
That doesn’t show that the lapse rate will be consistent in your counterfactual. This is how we get to relying on the constant relative humidity assumption or variation thereof–which in turn assumes something about the lapse rate. Also I haven’t begun to discuss GCMs. My concern here is with the 1-d radiative-convective model baseline. So please avoid them if possible.
But I think we’re sidetracked here. I’m not arguing whether the argument is correct or possible. I’m arguing that it cannot be made in two paragraphs.
Re #181
Well, maybe i’m just dumb, but even in this reformulated statement, you seem to imply that models are sensitive to an assumption that they do not make, hence my misunderstanding and misconstruing. Perhaps we’re talking about different kinds of models, then.
GCMs don’t assume constant RH. Some “napkin models” do. Your demand is fair for the second case, irrelevant to the first.
Is that where i misunderstood you ?
Somehow i get a general sense from some previous posts that Pierrehumbert’s textbook won’t be a satisfying reference to you…
Re #190
One is hard pressed to find textbooks devoid of assumptions – but one can’t reinvent the entire Wheel of physics in each one. The problem might be that some people are quite happy with accepting results of early XXth century physics on thermal radiation (as most climate scientists do), while others feel they need to be rehashed extensively so that they can be “audited”.
From many posts i get a sense of distrust that climate scientists do not have the basic physics right, and i wonder what should be done to change that impression. They are quite a few theoretical and quantum physicists in our field and i don’t think they need the lectures they are sometimes given here . But maybe we do need engineering guidelines…
” …a detailed step-by-step exposition of how doubled CO2 leads to 2.5-3 deg C. …Ive been unable to identify an exposition that I could work through step by step…”
I don’t think such a thing exists Steve, it’s just a range that seems okay from models, guesses, and experiments it looks like.
Any positive forcing (looking at the global mean radiative forcing graph Andrew put up that I’ve linked to a version of before) due to the AGHGs CO2, CH4 and N2O is probably more than covered by pollutants and such (except for the halocarbons and tropospheric ozone); stratospheric ozone, sulphates, organic carbon, biomass, mineral dust, aerosol indirect and land-use albedo. Two of those are so very low in scientfic understanding, there is only a range given!
So it seems there is not an answer to what would happen if any of those were doubled (or halved even) on their own. Think if all the ranges were at their highest versus all the ranges at their lowest; what happens? -2! 🙂
212,
You’ve just made Steve’s case for an “engineering” style report. Instead of an incoherent plethora of papers (which is what the IPCC reports are), something comprehensively written from the ground up is called for. That way we’re not arguing that Bumfork and Snotfish (2003) said “A” and Fiddlestick and Belcher (1997) said “B”.
Theoretical and quantum physicists do not expect society to buy into a massive social engineering experiment because of predictions made by their theories. Engineering and medicine have high standards for proof because the people who practice these disciplines are accountable if their mistakes cost lives or money.
Climate scientists should recognize that if they want their theories to be used by the wider society then they will have to live up to higher standards than they have in the past. Meeting those higher standards requires independent audits, detailed expositions and a what if analyses that tries to take into account factors which are ‘unknown’ (i.e. what if there is some currently unknown forcing linked to solar activity or cosmic rays).
In my opinion, these requirements are reasonable and should not be dismissed because ‘that’s not the way theoretical science was done in the past’.
#203, Jeremy Ayrton:
I should be more careful: I took the 3-km value from a statement someone else made above, invoking some authority or other. On my own knowledge, I cannot be sure what the value actually is; I am using it as a concept to explain the GHE. It’s actual value is of interest, because if it is above the 10-km value, that would suggest a reduction of the water-vapor positive feedback.
However, it doesn’t add a lot of value to measure it directly because:
– The balance is defined as a time-average balance, so it doesn’t look like anything exciting is happening at that point at any one time; and
– The actual balance is not attained until the ground-level temperature has rise up to the point that the entire atmosphere’s temperature has moved up a notch, and THEN the radiative balance is reached. Before then, there is a deficit of outgoing radiation.
In principle, the way to find it is to take measurements of the absorption coefficient, averaged over angle, as a function of frequency at altitudes from deep space to ground level, and integrate inwards from infinity. When you reach the value 1, there you are.
Re
Someone posted the reason for this recently, I think Judith Curry (apologies if I’ve misremembered).
The gist of it was that for some time the cloud parameterisations in the various models gave a distribution of feedbacks, both negative and positive. As the cloud models have included more detailed microphysics to everyone’s surprise the feedbacks all shifted to be positive.
Note that this is not an input to the models but a result, my impression is that the particular aspect of the microphysics that caused this shift is not known. So I think it’s not that they are ‘unaware of how the models treat clouds’ but they don’t know why that leads (apparently) to a uniformly positive feedback.
#212 JEG
You don’t seem to *get it* regarding the engineering report. Climate scientists want to have it both ways. They want to respond to Steve’s request by saying “well there is a lot of uncertainty” and “We really dont know from first principles which effect is likely to dominate” (from Annan’s E-mail) but then they create the impression, in the mind of the public and the mind of the politician, that this effect is known with engineering-type accuracy. Witness Angela Merkel and Tony Blair during an EU meeting on climate, neogtiating how many degrees their plan would lower temperature. For better or worse (worse, I would say) most people think that climate scientists can predict the global temperature to within a fraction of a degree based on the level of CO2. So, if no definitive analysis exists, they (including you I presume) should stop creating that impression.
An engineering document is relevant here not because it is written by engineers or because it uses some sort of gnostic analyses or esoteric mathematics, but because it is done carefully, with each assumption stated clearly and defended by reference and calculation, and all uncertainties stated and quantified where possible. In fact, the contents of such a report might be quite pedestrian and would win no prizes, but it would be something you might be willing to risk money and lives on.
Compare this with Mike Mann’s papers where he continues to list mixed-up and mis-identified columns of data and nobody, including him, seems to care.
218,
The SPM is quite explicit. It’s 90+% certain that all questions are answered in the catastrophic direction. What’s less clear is how much this represents the consensus of climate scientists and how much this represents the work of others.
#205, MarkR:
1) If the atmosphere is generally hotter, all distances (including the OD=1 point) will move radially out, and the density will decrease. The molecule density will be generally lower. The total internal energy of the gas will be higher.
2) Photons have different energy: the average photon received from the sun is much higher energy than the average radiated from the earth. The contents of the earth convert solar photons to IR photons by absorbing them, becoming warm, and radiating; and by doing biological stuff; but more IR photons are produced than solar photons coming in, because they’re lower energy. When the IR photons are emitted, their average time to escape is affected by the structure of the atmosphere, which includes the temperature & density distribution and composition. Something to note is that the IR photons are not “rushing to get out”: they are more “random-walking” out. (That’s why I object to the idea of “blocking” photons, which implies that they stop and don’t keep moving.)
3) You don’t need a laser to do this, and it would be highly restrictive. You can do measurements above the atmosphere (space probes), high-up in the atmosphere (satellites & balloons) and ground-level: just look at the sun’s spectrum from these points. But to get multiple measurements at different altitudes is going to be lots of work, won’t it?
4) You are too suspicious. Lab measurements of spectral absorption have been done for over 100 years, and spectral measurements were the starting point for the development of quantum mechanics. There are measurements from ground-level and balloons for sure (I just checked google), so I think the issue is purely practical. How do you do a whole bunch of measurements at different altitudes?
#206, Pat Keating:
As remarked in #216, I should be careful about the 3-km number: I was just taking that from someone else in the thread.
It would be of interest if the number were above the 10-km altitude, because then it would be above all the water vapor, and then water vapor would be irrelevant to the 15-micron band’s contribution to GHE.
RE: #205 – It is a critical and important point. In modeling future climate (setting aside for now any arguments regarding the degree to which GHGs warm the troposphere) the assumption is made that the tropopause heights, on average, experienced at a given latitude, will rise over time. There is debate even within the modeling orthodoxy regarding whether the stratosphere will simply become shallower, or, will also have its outer boundary increased. This alludes to the boundary value problem aspects of this.
Neal J. King – Re #216
It is me that should be more careful; as soon as I posted the comment, I realised I was being stupid, so thanks for not pointing that out!
It seems to me that this whole debate revolves around the Earht’s radiation budget. I know CERES is being used to measure this, but the measurements are taken at different points on the Earth’s surface and at different times. The budget for the entire globe at any moment has to be inferred. In addition, AFAIK, we don’t know the total amount of energy making it through the atmosphere to the Earth’s surface at any moment either. So, supposing one asked what is the Earth’s radiation budget at 12.00 GMT, 4th January 2008; one wouldn’t be able to answer this?
Wouldn’t it be possible to measure the radiation striking the surface, the radiation being radiated by the surface, and by combining this with CERES measurements for the same location and time derive some useful data? Repeating at will, to bring differing amount of cloud etc. What do you think?
#207, Pat Keating:
I agree with you on the distinction between engineering and science: The purpose of engineering is to get something specific done. The purpose of science is to find out new stuff.
I don’t agree with you on how that affects the GHE question. There are two tasks:
– Determine the extent of the problem/threat, if any.
– Decide what to do about it, if anything.
The first is a scientific problem; the second is a policy problem. They should be handled separately, and the discussion about the second issue should not be allowed to affect dispassionate analysis on the first.
It bothers me when people raise issues about social engineering or taxes when we are talking about the science. I am afraid that, with some of those who doubt the plausibility of AGW, there is the hidden attitude, “The problem cannot be lung cancer, because my health insurance will only cover pneumonia.” Let’s not go there: If we’re talking about the science, let’s talk about the science. We should decide what we are, or are not, going to do, based on our best knowledge about what is actually going on.
#208, Phil:
I think I have responded to those points while responding to others, just a little above.
In particular, I was taking someone else’s word on the OD=1 point. Do you have references? I would like to know.
Re 198, 199, G&T
This unpublished (for good reason) manuscript http://arxiv.org/pdf/0707.1161 has been discussed here before. The consensus being that’s it’s a worthless mass of crackpottery, as might be guessed from their 20-page (!!) refutation of, eg the Encyclo. Brittanica’s defn of the GHE. I mean, they may have a point, but who cares?
Best, PT
#211, Jon:
The open parameter for the adiabatic lapse rate is humidity; but there is still a limited range of values.
If you want to take variations in humidity due to atmospheric processes into account, that’s fine; but then you are stuck with models (which are just calculations, after all). Don’t tell me you need to get to the airport but don’t want to leave the room.
#209, Larry:
No matter how clear it is technically, policy-makers are not going to want to be dragged through the technical reasoning. You can call it a SfPM or an executive overview, but any technical report with policy implications will need one.
#214, Larry:
The problem is, Who will write such an authoritative comprehensive report? Whom do you trust to have the last word?
– Jim Hansen?
– Lindzen?
– Idsos?
Now do you see why the IPCC is a committee?
#222, SteveSadlov:
– I agree that the tropospheric temperatures should rise over time, according to this analysis.
– I also recall hearing that stratospheric temperatures should fall – at least initially. But I don’t see why; maybe there is some kind of second-order effect.
229, The UN should contract with a major international environmental consulting firm, such as CH2H Hill. They don’t bring much in the way of scientific knowledge to the table, but they what they do bring to the table is:
1. Experience in preparing such reports, and project managers who are used to organizing such efforts.
2. A reputation to protect, along with corporate liability, and the professional liability that the engineer of record and any who stamp the report incur. The beauty of the private sector is that they can be sued.
This would be somewhat analogous to the way General Groves from the Army Corp of Engineers participated in the selection of Oppenheimer for the Manhattan project. Oppenheimer stuck to the technical matters, and let Groves handle logistics. Things generally work better by that formulation than when a committee is given responsibility.
#223, Jeremy Ayrton:
I’m sure this is done. But it doesn’t help with the main question: How do the variety and range of clouds affect the situation, and how will that change in future, with additional warming?
Re #230
OT, but I’ll be brief, and no reply neccessary!
In the UK at least, the Public Sector can be also. And is. All too often.
231, In the US, they can be, too. However the UN can’t. That was the issue I was alluding to.
#213, Larry:
#214, Raven:
The issue that you are both addressing has to do with science that has policy implications. You want a more authoritative, clearer review and presentation of the science, so that it can be used to make good policy decisions.
This is quite reasonable. But, don’t you see that what you are asking for is essentially an enhanced & empowered IPCC?
In order for a document to be clear & organized, it needs to have a consistent point of view.
In order for a document to be authoritative, there has to be an authority. So, who will that authority be?
– Jim Hansen, who is gung-ho on AGW?
– Bill Gray, who doesn’t seem to believe in computers?
– Your_Name_Here?
Given these choices, I think I’d settle for a committee. The IPCC, for all the complaints about it, does take comments, log them, and find resolutions to them. It does have to consider the work done by the entire group of climate scientists. It has to seek a consensus among participants.
Remember the fable about the frogs who wanted a king.
I realize that (I was specifically responding to Neal’s common misconception of what an “engineering study” entails, btw, which can vary from purely academic to full report). Keep in mind, I AM a practical engineer doing, among other things, feasibility studies similar to what you suggest (my boss is a registered PE, as well, and he actually uses it). I also do academic work, and research and development work, and my typical customer is much more critical of the work I do than Nature or Science will ever be of any of their articles.
Personally, I think the type of engineering treatment that’s being discussed (i.e. a full “engineering study”) will be hard to find w.r.t just about any scientific/research endeavor. Textbook treatments, or even a well reviewed thesis/dissertation is more appropriate, however, which you’ve noted are absent as well.
Mark
Re #222
The satellite to do this has been built and was scheduled to be launched 4 years ago, however it was decided that this wasn’t a NASA priority and the project (& satellite) has been mothballed!
Given quote deletion it is hard to assess what you are referring to, buuuut, I disagree, unless you said this with tongue firmly planted in cheek? At the very least, most R&D type engineers such as myself are really statistics and math majors in disguise. I personally do my best to avoid electricity (though static seems to love me) in spite of a few degrees that claim I’m an electrical engineer. 🙂 Signal processing, system theory and control theory experts are a few examples of the types of folks that I think can greatly benefit the world of climate science.
Mark
Let’s overlook for a moment all the nitty-gritty details about emittance, absorptance, reflectance, transmittance, and all other factors associated with actual radiative transport of energy. This is in the sprit of the simple equation that expresses a radiative-equilibrium balance and has been the subject of the post and comments. That balance assumes that no atmosphere is present and most certainly assumes that there is no interaction between the radiative energy and the media on and surrounding the radiating surface.
There is a corresponding simple balance for an atmosphere that contains a “greenhouse” gas. One example is in Section 1.11 on Page 16 of this file. It can also be found in various textbooks.
That analysis gives the “surface” temperature to be about 1.19 ( i. e. (2)^1/4 ) times the temperature Te given by the analysis discussed in this post. Arithmetic gives the temperature to be about 303 K. This number is greater than the experimentally observed value of 288 K. The corresponding equilibrium-radiative-balance sensitivity can also be calculated easily.
I find this to be interesting. The simple radiative-equilibrium balance in the absence of an atmosphere gives a value “too low” so the immediate response is to attribute the difference to the “Greenhouse effect” of an atmosphere, and then beyond that to invoke CO2 as a primary player. If the original simple analysis had included a zeroth-order atmosphere, a situation that is much nearer the actual real-world problem of interest, and a value “too high” was calculated to what would one attribute the difference?
The no-atmosphere approach is so crude, and so clearly incorrect, it amazes me that it continues to be a starting point for so many discussions. If as an engineer I took such a first-look cut that was so clearly incorrect and exclusive of any of the known physical phenomena and processes of interest, I would be laughed out of the room by my peers whenever such discussions would take place. “Go back to the drawing board” would be the kindest phrase to describe such an analysis.
In addition to the extreme lack of fidelity relative to the phenomena and processes that make the surface of the planet non-equilibrium, non-isothermal, and non-stationary, the radiative-equilibrium approach ignores the interaction between the radiative energy transport and the media through which it is being transported. I still don’t know the real-world physical location of these surfaces for which the radiative-equilibrium temperatures are calculated. In particular how are these surfaces related, if at all, to the physical surface of the planet. The temperature down here on the surface is determined primarily by the thermodynamic and hydrodynamic processes induced by the energy addition to the materials that make up the atmosphere and the surface and interact with the radiative energy additions.
I’m not at all sure how all this fits with the IPCC usage of forcing/ imbalance “relative to 1750”. These simple radiative-equilibrium balances all apply at specific times at which equilibrium is attained and maintained. For the Earth, such a state is very likely not to ever be present.
All corrections will be appreciated.
JEG you say:
There are a couple of separate issues here.
I reject the idea that the Wahl and Ammann reply has re-habilitated the Mann HS and the seeming failure of interested climate scientists to understand why Wahl and Ammann fail doesn’t give me any confidence in their judgement. People (reasonably) criticize me for not publishing more journal articles, but it shouldn’t have to be up to me to explain this to the professional community.
ONe also sees examples of sharp practice, such as the Briffa truncation of of adverse post-1960 data, and, worse, the unconscionable IPCC acquiescence in this. This sort of thing erodes trust.
One also sees the continuing obstruction in respect to data (Thompson) and IPCC acquiescence in this. This is pointless. In Susan Solomon’s shoes, I would have read the riot act to climate scientists contributing to WG1.
Many readers here are familiar with the HS matter and probably most of them think that I’m correct on proxy disputes and on data issues.
This does not mean that the physicists are wrong – only that readers here don’t necessarily accept everything at face value. Someone quoted Feynmann recently that the conventional views were usually right; I agree with that. But I’ve been surprised before – I was surprised by the Mann situation for example. It doesn’t do any harm to work through things in detail.
The other leg is that most people in the real world are used to oversight, bosses, auditors, engineers. Things get checked all the time even if you trust the people. By comparison, the academic world is pretty unstructured and academics all too often equate routine checking to imputations of dishonesty. Given policy implications, academics in this field should adopt the most open possible policies.
234,
You need to see an example. A good engineering doesn’t have a “point of view”. It has a structure, and it has objectives, and it does reach conclusions and recommendations. But there’s no allergy to qualification of conclusions. There are no sweeping, bombastic claims that can’t be supported by the material.
220 Neal
That’s a pity, but I suspect that it is at different altitudes for different parts of the globe.
I think there may be another approach to it, using the IR spectral data from satellite measurements. Three graphs posted by Hans Erren at http://www.ukweatherworld.co.uk/forum/forums/thread-view.asp?tid=16928&start=81
suggest that the surface may lie at around the 315K level over the Sahara, 280K over the Med, and 200K over Antarctica.
If those numbers are valid, it may indeed be as low as 3km.
235,
That was my initial gut reaction (see comment #1), but upon further reflection, the fact that it’s a difficult fit means that the weaknesses will be exposed by the process. This is precisely what we want.
Re #230 – Neal J. King says: January 4th, 2008 at 12:30 pm
If that is the case (and I’m not in a position to dispute this) then the next questions would be why was it done, and what conclusions were then drawn. Any ideas out there?
BTW, just call me Jeremy – no need for formality.
I’ve read James Annan and Gavin Schmidt both tell us now that relative humidity is assumed constant in their models. Both of them are climate modelers. I’ve now come across a NASA study:
http://www.nasa.gov/centers/goddard/news/topstory/2004/0315humidity.html
by Ken Minschwaner and Andrew Dessler (no less) that says:
“In most computer models relative humidity tends to remain fixed at current levels. Models that include water vapor feedback with constant relative humidity predict the Earth’s surface will warm nearly twice as much over the next 100 years as models that contain no water vapor feedback.”
Clearly the models with this constant humidity assumption are the ones which predict catastrophic warming. Other models exist that don’t have this assumption but they of course don’t show catastrophic warming.
My questions to JEG are:
a) Should we perhaps assume that climate modelers know about their own climate models?
b) Are you just content to talk about models you like rather than the ones the IPCC rely on? Because I don’t think any of us dispute those non-catastrophic scenarios. JohnV was good at this particular red herring too.
Incidentally the report above contained the following:
“Their work (Minschwaner and Dessler) verified water vapor is increasing in the atmosphere as the surface warms. They found the increases in water vapor were not as high as many climate-forecasting computer models have assumed. “Our study confirms the existence of a positive water vapor feedback in the atmosphere, but it may be weaker than we expected,” Minschwaner said.”
What Steve is looking for doesn’t exist and won’t exist until the models actually agree with observations (which is exactly what engineers would insist on). I have no doubt though that sometime soon all models will be changed to reduce their dependency on H2O feedback because the evidence against it is accumulating. The 2.5C figure is now clearly an overestimate and Schwartz and Lindzen are likely closer to the truth.
Steve: I have no view on whether 2.5 deg C is an over-estimate or under-estimate.
snip -politics
Neal J. King says:
The IPCC, in theory, could have filled this role. However, it has failed to so effectively because it lets itself get side tracked by conflicts of interest.
The two big conflicts are:
1) The IPCC exists to show that humans are causing climate change. Any science that does not show that is automatically excluded as ‘uninteresting’.
2) The lead authors of the IPCC reports are allowed to highlight their own research.
Ross McKitrick suggested an adversarial model. The IPCC has made the case for the ‘prosecution’. So now we need a different group of experts who cross examine the evidence and make the case for the ‘defence’.
The policies makers would be the jury that weighs both arguements and make decisions as required.
Re #221 King
At the Institute of Physics in June 07 Richard Lindzen stated that an important altitude was tau=1 at 8km. If tau is the same as your optical depth then that 8km seems to be the figure you want, at least according to Lindzen.
He also noted that there isn’t enough warming at that altitude, compared with ground.
Rich.
241, Pat Keating:
I am not familiar with using that site. Which graphs are you indicating there?
The exact value as a function of angle is not, I think, terribly significant; unless it gets above the water-vapor level.
Neal, Jeremy: It would be nice to have measuring devices tracking energy levels. Then that could be used with and balanced against the mean anomaly trend. You can’t know what X% more CO2 does unless you can monitor what everything involved does and how they contribute. (I think the anomaly would be helpful to gather parts of and confirm other parts of the answer, but I don’t think it can give the answer, not alone; all things involved with gathering the anomaly considered — how do we know the process just doesn’t give us some number that we assume means something?)
Measurements of energy in/out would help answer the question that all else flows from in the first place: What does the global mean temperature anomaly tell us about reality?
Then if the +.064C trend/decade since ~1880 is in reality an equivalent rise in temperature rather than something else higher or lower, energy levels and anomaly could be balanced against each other, and perhaps lead to a better explanation of what exactly is causing it how, as computational power and the accuracy of the models increase as more is learned.
A positive feedback loop!
Thinking about one of the components before we know what the system itself is doing exactly is a bit premature.
#246, Raven:
You want policy-makers (= politicians) to decide which panel of scientists to believe?
Be serious.
Re #244
I would urge you to read more carefully: In most computer models relative humidity tends to remain fixed at current levels” is not the same as “constant humidity assumption”.
#238, Dan Hughes:
I think you’re beating a dead horse.
The problem is that it’s quite difficult to come up with a succinct calculation that gathers the factors of significance. This calculation is in the spirit of a back-of-the-envelope calculation, intended to capture some of the more important factors.
As you may have noticed, I have carried on a theme describing a more sophisticated approach to the GHE phenomenon. It’s a bit complicated, and there are a lot of conceptual things that need to be clarified from time to time, when someone asks a question on an unclear (or wrong) point. Of course, a good part of the reason for this is that I haven’t taken the time to prepare a good presentation. But another good part of the reason is that it’s complicated.
If you can come up with a presentation better than the standard sketch and easier to follow than the model I’m trying to explain, I’m sure it would be welcomed. Until then, I’m puzzled by the degree of vituperation.
I was with you up to that point. The problem is that policy makers are also interested parties. To continue your model, they really do need a jury of disinterested people, not professionals with an oar in the water.
If you start with a thesis/dissertation/textbook model, getting to what we want should be fairly straightforward… at least, I hope so. 🙂
Mark
Neal J. King says:
That is their job. They are the ones responsible for passing the laws required to implement any policy changes.
The IPCC’s own actions that are well documented on this blog demonstrate that the IPCC cannot be trusted as an unbiased arbitrator of science. I suspect that any different panel set up would also have some sort of bias (for or against). That is why the adversarial approach sounds good to me.
248 Neal
Use the link, then scroll down the page a little until you come to a post (by CoolHans) that has a lot of white space. Scroll to the right and you will see the image I’m talking about.
#247, See – owe to Rich:
You could be right: tau might be a term they use.
wrt the warming of the troposphere generally (what happens exactly at that point is not of much moment), apparently it’s sensitive to the issue of humidity. If a larger amount of water is evaporated, it will slow down the warming process.
246 250
Something like this happened in England, in Court, as you might recall. Both sides got to present their evidence in the time-honored adversarial manner and a judge made the determination on what caveats should be included when the Gore movie is presented to Btitish children.
Here is a link to what Ross actually suggested: http://www.uoguelph.ca/~rmckitri/research/McKitrick-hockeystick.pdf
I am probably over-simplying things with the prosecutor/defense analogy.
247 Rich
Do you have a link to that statement by Lindzen?
251 Phil
That is quite true. However, if the model is set up (directly or indirectly) so as to get that result, then the difference is more semantic than real.
No, you don’t understand the sentence (which is not very clear maybe)
1) In ALL the GCMs the relative humidity and the specific humidity are variables and can evolve in the future climate.
2) However, in most GCMs, at the global scale and in annual mean we notice that the relative humidity remains nearly constant in the future climate (but it is not true at the regional scale: some strong changes of the relative humidity are simulated, positive or negative)
3) As the relative humidity remains constant, the specific humidity increases at a rate of around 6-7%/K (result of the Clausius-Clapeyron relation).
4) The associated water vapor feedback is strong and if it does not exist (i.e. for example if the water vapor was not a greenhouse gas), the increase of temperature would be divided by around 2.
Phil. in 216 wrote:
Understood, but it seems to me that that only makes the IPCC’s position even less tenable. It means they know that the models are contradicting their stated position that cloud feedback is still an unknown — and it means that they don’t know WHY the models are doing this — but they are accepting the models as valid nontheless.
Neal asked me to explain what Nir was saying int his reply. Nir gives the gist of it, the paper in question made a mathematical error in order to achieve a low statistical significance for the correlation with temperature. Once the error is corrected for, the result is still highly significant. That’s what I understood it to mean.
snip
#265, Michael Smith:
That seems an unduly harsh spin on the statement.
I would read it as saying:
– In general, we think the net impact of the role of clouds is still open.
– Right now, the harder we study the physics involved, the more the role seems to be on the positive-feedback side.
– It’s not obvious to us why that would be the case.
– Until we find something to correct, these are the models we have, and these are the models we have to use.
Ignatus
Thanks for that. Of course I meant the relative humidity assumption and not specific humidity. However I am experienced in computer modeling and I know we don’t just sit back and watch certain results appear out of models as if by magic – we usually have to constrain them in order to get a solution. Neither can we have many variables evolve by themselves; they mostly need to be coupled. I’ll check the NASA source code (not easy without documentation) but it seems to me that there is a direct or indirect constraint on relative humidity in order to produce a large water vapour feedback. If true, then the distinction between a direct assumption and an indirect assumption which then causes constant relative humidity is a very fine one to make.
“The associated water vapor feedback is strong and if it does not exist (i.e. for example if the water vapor was not a greenhouse gas)”
Of course if the observations say H2O feedback isn’t that strong then it’s probably a bit more complicated than that.
#266, Andrew:
With respect to Shaviv’s paper:
My point was that I read the counter paper, and I could get a good sense of what their concerns were. Not specific technical details, but I could understand enough to see why they would have problems.
I read Shaviv’s reply, and, yes, I got that he thought they made some sort of mistake; but I couldn’t understand his arguments. They didn’t make sense to me.
Since neither side has retracted their position, I have to go with what I understand. What would you do?
The models will probably never agree with observations. As is noted, it is a chaotic system that is being modeled. A key question to ask about the atmosphere and heat would be: What is being heated? A rather simplistic question, yes. However, with all the talk about heat that comes in versus heat that is leaving, there is very little talk about heat that is being taken out of the system. I’m talking about organics, which absorb photons or heat and change it into something else entirely. Even when organics die, their corporeal remains do not completely change back to the original heat or photons. They enrich soil or become part of other organics. It is one thing to simply wave your hand, and say that the cycle of an organic is so short as to be inconsequential, but where is the proof of it. If more plants and animals start to exist because of the increase of nutrients that is represented by the increase of carbon dioxide, then there is a heat sink that is soaking up some of that excess heat that people are so concerned about.
A good engineering paper would always state what assumptions are being made, with that being just as important as the data that is being presented. If it is assumed that plants and animals make no difference to the heat balance, then that should be clearly stated somewhere, at the very least to show that it was considered.
Tom C says :
I certainly would never claim such accuracy. And i agree with you that politicians are misguided when they do.
Raven says :
OK, these are perfectly sensible suggestions.
If i heard you right : given the economic and human capital at stake, climate science should raise its standards to meet that of engineering or medicine.
I would agree with that. So the logical step is an Hippocratic Oath for climatology, and a thorough, independent checking process for every climate study – something akin to clinical trials.
How do you implement that in practice ?
280, how did the medical and engineering professions implement that? I think your entire profession needs to go off to Japan for a crash course in quality culture.
The discussion in this thread has been thought provoking for me and brings me to agree with Steve Ms original proposition that an exposition of climate modeling used to predict the temperature increase for 2X CO2 should be expeditiously undertaken and most logically fall to the auspices of the IPCC.
My view of these issues as layperson with some technical background in these matters discerns that many scientists would agree that the most straight-forward and less uncertain part of the modeling deals with the radiative transfer part of the process. Witness, however, Neal J Kings explanations in this thread of separated parts of that transfer process (with which I find no reason to disagree) that in the end are not comprehensively tied together. To me the radiative transfer processes are not always intuitive. While that could be the result of a lack of technical understanding on my part, I believe I saw the same observation made by Neal J King in this thread. So while it appears obvious to me that the most uncertainty comes into the modeling from the moisture/cloud feedback process and that is where an exposition would need to concentrate its efforts, a comprehensive review and exposition of the radiative process with any assumptions spelled out would be in order.
Since the IPCC is a review body that at the same time is advocating for rather immediate mitigation of AGW, one must ask why they have chosen not to provide such a comprehensive exposition of 2X CO2. It was rather obvious to me that the IPCC played down the evidence of unprecedented warming by way of temperature reconstructions in AR4 and thus climate modeling becomes the favored means of pushing immediate mitigating actions. In that light it becomes even more puzzling why the IPCC has not done an exposition.
That the IPCC does reviews as an advocate of immediate mitigation could and probably will make their exposition more one-sided than if carried out by a non-advocating body, but I think that the readers have learned to filter the information and could make good use of a reasonably comprehensive exposition.
While the odds of the IPCC ever choosing to do such an exposition may be long, I think, taking from an earlier post in this thread by David Smith, it might be instructive to have those posting here with the more extensive technical knowledge on this subject matter suggest outlined items that might be appropriate for inclusion in such an exposition.
@Neil King #64
You are incorrect about what could be referenceable and also incorrect about the vast range of types of engineering quality reports.
As to types of reports:
Engineering reports often describe “This is what I found”. The explore possible safety scenarios, run computations on hypothetical design implementations. Many use models that parameterize physcial processees, just as GCM’s do. (The engineering models just happen to parameterize different processes, as one only includes processes relevant to a situation at had. I suspect no GCM has a parametrization for the effective viscosity of radioactive sludge as a function of solids fraction, nor the electrical condicutivity of moten glass as a function of temperature..)
As to what is referenceable:
NASA and all DOE laboratories routinely publish documents that are made available to the public and are entirely referenceable. The agencies have their own libraries, assign publication numbers, and make all accessible. If Climate modeling followed the pattern used at DOE labs use in environmental restoration work or similar projects, there would be a series of NASA documents describing all details used in GCM computations in great detail. (You can see examples like Mechanistic analysis of double-shell tank gas release. Progress report, November 1990 or Multiphase, multi-electrode Joule heat computations for glass melter and in situ vitrification simulations.
The DOE documents for environmental restoration tend to be very detailed, describe all assumptions, and show many subordinate results for reviewers to examine. This type of documentation is not limited to things like building bridges from materials with known properties, but extends to computations to estimate how contaminants might travel in ground water — including how bacteria or larger life forms might be involved in the transport etc.
These documents include sections that describe This is what I found out. they simply include much more detail describing how it was found than one would include in a journal article. (In some cases, sections of these reports are rewritten into journal articles– but often time simply does not permit. Also, many chunks of analysis must be documented to show that something was considred, but it would never be suitable for a journal. In any case, these projects generally don’t give a hoot about journal publications, so those that are written, are written by someone in their free time.)
For better or worse, NASA GISS doesn’t appear to have equivalent documents for their climate change program and the scientists at Real Climate, and you, don’t even seem to be aware of the existence of these types of reports.
The problem for Ph.D’s in climatology is that documents of this type are very time comsuming to write (more so than journal articles. ) Also, though they often contain secions of original work, by their nature, they also contain large sections of simple exposition to simply explain in laborious detail how that result was found. (The closest comparable thing in Academia is a ph.d. thesis, which will often contain many, many pages in proportion to the amount of original work. Programmatic reports for science and engineering science projects are even more detailed in illustrating everything that was done on the project. )
For 3rd parties with questions, these documents are invaluable. They collect huge amounts of information in one place without forcing the reader to look up 20 references to find the assumptions used to obtain the solutions in a single GCM or radiative-transfer model. The documents show that sensitivity analyses and bounding calculations which could never be published in a journal– were in fact performed and permit 3rd parties to learn the results without repeating the computations. Some sections justify assumptions that would routinely be accepted by specialists.
In so far as “pure science” is concerned, much of this is tedious to read and write. That said, as we move into decision making all this becomes necessary.
In so far as we have progressed to having government employees participate in the IPCC, NASA does publish all sorts of small booklets, phamplets and other bits of literature for the school-teacher level set, and the public must make informed choices about limiting energy use or sequestering carbon at the voting booth, the lack of these sorts of documents is a programatic failure on NASA’s part.
@Larry
Actually, I think engineers often write these massive reports because they are required by policy types. The stuff engineers do in actual practice designing and building things can be tedious enough. But, I still remember having to add a section to a document explaining why, once hydrogen diffusing out of water was mixed with the neighboring air as a result of the constant action of fans circulating the air, it would not subsequently re-concentrate to form an explosive pocket of hydrogen somewhere in a large room.
On the one hand, I understood the value. On the other hand. . .
Larry– I worked at a DOE lab. I don’t remember ever coming across an MBA type.
But, the fact is, all work was ultimately done to guide decision making. In this sort of situation, you can’t simply cite a paper, and tell the decision maker, who was often an engineer or scientist in some related field to order up the references and sift through to find the relevant bit that supports an assumption.
The engineering document must not only cite the paper, but re-iterate the portion used in some detail. This doesn’t necessarily involve quoting, but it may involves including material one would never include in a journal article (both to avoid boring people and to minimize page charges.)
The goal of these documents is to permit a scientifically educated reader not necessarily in my specific field (multiphase flow) to understand the basis for my findings without having to order up the references. Similarly, when I had projects that required me to have a chemist investigate something, he had to explain it so I could understand.
Journal articles and engineering reports of R&D have entirely different goals, and are dissimilar for that reason.
Lucia, I’m going to resist going off on a tangent here, but it seems like among the differences, maybe the essential difference, is organizational culture. The climate science tribe hasn’t evolved beyond it’s original knowledge gathering role and into it’s policy advice role very well. To be fair, the policy tribe has put them in a spot by asking them to do something they have never done before. No surprise then, that we get these blog equivalents of blank stares when the engineering report is brought up. It’s like expecting a tribe of hunters to know how to farm.
It also doesn’t help that we have meddling from political operatives, some of whom like things the way they are, and would specifically resist any effort to force them to dot their “i”s and cross their “t”s. But as I said before, that’s what engineering consultants and technical writers are for. The scientists themselves don’t have to spend a lot of time dealing with this. They just have to culturally adapt.
If you have ever seen the TECH SPECs that goverments ask for and issue on a daily basis You too would wonder how this has gone on as long as it has with out.
Perhaps of interest concerning fixed RH in climate models:
From p. 471, Held and Soden, 2000.
Of course, this paper is about 8 years old now.
Maybe something like this:
Now that the preliminary phase is over, why haven’t you archived your data and programs for it, and where is the summary written with me as your audience?
Well, I…
You have a week. Now get out of my office.
Neal said, in 267:
If that were what the IPCC were saying, I’d be a lot less critical. However, that is not the message I hear from them.
re 291. Its easy Mike. There has never been an systems requirement document. (SRD)
there has never been an Systems requirements review. (SRR) no prelimary design review (PRD)
no critcial design review (CRD) no test plans, no acceptence test, no nothing.
You go read through through the Errata on the GCM data site for the IPCC. It’s Pee wees
big adventure. and these GCM are only 100K LOC. It’s pathetic.
#272, Lucia:
To quote you:
And that was my point.
#271, Kenneth Fritsch:
What your comments suggest to me is that what would be really useful would be a series of expository (not research) articles.
An article on the calculation of the forcing due to a 2X in C-O2 concentration would be a good chunk of material, and could be based on the work that is already in the published literature. Some of these papers have been linked, and need to be unpacked with a view towards exposition rather than claiming intellectual territory. In principle, there are a lot of people who could do that, with a little cooperation from experts.
An article on how to convert the radiative forcing to climate change would be much harder: There are many more aspects, and lots of options and possibilities. In practice, it is probably going to be a matter of understanding & describing what the different modules of the GCM code do today. For this you need someone with actual and intellectual access to the code: basically, a GC modeler who likes to write.
I bet both of these could be done well before anyone has been able to convince DoE, NASA or any other climate-science organization to try to re-create existing functionality according to somebody else’s conception of a proper documentation scheme. Nobody will want to do that: “If it ain’t broke…”
@ Neal:
Yes, we all agree they don’t have them.
But, why don’t you or the NASA climate scientists know about these types of documents? And why did you think these sort of things are un-referenceable?
Not creating these documents– not even being aware of these sorts of documents are routine in other fields– is rather unique compared to other government entities. Publicly funded agencies exist both to serve the public, and communicate results to the public so the public can make their own individual educated decisions.
In climate science, all done with public funds, these sorts of documents don’t exist. This is not a good situation.
It would be nice if the climate scientists could be made to understand what level of communication is required. So far, that hasn’t happened.
Do you have any suggestions to remedy this problem?
JEG –
Thanks for your willingness to engage in this discussion. FYI, lucia has done a great job in posts 272-274 of laying out what sort of technical documentation is required when lives and large sums of money are at stake.
You and your colleagues have to realize that you are not the only smart people in the world. The engineers involved in these laborious and unglamorous efforts took the same advanced math and chemistry classes that you did. In fact, a point Lindzen always makes is that the biological and earth sciences usually get the second tier students, with first tier students going into physics, and chemical and electrical engineering.
It’s of course the case that academics can’t be expected to operate in the same meticulous manner and at the same glacial pace that engineers in, say, the nuclear industry do. But, when academics become advocates, appear on CNN and in Time, and push politicians to enact legislation with huge economic consequence, then the level of technical accountability has to rise.
#283, Lucia:
I don’t have anything to do with NASA or with climate-science activities. There’s no more reason that I would have any knowledge about their documents than I would about internal documents of your grandmother’s estate.
My reading of the situation is based on my reading: Given that there don’t seem to be expository articles around, and all I see are normal scientific papers, I draw the conclusion that they are handling this the way scientists I know develop programs: They figure out what they want to do, and start programming it. When they find a problem in their algorithm, they change it. Documentation comes later, just to make sure they can find what they need to find later.
Therefore, the reason that the documentation of the style that you want for these studies is un-referenceable is obvious: It doesn’t exist.
The fact that documentation of the style that you want does exist for other work is of no avail.
I have made my suggestion in #282. As for internal NASA procedures: It is not even the case that “I only work there”; rather it is the case that “I don’t even work there.”
#284, Tom C:
If these climate scientists had set out to affect national policy with their studies, you would have a point. But it is far more plausible that these GCMs were developed to test and develop scientific understanding of climate principles, and were thus developed in an exploratory ad-hoc manner that is not conducive to good documentation practices.
Years later, you can say, “You guys should have been operating in a disciplined manner with structured documentation all the time.” But it’s too late by then. Some of these GCMs have been developed over a decade. You can’t retrofit structured documentation, no matter how important the results are.
There are two saving graces to this situation:
– When code is developed in such a manner to model a physical phenomenon, everyone associated with it is thinking hard all the time to find any disagreements between anything measurable or testable and the results. When simplifications (like the reduction of a 3-dimensional problem to a 1-dimensional simulation) are made, these receive a lot of scrutiny and physical analysis, so the developers have an idea of how much of an error is being introduced, and perhaps of what sort of problems the program should NOT be applied to.
– There are several GCMs, developed by different groups under different assumptions. Naturally, they give slightly different results: some of them are specialized for certain aspects of climate phenomena. However, a result that is supported by a large majority of the GCMs is very likely to be true.
So the only ways that I see to provide clarity into the GCM programs are:
– Document and explain the GCMs as they are, warts and all; or
– Re-create all the functionality of these GCMs using DoE-standard practices to re-code everything from scratch.
In today’s budget situation, you can guess which is more likely.
Re #286, NJK, Jan4, 11.56pm: As a lurker following this thread (and others), why can’t the IPCC, real ‘climate scientists’ et al just simply tell the truth.
1. The science is demonstrably “not settled”.
2. There is an inadequate understanding of how global climate works, and what affects it.
3. There is no “consensus”.
4. The uncertainty levels in projections, forecasts etc are high.
5. Monte Carlo simulation using probability distributions on key input variables must give results with flat kurtosis, ie equal probability of any outcome, thus explicitly demonstrating that knowledge is insufficient.
6. For perhaps understandable reasons, the support for key assertions is poorly documented, and mostly not compliant with normal standards and contractual requirements.
7. The ‘climate scientists’ have not, for whatever reason, been able to apply usual standards of validation and verification to their work.
Notwithstanding, as explained by Stephen Schneider and Al Gore, the problem is so serious that it is appropriate to exaggerate the truth so as to ensure the public become sufficiently concerned that they pressure their governments. “The end justifies the means”.
The problem is that searching questions are revealing the truth re the above.
Wow, 2 days and 286 responses. This has really stirred up the engineers and its about bloody time. What are they teaching in climatology nowadays? I don’t know James Annan but he gets a fail in engineering heat transfer. Tom Vonk #199 is right on the money, average radiative temperature is only equal to the surface temperature for an isothermal surface. A simple one page spreadsheet will reveal that for a sphere the spatial average temperature for an average insolation of 250 w/m2 is about -6C not -18C so just correcting the maths removes 12C from GH. Also when heat is transferred from hot spot (tropics) to a cold spot on the same surface it will raise the spatial average temperature but the average radiating temperature will remain the same.(one temperature drops , the other gains but both have to rise again to satisfy the solar equilibrium)
#202 what is so physically special about 3km being the radiating determinant. It looks suspiciously like it was chosen because the model could not match the insolation at higher altitudes (ie no physical basis). My own model based on sound chemical engineering principles had the same problem until I discovered the extreme sensitivity to the lapse rate (ie humidity)Just small changes gives large changes to upper troposphere radiation.
Chemical engineers really need to get involved in this debate.
A few thoughts related to this interesting discussion.
The scientific model developers I know would not know how to write the sort of engineering reports being demanded here.
However, they do follow methodologies of their own (code management, test harnesses, validation notes) that try to build and enhance the best model of current climate without introducing scientific errors or bugs.
I’m prepared to be corrected here, but I suggest that production of a complete climate model is sufficiently different to other engineering processes:
– it is a product of very many people’s work over which the person who builds the full model has little control.
– it is continuously being improved which means that a document that is supposed to prescribe its design is out of date before it is signed off.
– the coupling between the numerous components is complex and yet is still not a complete, or even good, representation of what is being modelled. What use does an “engineering” description of such a thing add?
Steve Mc is literally asking for the earth. His proposed exposition is essentially an engineering description of the real earth and we don’t yet have the knowledge.
I am not saying that there isn’t room for improvement. Currently a lot of work is being done on improving documentation of individual model components to a stage where a complete model can formally be described. But other than enabling reproducibility, all such a description will give at the moment is that “this configuration produced a warming of X celsius due to A, B and C.” which doesn’t answer Steve’s question.
Steve Mc: Puh-leeze. I’m not asking for something where we don’t have the knowledge. I’m asking for a proper exposition of the knowledge that we think we have. If there are key water vapor parameterizations, an engineering quality report would have a detailed exposition of our knowledge.
Here is something interesting:
I took all the stations at 3000m and above (53 of them) in v2.temperature.inv (ftp://ftp.ncdc.noaa.gov/pub/data/ghcn/v2/v2.temperature.inv) and sorted them by altitude. Then I got all the temperature data for each such station from v2.mean (ftp://ftp.ncdc.noaa.gov/pub/data/ghcn/v2/v2.mean.Z) and took a quick and dirty average of the temperatures over all the years of data for each station, ignoring any missing data (I did not attempt any interpolation). I then subtracted 14.85 degrees C (288K) from each such mean temperature. I based the value for observed on JEG’s post no. 118 (http://www.climateaudit.org/?p=2528#comment-188973). I then divided by the altitude for each station in km to get an “effective lapse rate” for each station. I then took the “effective lapse rate for each station” and divided by the absolute latitude for each station to obtain a ratio of something. Here is the graph of the ratios.
As can be seen, most of the ratios for each station are within a rather narrow band. The outliers are: (from left to right) Cotopaxi (-2.34), Vostok (-0.26), Canar (-0.50) and Izobamba-Santa Catalina (-2.79). The only station with a positive ratio is Jauja (0.16). As I said before, this is a quick and dirty, so it may not be perfect. I have not tried to figure out why some stations were so different from the rest. I will post a complete list of stations, id nos., altitudes, latitudes and ratio results if requested.
I guess you could call these numbers lapse rate latitude ratios. Any thoughts?
I suppose you could predict the mean temperature for a given station by multiplying the lapse rate latitude ratio average of -0.104 (not counting the outliers), multiply by the station’s absolute latitude, then multiply the product times the station’s altitude in km and then add 14.85 to obtain an estimate of the station’s mean temperature in deg C. I have not tried that with any other stations.
For most of the 53 stations in the sample, v2.mean only had data up to 1990, give or take a year. For most of them data started in the fifties, although a few of them had data starting much earlier. A few had data that ended well before 1990 or so. The four outliers had data as follows:
Cotopaxi 1961 to 1991
Vostok 1958 to 1991
Canar 1961 to 1991
Izobamba 1975 to 1990 and
Jauja 1961 to 1981.
Re # 286 and # 192 Neal J King
I mentioned a structure of a corporation with a Board and Managers and some of the main functions of each. I noted that if the IPCC could be considered as a Board, it had failed in a corporate governance sense. Some failures are noted by Tevor in # 287.
Your response in # 192 was to say that the IPCC was not a Board and that it should attract no blame.
That was my point. It should act as a Board, it should take the blame. At present, nobody does.
It should set objectives and select teams (Managers) to strive to address those objectives.
Then, in your #286 you mention budget. Given that money is the root of all evil, funding is the method to make the corrections and improvements. Sub-contractors like NASA (the Managers in my analogy) should not be paid until their work has been audited as to quality, completion, documentation and benefit:cost ratio.
Statements of Policy to the public, including decision makers, should be open to all and made ONLY by the Board on other than trivial, routine matters. Such statements should be crafted so that poor quality work, such as failure to fully disclose, if subsequently found, can be rewarded by dismissal or even punitive measures.
The money being spent so blithely by these AGW people was probably generated by many people who disagree with at least parts of reports to date. These paying people often work to rules like the ones I have outlined above.
Negative monetary feedback to the IPCC will be a plausible consequence.
There is no tolerable place in society these days for professional people to act like the young bull who saw the hole in the fence to the cow paddock.
Re # 289 **Steve Mc is literally asking for the earth. His proposed exposition is essentially an engineering description of the real earth and we dont yet have the knowledge.**
What Steve M is asking for is a good detailed report. You have to note that many are saying “the science is in, there is no more debate”
What many of us are saying is that there is a lot of work to be done to understand the processes and also to describe the known processes.
@Neil:
I think you are defining “normal” as what is done at universities, or some private companies.
This is not entirely normal operation at a government funded institution. In these institutions, normally regular programmatic reports are required, and their contents are negotiated by the programmatic managers. So, normally at labs, these things are documented. Normally, the programmatic managers at government agencies know that part of their mission is to provide documentation for consumption by the wider public.
Some groups get exempted, under special circumstaces, but most agencies have requirements for documenting findings. These docments aren’t always wonderful documents– but they usually exist.
These aren’t required at universities and are rarely written by scientists working at universities. So, if NASA were a university, I’d say, yes, this is normal. But, NASA GISS is not a university.
By 1988, NASA GISS’s funding for these programs was motivated by a need to guide policy decisions. That was the stated reason for funding in these programs. Other climate programs were establised– DOE’s ARM.
Since as far back as 1988, when Hansen got funding on the basis that this knowledge was important to policymakers, failure to follow normal documenting procedures for tax-payer science that was intended to guide policy was a lapse at NASA.
Yes, Steve is asking now, but the lapse is real. No one is asking for these reports back from 1912. They are looking for things that should have been created during the period when NASA GISS was funded precisely to provide informaiton that would guide policy.
The key question going forward is: Why can’t the documents be made to exist in the starting now? I don’t mean go back and document the old codes, I mean: Can’t they write them up for their current model?
288 Gary
Can you post your spreadsheet calculation?
Re 202, Neal has already in several posts stated that he is unsure of the 3km number, and regards its value as an open question.
re 286. re -writing a GCM. Neal we call this reverse engineering and people do it all the
time using CASE tools.
As for how much it would cost, from scratch? ModelE is 100K LOC
Cocomo says about 6 Million dollars, if you pay the software guys 100 bucks an hour.
there is a range of course, but it’s not a huge sum of money
http://www.cms4site.ru/utility.php?ecur=1.12&eafcur=1&utility=cocomoii&sloc=100000&pph=100
Does nasa know how to estimate the cost? yup
http://cost.jsc.nasa.gov/COCOMO.html
#289
Puh-leeze is right. Hate to cheerlead, but get a grip.
288,
Hear, hear.
re 289. Hi SteveM you wrote:
“However, they do follow methodologies of their own (code management, test harnesses, validation notes) that try to build and enhance the best model of current climate without introducing scientific errors or bugs.”
Methodologies of their own. Note the similiarity between this and “new statistical approaches”
The point is that there are accepted, documented and tested methodologies of software development.
Learning them is relatively easy, but it’s tedious work. As for tests I have looked through
modelE and I didnt find that the code was instrumented for test. There were no test files,
test results, simple things like unit test. Simple things missing from the code that would
allow the automation of basic documentation. I found some inline notes that would give you
great doubt about the process.
“Im prepared to be corrected here, but I suggest that production of a complete climate model is sufficiently different to other engineering processes:
– it is a product of very many peoples work over which the person who builds the full model has little control.”
It’s no different in engineering models. You very often inherit code from other folks, from
the government, from other companies written by many different people. The difference is in engineering
people are trained to develop according to a methodology. Style guidelines, specifications,
test suites, driver programs. You do it this way so that the code can be maintained and
improved, and preserved when the programmmers move onto the next project. The full model
is built by many people with controlling documentation and proceedures.
“- it is continuously being improved which means that a document that is supposed to prescribe its design is out of date before it is signed off.”
You dont understand the process. Engineering models are also being constantly improved. But
again there is a process. You propose a change to the design. This change is documented
in full. When the proposed change has been approved the coding starts. It is tested in isolation.
it is then integrated and then released. The design document has already been changed, before
the code change. That way the documentation is always up to date.
Now a GCM can be created using standard methods. MIT has a good example. So, there is nothing inherent
in a GCM that precludes good practices.
Re comment 121: Arthur Smith
“This seems a little confused (depends on what lowering carbon dioxide means), but given the point about fossil fuel use, it seems to be definitely referring to emissions rates, not the CO2 levels in the atmosphere. And that is simply manifestly completely wrong. We are emitting enough CO2 every year to add 4-5 ppm to the atmosphere. But the CO2 concentration in the atmosphere at 380 ppm has accumulated close to 100 ppm total, above pre-industrial levels. So it is most definitely
accumulating, and that 100 ppm is not going to disappear almost instantaneously if we stop emitting!”
To clarify, what I am saying is that if we were to stop emitting carbon dioxide, the CO2 levels in the atmosphere would instantly return to pre-industrial levels. The caveat is that this occurs on a climatological (meaning geological) scale–meaning perhaps hundreds of years. There is no question that emitting CO2 will cause it to accumulate over short geological periods. But slower processes, such as sequestration, also work against it.
This statement is the very basis of the effort among those who wish to pressure governments to lower CO2 emissions. Indeed, if it were not true, there would be little or no benefit to reducing CO2 emissions.
Even http://www.realclimate.org
admits that removing CO2 reduces the fraction of longwave radiation absorbed by 9%, a number well within the range considered in my article. From what I can make of their table, the contribution of water vapor + clouds is 85%. However, some of their numbers
appear contradictory.
Whether the exact number is 5% or 9%, because the estimate is based on the percentage of warming, not percentage of radiation absorbed, that is attributable to CO2, feedbacks are automatically taken into account.
That said, I have never really been comfortable with this approach since it is so hard to pin down the exact number. That is why in the latter half of the article I went to a curve-fitting approach from the temperature records. That approach results in an estimate of 1.76 +/- 0.27K as the upper bound for doubling.
Interesting observation: the people who have skeptical inclinations generally want a complete exposition, and the ones who don’t seem to think that the task is impossible. Which raises an obvious question: if you can’t make your case in rational discourse, why is there so much confidence in the conclusions?
I think the real reason why there’s resistance to this idea is that being forced to lay it all out in gory detail would highlight all of the weak spots in the logical chain and make it much more difficult to hand-wave an SPM with conclusions of 90+% confidence.
@ 289.
Where you are incorrect is in believing these features make the work different from engineering R&D at government labs.
Your bullets describe precisely the sorts of codes and analyses that are done for clean up work at places where we are storing aging radioactive wastes, and places we propose to store it in the future (i.e. Hanford, Rockie Flats, Savahnah River, Yukka Mountain).
These sorts of documents are absolutely required because the bullets you describe apply to the work. I provided links to two such voluminous reports.
The fact that multiple people people work on different portions of a code or analysis makes the need for the reports more urgent, not less urgent. That fact that assumptions change over time makes documentation more urgent. If it is not done, how are people hired in 2000 to know what assumptions were used in 1990? What if the person in charge of the 1990 code moved to another job in 1995 and is not available to quickly and lucidly explain his own particular set of unique assumptions? (All models contain some.) What if he doesn’t remember why he picked a specific value for a specific parameter?
When I worked on Hanford Safety projects, other engineers and scientists needed to know the basis for my findings and predictions. They needed to learn the basis quickly to apply them to their own work. They needed to know how their details related to mine. They needed to be able to judge for themselves where model improvements were required, what experiments need to be done etc.
That’s why all these tedious reports are written precisely when the bullets you describe apply to a project.
NASA GISS was documenting the way one might expect for a project led by one PI with two graduate students — and then the groups forgot to make the students document details in their theses. They just wrote a 30 page peer reviewed article and stamped that “a thesis”.
I’m not saying the work itself is flawed, or the predictions are incorrect. I believe AGW is probable. But there is no point in pretending that documentation was not horrible lax as compared to what one would normally expect for large, publicly funded research at a government funded laboratory! Because there are no detailed Ph.D. theses either, the GISS documentation of many portions is lax compared to what we might expect at a university.
Possibly you do not work for DOE. They are constantly stopping work on important projects, just for the purpose of having us generate copious amounts of paperwork. We do sometimes find design flaws from doing the retrofitted structured documentation, so it is valuable and necessary to do it. You could say, that the more important the results, the more important to make sure the documentation gets done.
@Larry
I suspect the reason is more innocent. I’ve written these types of things.
Writing these documents is time-consuming and boring compared to doing the more exciting novel stuff. Unlike writing for the school-teacher set or the NOVA special market, much of this writing needs to be done by the researchers who did the work. The information to created the documents can’t be passed of to technical writers by way of Vulcan mind meld.
No one who can write these things, likes to write these things. So, unless the program managers or funding agencies require it, it doesn’t get done.
That’s why I say this is a programmatic lapse. It’s not a lapse on the part of individual scientists like, for example Gavin. My guess is his guidence was to write journal article. He was happy to do so and didn’t know anything else was done elsewhere.
The problem is higher up.
304, maybe you didn’t have the resources available, but engineering consulting firms have all of the technical writing and organizational skills that scientists generally don’t have, so this doesn’t have to me a major drag on the scientist’s time. But it will require some time. Nonetheless, I think that the arguments that they don’t have the time/skills/resources arguments are false. And frankly, if we have governmental and supergovernmental organizations who don’t have millions to do this right, but have trillions to react to it, it’s simply being mismanaged.
Why do all discussions about software documentation seem to come down to be between: Group A made up of people you know it is vital, consider it Standard Operating Procedure, do it every day in their careers, and Group B made up of people who have never done it and say it is impossible to do?
You could get the impression that those in Group B have never heard of Software Engineering processes, methodologies, and procedures of any level of rigor. Even while they trust their lives everyday to products and services that would not exist in the absence of Software Engineering.
The discussions about science vs. engineering projects are way off base. Any and all attempts to encode into computer software knowledge of inherently complex physical phenomena and processes require exactly the same kind of work. Labels relative to the origin of the work do not ever apply. While natural phenomena and processes might seem to be extremely complex, humankind have made some equally complex systems made up of equally complex subsystems. Ask lucia about transient, turbulent, multifluid/multifield/multiphase compressible fluid flow and heat and mass transfer in complex engineered equipment.
Documentation of computer software, and the vital necessity for such documentation, will eventually become a focus area in the climate-change community. All software the results of which might effect the health and safety of the public is required by Federal laws to be subject to independent Verification of the mathematical models of all physical phenomena and processes, the numerical solution methods, and applications of the models/codes/users to all analyses. Ultimately the Carbon Regulatory Agency will have all calculations under a microscope before decisions that might effect the health and safety of the public are undertaken.
Additional details regarding some of these issues are here and here with a summary document here.
Steve: Again my point is not specifically about software engineering. My own contact with engineering reports comes from mining engineering reports, where software is not an issue, but the description of ore recovery processes, mining plans etc are very detailed.
#260 Keating (and earlier King articles)
You asked me if I could provide a reference for Lindzen and 8km optical depth. I am afraid that is just what I wrote down while I was listening.
However, googling confirms that tau _is_ optical depth, and the following reference also mentions 7-8km.
Does this help?
FSSP (Forward Scattering Spectrometer Probe), FSSP-100, TAU, Cloud water droplets size … commonly water, ozone and aerosol optical depth, 7-8 Km …
eufar.meteo.fr/experiment/instrument/list_instmea.php?order=it.szacronyminst&mea=16 – 14k
#302 – Lucia, you worked at Hanford, i.e. PNNL (or PNL as it was) for DOE? I was there briefly around 1994-95 (I was a postdoc at U. Washington in Seattle) working on some computational chemistry code for the Environmental Sciences group. It was a big coding project; I don’t recall a lot of paperwork though. Unfortunately what I’d been working on was in ‘C’ and they were still big on ‘Fortran’, so I’m not sure they ever used what I gave them anyway…
#300 – Thomas Nelson: as I noted in my original comment, 9% is the minimum contribution of CO2 to the LW absorption – if you remove everything except CO2 then you are still left with 26% of the effect. I’m glad to see you come up with a somewhat reasonable number, but again, for the reasons we’ve discussed at length here (negative forcings, delayed response) it’s *not* an upper bound on sensitivity.
Re #302:
Let’s note that the Yucca Mountain repository consists of both man-made and naturally occurring systems and components, and that both types of systems play a direct role in ensuring the safety of the repository.
Let’s note too that the natural systems at Yucca Mountain are somewhat complex, and have some degree of uncertainty associated with them as to their ability to support the specific long-term performance objectives of the repository.
Yucca Mountain must be licensed by the NRC before it can accept nuclear waste. For purposes of licensing a nuclear facility, serious deficiencies in the Quality Assurance program will have exactly the same impact as actual quality deficiencies in the systems and components themselves; i.e., no operating license is issued.
When I was working software QA with the civilian nuclear waste program, the most difficult challenge we faced was convincing the scientists that their research-grade software wasn’t sufficiently documented and tested to pass muster under nuclear QA standards.
Some of them still refused to get on board, and had to be threatened with dismissal before they would make any serious effort to do even a minimally acceptable job of documenting and testing their code.
Had these scientists been allowed to continue using undocumented and unverified code, then the failure of the QA oversight program to stop those abuses, and the failure of management to enforce a quality-conscious software development philosophy, would have been sufficient grounds by themselves for the NRC to deny an operating license — separately and apart from any quality issues the software actually had.
Are the climate models of sufficient importance to the maintenance of public safety that they need to be documented and tested according to production-grade standards — CMMI, IEEE, etc.?
Note that this is a separate question from the question of whether these models are a useful and valid tool for supporting climate science research activities as these relate to AGW.
#303, LadyGray; #302, lucia; #301, Larry; #299, steven mosher; #296, steven mosher; #293, lucia; #289, Steve Milesworthy;
Steve Mileworthy’s #289 states more explicitly the way in which the coding of these GCMs undermines the process of good documentation of the development. Others have claimed that other governmental agencies do it, so why shouldn’t NASA?
I think there is a very good reason why the situation is a bit different. As far as I can see, the other programs given as examples are not in the arena of exploratory/explanatory tasks. In the course of trying to model a supernova explosion in grad school, I had to recast my equations several times when the results failed to match expectations from my physical intuition and back-of-envelope calculations, change implementing algorithms and program architecture; and then do it again and again when I found that my “corrected” understanding needed to be corrected again. This was for a program childishly simple compared to a GCM, which ended up being only about 200-300 lines long. Imagine this process for GCMs, with many more people involved, and much more complex & potentially confusing physical dynamics.
This is not the approach I take to programming when I have a well-defined task in front of me. In that case, I can clearly sketch out the architecture, define modules and their functionality, define interfaces, etc. Even when I make changes, it’s much easier, because I have a better understanding of what the end result is supposed to look like.
But this is not the case with an exploratory problem, where I might conclude that an aspect that I had thought negligible actually turned out to be critical, requiring the re-architecture of the module or even of the entire calculation. If anyone had told me that I had to go through the full documentation/change-control process for my little supernova program (which I would nowadays insist upon for a real development process), I would have told him to go jump into a black hole. (#309, Scott-in-WA: Maybe you would recognize the tone of voice. And I think the GCM is loads more complicated than Yucca Mountain.) It would have slowed me down, I guess, by a factor of 3.
Now, once something is more-or-less finalized, you can document it better (which is what I proposed above). But I don’t consider this full-on “structured documentation”: What you’re doing is writing requirements to fit the code already written, which means that a solid consistent approach to code development is being faked, not provided. The actual justification for having confidence in the final code is the interplay of comparison of interim results with one’s understanding of the physics, and the evolving convergence of the two over the development of the code; that understanding being tested in oversight and discussion by your peers, who will be looking for mistakes and inconsistencies all along the way.
That said, I have nothing against the reverse engineering that steven mosher proposes, although I think it will be hard to get the budget to do it. And, unless people are VERY disciplined against “improving” little things during the re-development, there could be ugly turns. My supernova program again can serve as an illustration: after weeks of development, I was reasonably happy with the results: the magnitude of the shocks and the timing were in-line with the result from the non-numeral analytic approximation. So, the night before turning it in, I cleaned it up a little bit, put in a few more comments, and ran it again.
Damn thing stopped working.
Re 311
Actually,Neal is presently at 267… 😉
A good time for a reminder: quote more than just the post number when you reply, cause the Zamboni comes tonite!
Yours, Emily Postnews
#290, Phil:
– I have no idea of what you mean by “absolute latitude”, or why you would divide the altitude by it.
– Whatever conclusions could be drawn would be heavily dependent on the distribution of stations geographically, and wrt humidity.
Neal King 64, 272:
FEL http://www.acronymfinder.com/af-query.asp?acronym=FEL:
Felony?
Front End Loader?
Free Electron Laser?
Federal Explosives License?
Fysisch Electronisch Laboratorium (Nederlandse Organisatie voor Toegepast Natuurwetenschappelijk Onderzoek)?
Hmmm…
Incidentally, Steve, the Preview function isn’t working this morning.
Cheers — PT
#291, Geoff Sherrington: on a corporate IPCC
Some questions:
– Which human being do you want to head IPCC Inc., or how will this individual be selected?
– Who will be on the Board, or how will these folks be selected?
– Who will have veto power over the final report?
By the way, whatever happens with the management of the IPCC has nothing to do with the issues discussed wrt GCM documentation: the IPCC is responsible only for putting out the report summarizing the state of climate-change science, as documented in the peer-reviewed scientific literature. The scientific work is done by scientists in universities and agencies all over the world.
#288, Gary: on Annan’s calculation
It’s a back-of-the-envelope calculation.
If you have a better one, feel free to publish it.
#313, PT: FEL
Right the third time: Free-Electron Laser
(I used this example earlier in the thread.)
re 309.
Neal you just proved why you shouldn’t be allowed to write code. Just kidding.
The reverse engineering effort is aided by automation. Your worries about people
“changing things” is one reason why we test and retest.
Further you don’t touch
the code in many reverse engineering situations. You formallly document it using
automated tools.
First and foremost there are GCM that are coded and documented according to standards
so your special pleading motion is denied. I’ve already told you about the MIT GCM
and explained that there is NOTHING inherent in the development of a GCM that
precludes and excuses the lack of proper methods.
Some links
http://mitgcm.org/pelican/online_documents/node2.html
http://mitgcm.org/pelican/
http://mitgcm.org/testing.html
See it’s easy
http://mitgcm.org/pelican/online_documents/node14.html
Re 289, Milesworthy
Yes — see http://www-pcmdi.llnl.gov/wgne2007/presentations/ for some fine examples of this. You will note that none of the names are the “guilty parties” we bitch about here. Presumably these are the up-and coming modelers. I doubt many (if any) have engineering training, though.
Your other plaints have already been adequately dealt with, I think.
Cheers — Pete Tillman
PS: Preview is back — thanks!
#306, See – owe to Rich: FSSP
This looks like a list of equipment.
The only connection I see to optical depth has to do with the range of operation of the LIDAR, which will depend on OD. The range is 7 – 8 km.
But all I get out of that is that the LIDAR can determine a distance that is within the range of 8 km, under normal conditions; and if there is greater absorptivity in the frequency band of the laser, it will be a shorter range.
Re 292, Gerald
No, what they’re really saying is “don’t confuse me with the facts — my mind is made up.”
Boy, I’m full of beans this morning…
PT
#317, 318: steven mosher:
Like I said, I’m not against reverse-engineering the GCMs. It will just take money.
And I would wonder if that MIT GCM may have been exactly that sort of project: a revision/re-do of an earlier GCM?
#319, PT: WGNE Workshop on Systematic Errors in Climate and NWP Models (San Francisco, February, 2007)
This shows that GCMers are always looking for errors, especially systematic errors, in their models.
I don’t see anything there that serves as evidence for the structured-documentation / change-control process that we’ve been discussing. I don’t see anything there that would satisfy Steve McIntyre.
And I wouldn’t make any interpretation on the basis of personal names: The question should be, Which groups are represented?
#321, PT: “don’t confuse me with the facts”
Actually, the WGNE Workshop that you yourself cited above shows that the scientists are ALWAYS worried about the facts, and whether their models are telling them something reliable or not.
The facts upon which the IPCC reports place a high confidence are those that are the consistent results from the whole bunch of GCMs.
Re Nelson,
Fair enough. But we have to live in the 100+ years until the anthro. CO2 starts to come to equilibrium with the oceans (etc), thus the interest in the near-term consequences of these emissions.
Arthur Smith(307) & I both don’t feel you’ve really addresed the H2O GHE issue. You say
–which I don’t really understand. Mind, my gut feeling is, your CS numbers are about right. Convince us. Please.
Best, Pete Tillman
RE 322.
Look at the code Neal. LOOK AT THE CODE. then look at GISS code, for example.
Look at the documentation of both.
http://mitgcm.org/cgi-bin/viewcvs.cgi/MITgcm/model/src/calc_viscosity.F
http://mitgcm.org/cgi-bin/viewcvs.cgi/MITgcm/model/src/calc_viscosity.F?graph=1
Go ahead go find the same stuff on ModelE over at nasa.
Now go to ModelE website.. Find the VERIFICATION? can’t? Watch
the college engineering students do it!
http://mitgcm.org/cgi-bin/viewcvs.cgi/MITgcm/verification/
See. it’s not rocket science. College kids do it.
College kids OWN the nasa scientists when it comes to developing a documented
GCM. Stop making excuses for balding nasa C students.
Now you suggest that the MITGCM is a do over of other approaches.
I would say You were a pathetic excuse for a debating opponent, but then
I would have to redefine the word pathetic. Did you browse the code?
the history? Anything?
Click to access ECMWF2004-Adcroft.pdf
Since you have trouble reading links…
“The MIT general circulation model (MITgcm) was designed from the outset for study of both largescale/
global studies and small-scale processes. MITgcm achieves this capability with various features that
have set it apart from most other GCMs, namely a non-hydrostatic capability (Marshall et al., 1997a), the use
of the finite volume method in its numerical formulation (Adcroft et al 1997), the maintenance of an
automatically generated adjoint (Heimbach et al., 2001), and a layered approach to software and computer
technology (Hill et.al.,1999).”
Because you seem utte
#312 (http://www.climateaudit.org/?p=2528#comment-190369) Neal J. King says:
January 5th, 2008 at 11:11 am
(I apologize if this post doesn’t look right. I’m having trouble with the Preview function.)
First of all, I would like to apologize if I wasn’t clear. By “absolute latitude,” I meant the absolute value of latitude in degrees (e.g. -33 would be converted to +33.)
Second, I did not divide altitude alone by the absolute value of the latitude in degrees. First, I attempted to calculate the “effective lapse rate” of a given station by dividing its mean temperature’s difference from JEG’s average equilibrium temperature of 288K in post 118 by the altitude in km. I guess you could say I divided an anomaly from 288K by altitude. THEN, I divided the result by the absolute value of the latitude in degrees.
With respect to your comment on geographical location and humidity, one interpretation of the graph is that the “effective lapse rate” is almost constant regardless of humidity (at least at altitudes between 3000m and 4670m) when averaged over several decades and that the only geographical part that seems to matter is the absolute value of the station’s latitude. Or, you could say that whatever the humidity may be, it is included in this “effective” or calculated lapse rate averaged over decades.
Here is what I think might be interesting:
With the exception of two widely off the mark outliers, Cotopaxi and Izobamba, I have been able to boil down many decades of temperature data down to a fairly simple formula:
where is the temperature estimate for a given station x in degrees C,
(Alt) is in km,
latitude is in degrees
and of 14.85 is in degrees C.
There are three other stations that I identified as outliers: Vostok, Canar and Jauja, but they are not wildly off the mark like Cotopaxi and Izobamba.
Here is the list of stations sorted by altitude for which the above relationship holds (I have marked the outliers in bold:
ALTITUDE,LATITUDE,LONGITUDE,STATION ID,NAME
4670 ,30.95 ,88.63 ,20555472000 ,XAINZA
4613 ,35.22 ,93.08 ,20552908000 ,WUDAOLIANG
4535 ,34.22 ,92.43 ,20556004000 ,TUOTUOHE
4508 ,31.48 ,92.07 ,20555299000 ,NAGQU
4338 ,39.80 ,-105.80,42572469004 ,BERTHOUD PA
4302 ,28.63 ,87.08 ,20555664000 ,TINGRI
4279 ,32.50 ,80.08 ,20555228000 ,SHIQUANHE
4273 ,34.92 ,98.22 ,20556033000 ,MADOI
4176 ,34.13 ,95.78 ,20556021000 ,QUMARLEB
4068 ,32.90 ,95.30 ,20556018000 ,LA PAZ/ALTO
4054 ,-17.58 ,-69.60 ,30285230000 ,CHARANA
4038 ,-16.52 ,-68.18 ,30285201000 ,LA PAZ/ALTO
4024 ,31.88 ,93.78 ,20556106000 ,SOG XIAN
3968 ,33.75 ,99.65 ,20556046000 ,DARLAG
3950 ,30.00 ,100.27 ,20556257000 ,LITANG
3896 ,32.28 ,100.33 ,20556152000 ,SERTAR
3874 ,31.42 ,95.60 ,20556116000 ,DENGQEN
3861 ,28.42 ,92.47 ,20555696000 ,LHUNZE
3837 ,29.25 ,88.88 ,20555578000 ,XIGAZE
3827 ,-15.48 ,-70.15 ,30984735000 ,JULIACA
3800 ,-32.90 ,-70.20 ,30187400001 ,CRISTO REDE
3743 ,40.10 ,-105.60,42572469008 ,NIWOT RIDGE
3729 ,29.05 ,100.30 ,20556357000 ,DAOCHENG
3702 ,-18.05 ,-67.07 ,30285242000 ,ORURO
3682 ,33.02 ,97.02 ,20556029000 ,YUSHU
3650 ,29.67 ,91.13 ,20555591000 ,LHASA
3576 ,46.55 ,7.98 ,64606730000 ,JUNGFRAUJOC
3560 ,-0.62 ,-78.57 ,30684088001 ,COTOPAXI
3500 ,34.73 ,101.60 ,20556065000 ,HENAN
3488 ,28.50 ,98.90 ,20556444000 ,DEQEN
3459 ,-22.10 ,-65.60 ,30187007000 ,LA QUIACA
3441 ,33.58 ,102.97 ,20556079000 ,RUO’ERGAI
3420 ,-78.45 ,106.87 ,70089606000 ,VOSTOK
3388 ,-11.80 ,-75.50 ,30984630002 ,JAUJA
3361 ,38.82 ,98.42 ,20552533001 ,QILIAN TUOL
3350 ,-12.10 ,-75.30 ,30984630001 ,HUANCAYO/HU
3307 ,31.15 ,97.17 ,20556137000 ,QAMDO
3301 ,37.33 ,100.13 ,20552754000 ,GANGCA
3290 ,35.27 ,100.65 ,20552957000 ,TONGDE
3249 ,-13.55 ,-71.98 ,30984686000 ,CUZCO
3244 ,37.50 ,-106.80,42572462006 ,WOLF CREEK
3204 ,31.73 ,98.57 ,20556144000 ,DEGE
3192 ,36.30 ,98.10 ,20552836000 ,DULAN
3174 ,37.85 ,95.37 ,20552713000 ,DA-QAIDAM
3120 ,-2.55 ,-78.93 ,30684226000 ,CANAR
3109 ,47.05 ,12.95 ,60311146000 ,SONNBLICK
3088 ,36.78 ,99.08 ,20552836001 ,UULAN CAKA
3062 ,39.20 ,-106.30,42574531001 ,LEADVILLE;C
3058 ,-0.37 ,-78.55 ,30684088002 ,IZOBAMBA-SA
3049 ,29.52 ,103.33 ,20556385000 ,EMEI SHAN
3044 ,37.20 ,102.87 ,20552787000 ,WUSHAOLING
3018 ,40.00 ,-105.50,42572469006 ,NIWOT RIDGE
3000 ,29.57 ,94.47 ,20556312000 ,NYINGCHI
Here is the graph again:
#299, Thomas Nelson:
What I have to object to in your approach is the use of Beer’s law. The exponential dependence of IR transmission on absorber concentration actually has nothing to do with the greenhouse effect, because it does not accurately represent the radiative transfer of thermal radiation. Also, the calculation of a temperature change requires the intermediate calculation of the radiative forcing; unless you are just assuming a linear relationship between change of forcing and change in temperature.
This makes a great deal of difference when calculating the impact of water vapor. In the model I have been presenting above, derived from textbook presentations of the relevant physics, it is clear that if, as one example, the optical-depth = 1 for the 15-micron IR band at a distance higher than 10 km, additional water vapor would have no effect on the radiative forcing for that band, because all that additional water would be at an altitude below the 15-micron photosphere. (This happens not to be the case; I present it as a conceptual test-point on which to compare the results of your presentation with the textbook-derived version.) However, if I understand your framework properly, you would expect a reduced outward IR flux, and thus additional warming.
#327, Phil: absolute latitude
I’m afraid I don’t see any motivation for considering the quantity:
lapse rate / absolute latitude
Are you trying to arrive at some kind of global average lapse rate?
#326, PT: agendas
Then keep tracking the scientific conferences, such as the one you called attention to above. The scientists get enhanced reputations from finding errors and fixing them, not punishment.
But the very possibility of a monolithic control over the publication of the IPCC reports is exactly why I argue against Geoff Sherrington’s proposed re-casting of the IPCC as a corporation.
And since you are a professional programmer who follows mil-spec protocol (or ISO 90001), you simply went to the backup you made just before those changes, right?
#330, LadyGray:
Since I was a physics graduate student who was taking a class in stellar evolution and it was 3:00 am of the morning it was due, I took the last print-outs I had of the program and working results and turned them in.
It worked out OK. Most of the grade depended on the final oral examination, which was briefly interrupted by an earthquake. I passed in the ensuing confusion.
(last line = joke)
Arthur:
Were you working with EMSL? That was LDRD funded. LDRD funding gets a pass because it’s specifically exploratory work done to flesh out ideas. (EMSL was a uniquely large LDRD project, but it still got a pass.) Postdocs are nearly always on LDRD projects. (When they aren’t on LDRD projects, I usually consider the projectz to be abusing post docs by giving them the type of work that doesn’t lead to publications the post-docs need to land the types of jobs they hope for in the future. Meanwhile, the post-docs don’t get benefits etc. There are exceptions though.)
If your code became anything involved in policy making, someone will have gone through and written something. (You might consider the document worthless drek, but it will be something that would permit a non-specialist to glean some information.)
I did some work on some LDRD projects in Fluid Mechanics, and we got the same pass on documentation. Work actually sub-contrated to Universities also gets a pass much of the time. So if you were at U.WA you would certainly have been insulated from this documentation task.
In contrast codes like TEMPEST, COBRA etc. had theory manuals, verification, validations sets and a variety of forms of documentation. (Sometimes 2 years old, and so out of date, but then new documents had to be written.)
Anything that guides decision making or political decision has paper work out the ying/yang.
Did you ever go to the Hanford library and see all the PNNL publications? I think they archived about a decade’s worth in trailers behind the main building.
The formula posted where:
S=S0/(1-Sum(fi))
Where S is sensitivity is misleading because well the feedbacks must add together as shown, the presence of one feedback can diminish the effect of another feedback. Let a system be comprised of a voltage source with an internal resistance Rint and let the output be the current. A resister acts like a feedback because it produces a back EMF which is proportional to the output current.
If we have two feedbacks which are resisters connected between the terminals of this voltage source the resulting gain or sensitivity as the climate people like to call it will be much different depending if the resisters in series or parallel. When the resisters are in series the feedbacks add as the above equation describes but if the resisters are in parallel, the feedbacks still add but it is possible that the magnitude of each feedback can be reduced enough so that the result of two feedbacks is still less then the feedback that there would be if there was only a single resister.
Neil King
First, explanatory is different from exploratory.
The results of GCM’s are certainly not being used or conveyed as exploratory containing lots of doubt. They have not been funded in this way since at least 1988. They aren’t even being conveyed as simply explanatory of empirical facts.
GCMs are being promoted by climate scientists as accurate and predictive. Moreover, those who suggest the have little doubt in the codes because they believe the codes to be exploratory are sometimes denigrated as luddites who don’t believe in modeling.
You can’t have it both ways. If the codes are only exploratory, and used on that basis, that means they have not been developed to the point of being predictive and accurate. If they are being used as predictive accurate tools, it should be possible to document as we document other codes.
Which are they, exploratory? Or known to have predictive value?
#303, #332, lucia: A pass on documentation
To quote you:
I think you’re making my point. I would imagine that the GCM work began exactly as an exploratory project to flesh out ideas.
I guess that it would be looked at from a policy perspective only after the issue of AGW had emerged as a serious consideration, probably quite some time after Hansen’s talk on the topic.
And as I suggested before, the style of algorithm development would not facilitate orderly software-development process anyway.
Lucia, Neil, this segues perfectly into the latest thread; just taking a couple steps back and observing, it seems like the IPCC started out as an exploratory committee, and never made the transition into a more serious investigatory project as the policy types proceeded with their policy initiatives. They should have reformulated the IPCC before Kyoto. Now we have a policy juggernaut being advised by an exploratory committee. And people wonder why there’s criticism and reluctance.
#334, lucia: exploratory/explanatory
I think it is most likely that the GCMs began life as exploratory projects to find out how to approach climate modeling: what principles to depend upon, what could be omitted, how far you could get in 1-d or 2-d, what numerical techniques were stable, etc.
As they were developed and their output became more and more useful wrt the study of actual climate, I think they have been given explanatory status.
An analogy:
– In an electoral system, the chief honcho is elected.
– In a parliamentary system, the chief honcho works his way through the ranks and eventually gets into position to become the chief when his party has a majority. In a pure parliamentary system, the populace do not vote for CH.
I believe that the GCMs arose to their status as if in a parliamentary system: They started out as humble explorations and developed greater and greater scope and reliability as more insights have been incorporated. Collectively, they represent our best understanding of what is happening with the climate, and what can happen with the climate.
That being the case, they have a certain status as being explanatory, which has been earned, not bestowed.
#336, Larry: IPCC a policy juggernaut?
I don’t see it that way. The IPCC writes reports. The governments have to decide what policies to adopt, domestically and internationally. In this matter, Angela Merkel, the chancellor of Germany, is much more important than the IPCC.
Nor is the IPCC exploratory: they report on the status of the science. The scientific work is done by scientific agencies and universities all over the world, who write up their work in journals – they don’t report directly to IPCC, nor do they get any funds from IPCC.
JEG criticized my rendering of Annan’s observation, saying that GCMs do not use the relative humidity assumption. I’m not making a personal statement on whether they do or not, I’m merely trying to understand Annan’s meaning and will seek clarification. I note a comment in HAnsen et al 1984 which states of his then model:
Perhaps the right interpretation of Annan’s oracular comment is that the 3-D models do not use this assumption, but their parameterizations result in behavior that is virtually equivalent to using the assumption.
lucia – # 332 – yes, I was with EMSL. Though I think the name changed while I was there – I actually only visited Hanford 2 or three times, spent a total of a couple of weeks there and then they also took us down to Livermore lab for some fun with big supercomputers. Figuring out various kinds of massive parallelism was the trick then.
It was definitely an interesting place, but I never got around to seeing the library or much of the rest of the site.
388, I said nothing of the sort. I said Kyoto and cap-and-trade, etc. constitute a policy juggernaut, advised by IPCC. You’ve completely misread several things I’ve said. I think you need to slow down and read a little more carefully.
Re #339
That’s what I took it to mean, and posted somewhere above.
Steve: that hardly ends the discussion. A proper eng report, as I’ve said repetitively, would report the parameterizations, rather than state the net result on the back of a napkin.
336. oy vey.
By gavins own admission ModelE was totally overhauled in the past few years.
Yes, modelE started as a exploratory program, but since then it has been rewritten
from the ground up–By gavins own admission Neal. If you actually look through the source you can see
this.
“And as I suggested before, the style of algorithm development
would not facilitate orderly software-development process anyway.”
The style? Praytell what IS the style of GCM algorithm development and how
do you know this? or are you arm waving?
The other problem you have is you will have to square your special pleading with
what the GCM guys say.
you will have to Square this claim with the claim by Ray P, that the GCM merely
encode the science of the past 200 years. You will have to square this claim with
actually looking at the code. You will have to square this claim with the MITGCM
documentation. You havent looked at a single line of GCM code.
There is nothing unique about GCM algorithms, and even if there were you should still
do the fundamentals. There is nothing UNIQUE about the algorithms of Climate science that PRECLUDE proper
documentation. Nothing. What is unique is a CULTURE. a culture that thinks like this:
“If anyone had told me that I had to go through the full documentation/change-control process
for my little supernova program (which I would nowadays insist upon for a real development process),
I would have told him to go jump into a black hole.”
First time I sat down with a scientist and his code I understood this. He thought the code was HIS.
He thought he would always be there to run it or improve it or explain it or port it.
Rather narcissitic. So I put down my cup of coffee. And told him to watch. I stuck my finger
in the coffee. Then I pulled it out. And I asked him to find the hole.
“there is no hole ”
“correct, you are fired. everyone can be replaced”
Neal #338:
The IPCC and governments (certainly in Europe) have a similar relationship to each other as two drunks on a dance floor, propping each other up.
#328 (http://www.climateaudit.org/?p=2528#comment-190504)
Neal J. King says on January 5th, 2008 at 2:02 pm:
Neal: I would not interpret the quantity lapse rate/absolute latitude as a global average lapse rate. I would interpret it as closer to a global constant (at least between 3000m and 4670m and for data before 1990). I specifically did NOT average station data together. I kept each stations’ data separate.
This is an observed relationship. I do not have any theoretical explanation for the relationship. What is surprising is that the lapse rate appears to vary fairly linearly with latitude, something that I have not seen or heard of before (although I admit I am no expert on it).
Upon closer inspection, I believe that 3 of the outliers may be explained by non-linearities close to the equator in that the denominator (i.e. the absolute latitude) was very small: Cotopaxi, Canar and Izobamba. What is interesting is that the value for Vostok (0.26), with the greatest absolute latitude, may be similarly explainable by a small non-linearity at extreme latitudes.
Again, I would not interpret this necessarily as an average lapse rate. The clustering is so good, that I am saying that the lapse rate/absolute latitude may approach a constant, or is, for climate data, very constrained. Keep in mind that I now have explanations for 4 of the 5 outliers, leaving only Jauja as the only outlier with a positive value (0.16). Keep in mind also, that the formula I am proposing appears to be valid over several decades worth of data for almost all of the stations over 3000m (with Jauja as the only “exception”, and with the other 4 outliers explainable as being due to non-linearities at very high and very low latitudes), an average of 400 months of data per station for 48 stations.
Again, the lapse rate latitude ratio appears to be, considering the stochasticity of climate data, closer to a global constant than just an average (or at least a fairly constrained average), at least above 3000m and for data ending on or about 1990.
So, once again, here is the formula:
where is the mean decadal (?) temperature of a location x in degrees C, Alt is in km and latitude is in degrees.
Hansen’s scenario ABC paper was 1988. What do you mean AGW emerged as a serious consideration much later? When was DOE’s ARM program funded?! (1990)
That was motivated because AGW was a serious consideration then. So, that means the transition from exploratory to guide policy happened at least 17 years ago.
LDRD programs have a time limit of 3 years, and are truly exploratory. That time frame would justify Hansen writing his 1988 paper under the “exploratory” exemption. “Exploratory” means work done to find out whether or not further work is warranted.
That paper indicated the answer was “yes”, more work was warranted and motivated the later funded projects to guide policy. The work done to write the 1988 article may have been “exploratory”. But surely the 19 years of follow on work funded to specifically guide policy is not “work done to only to see if more work should be done”.
At least by 1990, it’s intention was to guide policy.
Or do you really think all these computations are just exploratory an not useful as a basis for predictions or guiding policy?
Arthur,
The library was, in many ways, a depressing place. The librarians were great people. While these reports are necessary and useful, funding and space for journals and books was always disappointing. Luckily, there was inter-library loan.
I left Hanford in the late 90’s. Maybe the library has improved. More likely, on-line access has helped more.
This was prompted by Lucia at 6:09 PM
This is my first post so I will offer this brief bio. 20+ years practiced business law, 9 years working in small manufacturing business including COO, now a business consultant. Not a scientist, but definitely a consumer of engineering.
I have noticed on this and other threads that the issue of what IPCC does or should do and its institutional bias is often alluded to. Sometimes it is best to refer to source documents even in non-scientific fields. It is pretty clear that the IPCC was founded on the principal that GHG could cause higher temperatures than ever in human history. This is presumed to be bad. The following is from an IPCC brochure describing its history:
In 1985 a joint UNEP/WMO/ICSU Conference was convened in Villach (Austria) on the Assessment of the Role of Carbon Dioxide and of Other Greenhouse Gases in Climate Variations and Associated Impacts. The conference concluded, that as a result of the increasing greenhouse gases it is now believed that in the first half of the next century (21st century) a rise of global mean temperature could occur which is greater than in any mans history. It also noted that past climate data may no longer be a reliable guide for long term projects because of expected warming of the global climate; that climate change and sea level rises are closely linked with other major environmental issues; that some warming appears inevitable because of past activities; and that the future rate and degree of warming could be profoundly affected by policies on emissions of greenhouse gases.
…
At its 40th Session in 1988 the WMO Executive Council decided on the establishment of the
Intergovernmental Panel on Climate Change (IPCC). The UNEP Governing Council authorized UNEPs support for IPCC. It was suggested that the Panel should consider the need for:
(a) Identification of uncertainties and gaps in our present knowledge with regard to climate changes and its potential impacts, and preparation of a plan of action over the short- term in filling these gaps;
(b) Identification of information needed to evaluate policy implications of climate change and response strategies;
(c) Review of current and planned national/international policies related to the greenhouse gas issue;
(d) Scientific and environmental assessments of all aspects of the greenhouse gas issue and the transfer of these assessments and other relevant information to governments and intergovernmental organisations to be taken into account in their policies on social and economic development and environmental programmes.
Click to access anniversary-brochure.pdf
The IPCC is basically a bureaucracy created to tell member governments how to deal with AGW. Since that is their mission we can anticipate the possibility of certain behaviors. Max Weber recognized that bureaucracies are subject to becoming rigid in their actions. Among such rigidities are two that may be pertinent to understanding IPCC actions:
A phenomenon of group thinking – zealotry, loyalty and lack of critical thinking regarding the organisation which is perfect and always correct by definition, making the organisation unable to change and realise its own mistakes and limitations;
Disregard for dissenting opinions, even when such views suit the available data better than the opinion of the majority;
http://en.wikipedia.org/wiki/Bureaucracy#Origin_of_the_concept
I’m having trouble understanding the value or validity of a mean lapse rate if such a parameter is currently used in GCM models. The tropopause (often defined as the altitude at which the troposphere’s temperature decrease with height ceases and becomes isothermal above or starts to rise. The tropopause varies considerably between the Tropics and the Poles with the height over the Tropics about 18km and over the Poles 8km. The lapse rate changes significantly at the latitude of the Polar jetstream which varies considerably from season to season and in the mean from year to year.
Atmospheric processes, particularly convection which is related to vertical stability, are determined by lapse rates. These processes do not vary linearly but change abruptly at certain critical rates which define whether the atmosphere behaves in a stable manner, is conditionally unstable, convectively unstable, or autoconvectively unstable.
I don’t see how any mean Global estimate of lapse rate can describe the movement and vertical depth of H20, the principal GHG, irrespective of the assumed homogeneous distribution of the other more notorious GHGs.
A person can still drown in a river whose mean depth is is 0.3m.
Somebody help me out here.
#343, steven mosher:
– You can’t write firm requirements when the algorithm and the calculational framework are not fixed. When you’re doing exploratory calculations, that’s the case.
– If you do a re-do of the code, you can document it properly. If it’s a re-do, it’s not exploratory.
N.B.: I am using the word “exploratory” not in some DoE/NASA terminology, but to mean that you are trying to generate understanding in an area that is not quite clear. Like stellar evolution, accretion disks around black holes, and GCMs; calculations of heat transfer from buildings probably don’t qualify.
#346, lucia: Hansen’s paper
According to Emmanuel, Hansen’s 1988 talk was received with some skepticism, at least by him and some of his colleagues. He was rather doubtful of the claims, until the evidence started to pile up.
As stated above, I mean “exploratory” in the sense that algorithms and calculational framework are fluid, so firm requirements cannot be written. As the code is modified over time and comes to converge with the physical understanding of the system, you wouldn’t describe the system as in an exploratory mode, because once the code is stable, both the algorithms and the framework are fixed; and if you believe the code represents your best understanding of the physics, you can use it for everything to which it applies.
But that doesn’t mean that all that great documentation is going to write itself, because the code itself wasn’t written to fixed requirements. You can describe the modules as they exist; or you can re-develop the functionality with the reverse-engineering tools, according to requirements derived from the functionality of the exploratory code.
#349, aurbo & #345, Phil: lapse rates
I’m afraid I have absolutely no idea of what you are trying to find out.
Even calculating an average lapse rate, by estimating a single lapse rate as
(Temp(station) – Temp-ocean-avg)/altitude
and averaging globally is going to be sensitive to the real distribution of temperature over the globe, not to mention topographic effects.
Dividing further by latitude to get an “effective lapse rate” just donesn’t make any sense to me.
#342, Steve McIntyre:
You know, I think we should just retire the term “engineering report” from this discussion, because it doesn’t clarify anything.
It sounds like what you want would be:
a) Explanation of the physics behind the stages of the calculation
b) Structural layout of the calculation
c) Explicit statements about simplifying assumptions made
d) Description of the modules
e) Description of the interfaces between modules
f) Statement of parameter values used
Does that sound about right?
Huh? What does having or not having firm requirements have to do with documenting what one actually did. Who asked GISS to write a Functional Design Criteria or an RFP?
Just because you’ve never seen one doesn’t mean they’re not useful.
Re #345
Vostok would likely be an outlier due to the substantial winter time inversions over the antarctic continent.
http://www.antarctica.ac.uk/met/wmc/papers/inv.ijc.abs.html
#354, lucia; #355, Larry:
You folks have demonstrated my point: rather than arguing about documents using special names which seem to mean different things to different people, it would be more useful to state in normal English what it is that one actually wants to see.
If you look along this thread, Steve McIntyre has commented about 3 times that he did not agree with someone’s view of what was meant by an “engineering study “or “engineering-quality” document (and I wasn’t even one of the 3 he was disagreeing with). I infer from this that that term does not have a universally accepted meaning among this audience .
So my proposal is stated in #353:
a) Explanation of the physics behind the stages of the calculation
b) Structural layout of the calculation
c) Explicit statements about simplifying assumptions made
d) Description of the modules
e) Description of the interfaces between modules
f) Statement of parameter values used
Steve McIntyre: Would the information listed above concerning the GCMs satisfy your desire, expressed in the original posting?
#357, cont’d:
b) would include the calculational framework: variables, dimensions, computational architecture, etc.
d) would include the specific algorithms.
Re #352:
Neal
That’s precisely my point. It doesn’t make any sense to me either.
LadyGray says:
January 4th, 2008 at 3:13 pm
In reality engineers only tackle problems where the science is well understood and it is finally time to build something based on it. As has been explained by other people in this thread, there is no obvious role for engineers where climate modeling is concerned because a large portion of the science has still to be fully figured out so, setting aside the question of what engineers would ever be doing building an atmosphere in the first place, it clearly remains in the realm of a scientific rather than an engineering problem.
I have a hard time seeing how a constantly repeated demand for a clear exposition of how a rough guesstimate value often used in a for instance sort of way is arrived at in the context of a highly complex unsolved scientific problem is any different in intellectual terms from a small child constantly saying “are we there yet?” during a long family car trip. Once the science reaches the destination the clear and detailed exposition will most definitely be there. Until it’s available it should be obvious that the long journey to reaching the stage where a clear and detailed explanation is actually possible is still in progress just as a child should probably be able to discern something from the fact that the car is still in motion.
Obtaining an explanation of why the range of possible mean global temperature change values in IPCC reports for what happens when CO2 is doubled is still so wide even at a “very likely” level of stated certainty is probably a lot more important than fixating on exactly how the midpoint of a wide range of predicted possible values was arrived at if people actually want to gauge how far they are from the destination.
“OK, then, Oakland”, said the cabbie as he shoved the meter on.
=======================================
#360 John M, I get your point that use of the term “engineering” could be regarded as overkill, but I still think it is possible Steve has put his finger on a glaring omission – a coherent exposition of greenhouse warming.
E.g. if you just look at the issue of forcing due to spectral properties of CO2, disregarding feedbacks etc, Peter Deitze who was a contributer to the IPCC and a critic of them in http://www.john-daly.com/forcing/moderr.htm says
#362, David Stockwell: IPCC authors?
The people who do the models don’t work for the IPCC. They work for NASA, NOAA, etc. Lumping these people together as “IPCC authors” really sounds like demonization.
So, would you accept my proposal of #357/358 as describing what is needed?
#363 Neal, Yes I agree in part, though I think a way of expressing what is needed is
“a beginning-to-end mechanistic explanation complete with the propagation of errors”
without any reference to phenomenological constraints on CO2 sensitivity such
as paleo data.
The software module information would only be necessary if in fact the software was necessary for derivation of the
figures, which I don’t think it is. Its always possible to develop a simplified physical model that approximates the phenomena.
#364, David Stockwell: Simplified physical model
Based on the discussion so far, the problem could be hacked into three parts:
– The radiative-transfer problem: What does a 2X in C-O2 concentration do to the radiative forcing?
– What does the radiative forcing do to the average global temperature (AGT)?
– Iterate to take into account feedback loops that would affect the radiative-transfer problem.
The first problem is much more tractable than the second & third.
But even the first problem is pretty tough, especially in a mixed H2-O & C-O2 atmosphere: some number crunching will definitely be needed.
The phrase “We don’t know where we’re going, but we’re making good time” comes to mind. I believe the crux of the matter is defined by your “very likely” level of “stated certainty.” It is precisely that “fixation on exactly how the midpoint of a wide range of predicted possible values was arrived at” that will drag the concept of AGW from the politicians’ arena to a place of true science. And once scientific method is truly applied, along with the engineering principles of method and order, then we don’t have to rely on the tenuous application of political statements of certainty. In my humble opinion, we either start doing this right, or we chalk it up as another Tulip Mania.
#357.
My original observation was prompted by the striking visual and procedural differences between climate reports (be they IPCC literature reviews, Nature articles or whatever) and a feasibility study for a mine – an engineering report which may cost millions of dollars and run hundreds of pages. Others have contrasted apparently poor software practices in GCMs to commercial practices, and, while undoubtedly true, I was thinking of something else.
At this point, I’m not sure that I can precisely categorize the differences or say exactly what I think should be included in a comprehensive report. Making specs is never a small job.
The requirements for IPCC are also somewhat unique. In a mine engineering study, you wouldn’t include a treatise explaining the principles of froth flotation, although you would include a detailed flow chart of the proposed circuit. I don’t know know what level of scientific information would be introduced if you were introducing a novel process as opposed to one (froth flotation) that had been used for a century. But it would probably be a lot.
I get the sense that climate scientists feel that explaining the greenhouse effect in an IPCC report is a little like explaining froth flotation in a feasibility study – a waste of time. (Their efforts to explain the greenhouse effect are totally perfunctory, so that whenever they get into FAQ territory, the report veers uneasily between the level of a primary school brochure and a professional literature reviews.)
@Neil–
Your list assumes this is an exposition for a code. I know loads of people on the thread have been focusing on those. But engineering expositions include more than that. They can describe experimental results, calcuations done to design scaled experiments, providing estimates for the expected accuracy, closed form solutions, bounding calcuations for things etc.
I think at the top of this thread Steve asked for an exposition on 2.5C. So, that wasn’t necessarily a question of documenting a GCM (unless then number come from a GCM run.)
So, what I consider an “Engineering Exposition” is more flexible, and can actually have several different names. But, if one were documenting predictions based on a code, you are getting there.
If the document were for predictions based on a code, other things that need to be described are:
1) Sensitivity tests performed. (What happens if you change values of parameters.)
2) Bounding calculations performed.
3) Some literature search to permit users to know range of uncertainties compared to other codes.
On programs, the “exposition” in some way because several documents.
So, for example, with respect to GISS II, used for the Scenario ABC predictions. Had they been documenting fully back in1998, we should have found:
a) A theory manual describing the differential equations used, and qualitative types of approximations in some general terms. (So, start from Navier Stokes. Maybe it’s Reynolds Averaged– say that. Maybe you use something inviscid somewhere. Talk about what types of parameterizations must be used. Turbulent viscoisty? What? )
This document to be flexible, because this code is used by a variety of people. (I think it may have been publicly shared. So, for this reason,the theory manual should have existed. Somebody has to write it– ideally the people who wrote the code and let people run it should have!) This also doesn’t necessarily need to be much different from some of the stuff NCAR had on the Web. (I haven’t found similar stuff for GISS.)
b ) A code manual that discusses some nuts and bolts about the code. (Also, NCAR has some of this stuff available for the community code.)
c) Detailed discussions that support various paragraphs back ground work and modeling decisions specific to Scenarios ABC. Here, one could reference the theory manual and the code manual. But, this document would disucss control runs in detail. The document would elaborate on assumptions made, not make people chase down other papers to find how things were implemented.
It would give extra results, possibly tabulating the GISS predictions for all the years so intersted readers can know them without digitiizing the images. (FWIW Gavin digitized them for me when I asked. So, it’s likely such tables no longer exist.) The document would likely actually state the real temperatures corresponding to the data. (The peer reviewed document doesn’t.)
Imagine something like the 40 page peer reviewed article exploded to 200-400 pages depending on how many sensitivity analysese were performed. Oh, and unlike peer reviewed articles failed runs might be reported, though not necessarily in agonizing detail. For example, if one of the hurdles to over come is adjusting things so the oceans don’t freeze, work to overcome that difficulty would be discussed.
That way, researchers who wanted to learn what not to do would learn what doesn’t work!
It would, in many ways, be what you might expect, if that paper had been a dissertation topic instead of just the peer paper written based on the dissertation topic. All the stuff the committe needs to read to assess the completeness of this particular work would be included. (But, sometimes, even things a student might not put in a thesis get in!)
As it happens, I wouldn’t be astonished by lapses. Code theory manuals tend to be two years out of date on any project– but that’s still different from never written. The longest exposition will always miss thigns.
But, in the case of GISS, the only thing that seems to exist are the peer reviewed articles.
Universities are generally cut slack on these documents — and that holds true for both engineering and science. But the reason for this is that students eventually write theses, which often serve quite well. The faculty member often wants a lot of detail recorded for a variety of reasons including getting the next graduate student up to speed, citing fuller documentation in a peer reviewed article, or just having information easily available to compile future articles after a graduate student leaves campus.
Sometimes laboratories give these a quick brushover, add or subtract a few things and re-issue the thesis as a lab report (with the student as the author, of course!) We did that with some work we had done at Washington State University.
Were it ever so humble, there is no place like truth.
===================================================
@LadyGray–
Engineers work on stuff where the science isn’t settled quite often. Look up some of the safety stuff for solving the issues of resolving the safety hazards in 101-SY. Let me assure you, the science is not settled on using CFD to compute flow of non-newtonian concentrated mixtures of solids and liquids. All sorts of science wasn’t settled.
Huge numbers of bounding calculations, sensitivity studies and experiments to span all sorts of possibilities were done before anyone put a pump in that tank to stop those potentially explosive hydrogen burps. DOE would never have moved forward with out expositions of these sorts, some on idea much more tenuous than the 2.5C.
The goal of these expositions is to describe the basis of recommendations, finding or predictions you are supplying to others. Even if a basis is tenous, it can still be described and documented. It’s just a matter of describing the assumptions, doing the problem and writing it up in a formal way that can be cited.
DOE labs could (and have been know to ) collect together historic documents that were once nothing more than internal memos (the 70s equivalent of widely circulated emails) place a cover and publish these as supporting information. The did it for 101-SY and the whole hydrogen safety program. It’s the only way to distribute information in a concrete way that permits people to know where the information came from.
Even expositions showing tenuous support for a number are better than no exposition. When cited, they serve to show that the numbers have tenuous support.
With respect to the 2.5C, or 33 K or whatever the heat flux number for CO2 is supposed to be, we have the situation where some are saying no expositions are required because the value is welll agreed by everyone and obvious, and so well accepted that to doubt them . Simultaneously, we have people saying the exact same expositions are so tenous that there is no point writing them up.
So, which is it? The fact is, tenuous or nailed down, it’s always possible to document important numbers that are widely used and cited.
361,
You’ve obviously never been around a specialty organic chemicals plant. As far as that goes, lots of processes, from winemaking to sewage treatment are as much alchemy as chemistry.
Neal J. King wrote in 338:
The models are explanatory?
Chapter 2 of the Working Group I report discusses the derivation of the forcing “Aerosol – Cloud Albedo effect”. Figure 2.14 ( see here: http://www.ipcc.ch/pdf/assessment-report/ar4/wg1/ar4-wg1-chapter2.pdf page 177) shows the outputs of 28 model runs. The text says the values for Cloud Albedo effect in these model runs ranges from -.22 to -1.85 W/m-2.
-.22 to -1.85 W/m-2
Now, which of those models would you say correctly “explains” the “Aerosol – Cloud Albedo effect”?
I suppose one could argue that the models have explained that this particular effect is a negative forcing, since all of the values are negative. But then you are dealing with an explanation that ranges from a value that is virtually trivial to a value large enough to completely negate the effect of CO2.
Furthermore, how do we know that ANY of these models is correctly explaining the Aerosol – Cloud Albedo effect?
#289 Steve Mc’s comment to me
“Puh-leeze” is not an appropriate response.
You have asked for an exposition specifically of how 2.5C warming arises when the science is not settled on a particular number anyway. A detailed engineering document of each of the components of the model will not expose the answer to that question, because the answer is the output of a complex coupling between the components. A detailed document of a full earth system model will only expose the answer obtained for that earth system model and no other.
So I’m not trying to address your particular question, I’m trying to look at improvements in documentation. And I’m most definitely not saying that the documentation is fine – I’ve already stated I’m involved in projects trying to improve methodologies and documentation.
#357 Neal
When I’ve had my way (hopefully before I retire in 2020+, each module will have its inputs and outputs described in formal metadata, its purpose would remain a scientific explanation I guess. The coupled model would also fully describe the interactions between components such that you could automate the control code. The outputs of each simulation will be archived along with the full description of the components, the parameter settings, the input data, the coupling configuration, the machine architecture, the compiler version and the compiler options. If the result of a 2xCO2 experiment were a 2.5C warming, would this meet Steve Mc’s needs? From what Steve has said I don’t think it would.
#298 steven mosher
Thank you for your more considered response 🙂
I think the documentation of “my” model compares well with the MIT links in #316 and #317. There are also audited standards where I work, but the life-cycle is different to strictly engineering projects, partly due to the differing roles of the scientists and engineers.
Historically, climate models were developed somewhat monolithically by scientist-cum-engineers, and many of the components are hard to unit test. So we’re starting from a difficult base. Having previewed modelE I’d like to think the model I work with (which is about 10 times bigger) is of infinitely higher coding standard (but it’s still not great), so I hope you don’t see it as a typical example.
A rough summary of process as of now are as follows:
The “unit tests” are mainly the responsibility of the developers of the component, the “test harness” they use is the rest of the model (run in a range of configurations) and the “test criteria” are that the science of the whole model as judged by an agreed set of partially subjective and partially objective criteria, is “good”. 98% of the time, the system design is not changed by the scientist – the scientist is tweaking code within a component that is substantially written within the design guidelines.
At the integration stage a change is expected to produce bit-identical results when run in a configuration in which the change is logically excluded. The change, when switched on, is validated by a separate set of climate scientists, and if the change impacts on the weather forecast model it is validated by them too.
The difference as I see it is that the unit tests tell you less than you’d like because components are, necessarily, coupled strongly together. So a component which passes all the unit tests will likely fail in some respects in the integration test, and the fault may lie with the component, with another component, or due to some interaction between two components. This means there is a lot more focus on the full model and less (but not none) on the component models.
So while there is a strict procedure for code being committed to use in a model configuration, it tends not to kick in until the scientists are largely happy that the code they’ve written, and it tends to focus on technical rather than scientific validation.
Ironically, as the engineering standards have improved (and have got much better than I’ve seen elsewhere – I’ve not seen MIT), the model developed by my colleagues has slipped back in the world rankings of what is considered a good scientific model.
# 301 lucia
I agree with all you say. If turnover of scientists was high, the model would go downhill very quickly. Fortunately, turnover is not high and there is good succession planning. Documentation does exist, but for reasons stated in my previous post, it’s probably not up to standard and I’m not sure it would help even if it were.
Michael,
I completely agree. The most the models can do is partially explain the level of our misunderstanding. But this tells us where we need to look for better observations, so they have some value. The models will never have any predictive value.
371, You can have two situations where an operating technology is used:
Situation 1: the theory is understood, and the empirical data agree.
Situation 2: the theory is unsettled, but the base of empirical data is good enough to develop a working technology from.
The third possibility rarely, if ever, exists, where the theory is well developed, but the empirical results don’t jive. If that’s where you are, nobody in their right mind would commercialize the technology. If they thought it was promising, they’d demand that they do more R&D until the empirical results finally do jive with the theory. Either that, or they’d chose to live with situation 2. And that’s about where AGW is.
Michael,
I probably should explain my thought. Richard Lindzen did some work with computer models. It is my understanding this experience caused him to come up with his “infrared iris effect” hypothesis. Roy Spencer later observed a negative feedback over the tropics which he identified as confirming Lindzen’s infrared iris effect. I think the model played a valuable role in this discovery.
Ron,
I understand the models have value. They are tools, and like any tool, can be both used and misused.
#367, LadyGray: level of certainty
The state of the science is that nobody has a GCM that is vast enough to encompass every aspect of global climate, in 3-dimensions. Undoubtedly, more and more aspects will be covered in more sophisticated models, and to greater accuracy; but they’ve been working on it for decades; and I imagine they’ll continue for decades. It’s literally the biggest problem in the world.
In place of that, there are a lot of GCMs that emphasize some aspects of the problem while neglecting or minimizing others. Naturally, GCMs that focus on different aspects will give different results. A vital part of the study of GCMs has to be to understand which of the GCMs is most credible on which aspects, and generally how their results should compare.
For that reason, until we have one or more all-encompassing GCM model, one’s certainty will never be 100% on all aspects; and judgment & experience must be applied. However, if a specific result is supported by all or nearly all of the GCMs, there are certainly excellent grounds for believing that it is true.
re 289
Steve Milesworthy writes:
There is nothing in this list that does not correspond to typical engineering practice. Take the Space Shuttle as an example. What factor of the list does not apply. As a matter of course, there are engineering documents created for it, its missions with numerous contingencies and its proposed modifications to overcome unforeseen deficiencies. I saw a paper in the Requirements Engineering 99 conference that detailed the use of Parnas tables to specify the West Africa emergency abort software for the shuttle. This was a massive undertaking and was for only one contingency.
Take the Hubble Telescope as an example. Perhaps a solid engineering document would have helped with that fiasco.
Whether or not documentation ‘would help’ depends on one’s goal.
It might not make help climate scientists develop more accurate models; it would likely help outsiders better understand the levels of uncertainty, or compare the parameterized models in other fields.
Steve Milesworthy says:
I find this comment interesting – what are these rankings and how are they compiled?
#357, Steve McIntyre: froth flotation
Well, the IPCC’s report is supposed to be a report, not a textbook. The tension you notice between the school-level explanations and the sometimes esoteric citations of the literature is probably difficult to avoid, particularly because a good explanation of the GHE is rather complicated, as we’ve been seeing.
In many fields in physics, it is also the case that knowledge in the field is not well explained in textbooks for years.
As a humorous aside, I recall reading the introduction to a book on quantum field theory (probably), which admitted some embarrassment on this point: “There is a certain level of unevenness in the presentation of the mathematics needed for this exposition: We will have to discuss quite sophisticated tools that were developed in contexts of mathematical maturity that some physics students may lack. The reader may occasionally get the impression that he is reading something like this: ‘We will have to introduce the concept of Hilbert spaces. First, note the letter ‘H’ that you will be familiar with from your early education.’ “
As a non-climatologist, I don’t ask that the engineering style report be written so that I understand the thing. I only ask that it be (1) correct and (2) complete so that if I wanted to invest the necessary time to understand it, I could. Is that so much to ask?
Back to the dead horse. Annan said. ” … (from which we also get the canonical estimate of the greenhouse effect as 33C at the surface).”
He should have said, “from which we also get the canonical estimate of everything we left out of the equation.” In this case everything left out of the equation means basically everything. It certainly means everything related to all actual real-world physical phenomena and processes, both those that are significant and those that are less so. None of the assumptions that would be necessary to omit the terms could be justified. The equation contains also an empirical quantity that appears out of thin blue air, you might say.
The word ‘canonical’ btw does not correctly apply in this situation.
#369, lucia: What constitutes good documentation
The problem with developing good documentation is that it takes loads of time to create, as well as to read & understand; and for the really esoteric stuff, only a few dozen people are professionally interested. So the approach I have seen in university settings is to educate the new students by giving them the journal articles, and letting them work through the papers, asking questions of their research adviser to clarify their understanding. There are also seminars and journal clubs. The idea is to communicate the understanding to the next generation as quickly as possible. Little thought is given to writing real explanation, unless one has to write a review article or book. Active researchers usually prefer to make new progress rather than to slow down for that.
And, yes, that 2.5-deg C figure most certainly comes from running GCMs. Not from just one run, but from calculating distributions of results from many runs, and on several GCMs, and with varying assumptions.
Re 361, 372, what engineers do
“Engineering is the art of doing something for a dollar that any damn fool can do for two” — the Ancient Engineer speaks.
Engineers as a class learn by failing, as is very nicely outlined by Henry Petroski in To Engineer is Human: The Role of Failure in Successful Design (1985). The OP should read this to get a better idea of what engineering is all about. Petroski is a clear and engaging writer, so you’ll have fun, too.
More on Petroski: http://en.wikipedia.org/wiki/Henry_Petroski
Happy reading–
Pete Tillman
And the problem with poor documentation is that …
You can’t win this argument based on a cost analysis. The benefits far outweigh the costs.
#371, lucia: No exposition required?
Nobody is saying that.
I think the point of distinction is that some of are saying that it is not extraordinary at all that a complex problem being explored through searching for a range of algorithms and physical approaches would have evolved into a situation in which many of the basic aspects of the problem are well-understood, even though the documentation is not very helpful.
#391, Michael Smith: What is explanatory?
Many of the aspects of the problem are well-understood. I believe that the “2X => 3.7 W/m^2” fits into that category, for example. So the part of the model that relates to that would be considered explanatory.
The issue of cloud-cover & albedo is a known area where a lot more understanding is needed. No one would claim that that issue is closed: It is explicitly called out in the IPCC reports, and additional work beyond coding will be needed to fill it.
These people arguing against documentation remind me of myself about 20 years ago. After enough phone calls at 3 a.m., most of which required me to get up and drive for an hour, I started to see the light.
@ Neil 387
The same is done to graduate students in engineering. We also write dissertations when defending our thesis that elaborate rather more than do peer review articles. Furture graduate students, faculty members and those on the dssertation committe find these more elaborate documents helpful.
Is this not done in your field? Or, when students are asked questions, do they answer “No exposition required”.
I believe I discussed what makes adequate documentation, including why theses and dissertations are generally considered adequate as engineering expositions for certain classes of investigations.
It is interesting to read you say the 2.5C does specifically come from GCMs, while Annan appears to give another provenance. Knowing the provenance of numbers are useful. If it’s confirmed by many GCM’s that’s useful to know and document formally. A simple compilation of which might help too.
Neil
So, tell SteveM where this information is and compiled and documented, and he’ll have his answer. Do it quick and he’ll have the anwer in less than 400 comments!
#386, Dan Hughes: Dead horse
“canonical” was the wrong word. I’m sure he means something more like “usual” or “often-cited”.
Scientists are often less precise about words than would be desirable.
#389, bender:
No one is advocating bad documentation.
Getting money to do something is like, well, getting somebody to give you money. It’s hard.
Haven’t you noticed a few things around the world that would be cost-effective to do, that don’t get done?
#393, 394: lucia
– When the Free-Electron Laser code was turned over to me, I got a printout and a half-hour discussion with the previous guy, who was heading out the door. He was really proud of having cleaned up the code, which had already passed through the hands of two generations of grad students before him. To give you an idea of the state of the code: In the main program, there was a global variable g that was set to 3 at line 20; and re-set to 5 at line 25. It was not at all clear what was going on between.
When people talk about the physics, they talk about the physics, not about the code. The code becomes an issue only if the results don’t match the measurements, or if someone thinks the results are inconsistent in some way. And, as stated before, they’d much rather explain it at the blackboard or over a cup of coffee than by writing it all out in review-article format. If one can’t pick it that way, frankly, one has no business trying to be a grad student in the field: one is not properly equipped.
– In the OP, Amman is quoted as saying:
I think that documents my claim that the 2.5 comes from comparison among different GCMs.
#396 NJK
What I’ve noticed is a lot of policy makers saying “the science is settled”. Stop the science. Start the mitigation. Shift the budgets around.
#395 Annan is a mathematician. All mathies abhorr ambiguity. I’m sure he chose the word ‘canonical’ rather deliberately, in the sense of “foundational” or “fundamental” or “basic” or “elemental”.
#398, bender:
Fine by me.
Since prevention is cheaper than cure, the first move is to get off C-O2-producing power technologies.
#399, bender:
Annan’s writing style doesn’t look that careful to me. In any event, “canonical” in mathematical contexts usually means defining a specific form, like the canonical form of Hamilton’s equations: I’ve never heard the term applied to an argument or line of reasoning, however fundamental. See also:
http://en.wikipedia.org/wiki/Canonical
canonical: reduced to the simplest and most significant form possible without loss of generality
Like I said …
That’s a typical statement from someone who doesn’t understand economics. If the payback is there, and the risk is acceptable, the money appears, as sure as the moon comes up. In the public sector, we have the opposite problem; money being spent when it isn’t justified by the fundamentals.
Prove it. On unthreaded, NOT here.
@Neil– You think the quote from the tail end of Anan’s email shows the 2.5 C clearly comes from GCMs? Did you read all the stuff before that? The references to empirical results? The simple zero order model?
And if it came from GCMs, sensitivity studies and represents some sort of average result, which computations were used to estimate this avearge? How do we know that if someone really sifted through all the best codes the number isn’t 1C? or 4C or 12C? We are discussing provenance and documentation here.
No, the tail end of Annan’s email doesn’t document the precise basis for that number.
Hey, I realize documenting stuff is expensive. It’s tedious. No one likes it. But, under the circumstances, if Annan’s email is the most thorough documentation available for 2.5C, that is truly bad!
BTW, as you progress in your studies, you’ll generally find widely accepted numbers are documented in papers that can be cited and are traceable to their root. The precise person who came up with that number will be known. Don’t risk giving your thesis to a committee without citing the provenance. They may accept it– or they may not. Will you want to risk redefending?
Granted, in climate science the 2.5C may now have achieved iconic status and you’ll find it cited. But, in principle, one should be able to trace this to its root. Evidently, neither Jerry North or James Annan can.
@Larry–
On Neil’s economic lectures: I don’t know why Neil seems intent on telling me documentation costs a lot and is time consuming for scientists. I told you that long ago. You’re the one who thinks this can be done efficiently.
I think the activity is expensive does cut into the science.
It’s still valuable and necessary if the work is to drive policy.
If one grad student the rather typical passing of a a grad-student code to another grad student as Neil just did, well, yes, that happens. I don’t think that’s a big problem. First, presumably, Arthur’s advisor has some clue about the code. Second, that’s what happens at universities, and for this reason, universities do certain chuncks of work and not others. I discussed that with Arthur way back.
But, at universities, at least rather extensive theses are generally written discussing stuff. If not, Neil’s advisor may have a long term problem getting grad students up to speed.
Still, whatever happens, the grad-student project involving almost single use codes isn’t the same as a large project involving one set of people writing and maintaining code and other people doing the actual physics and interpreting results. More documentation is required in when things get split that way.
#404, lucia: Yep, that’s my reading of it
It seems to me he’s saying they have compared the results of perturbing the models with incidents that could be compared with real-world events, like eruptions, and this gives them enough of an idea of how the models behave that they can get a range of values (2 – 3.5); the only question is why they chose 2.5, instead of 2.3 or 2.7, as their representative value.
@Neil– I read the first bits Annan mentioned as the primary method of getting the values. (Interestingly, the first bit Annan mentioned matched North’s explanations of provenance.) I read the tail end GCM portion as “Oh, and this seems to match GCM’s too”. But, hey. 🙂
It might be nice if we knew why 2.5 instead of 2.3 or 2.7? And it might be nice if the sensitivity studies were cited, huh? Or if it were clearer.
After all, whether brilliant or stupid, the entire world can’t sit down for a cup of coffee with several climate scientists, asking for tutorials at blackboards, can they?
How would you feel if those designing Nuclear reactors just wrote the provenance for two-phase flow equations on a black board and cited no one?
Lucia, I never said documentation was cheap. I just said that there are people who do this for a living, and it makes no more sense for scientists to be taking the task on completely by themselves that it does for a lawyer to be doing paralegal work. Analogously, scientists can throw together spreadsheets, but for a significant task such as a GCM, a software engineer should be working with the scientist, not only for efficiency, but for QC reasons. And yes, I realize that code monkeys can be difficult to work with.
#407, lucia:
– I don’t see how you come to that conclusion: Amman says all over that it’s a hand-wave. He doesn’t even cite any specific numbers until he gets to the GCM area.
– You know, these guys didn’t sign up to design nuclear reactors, they signed up to be scientists and find stuff out. This is their best opinion about what the big picture from the models seems to be. It is not their fault that global warming seems to be coming out of this.
– Just to forestall further misunderstandings: I hereby propose to hang by the neck anyone who is against better documentation. OK? Now, who is it that you guys claim is against documentation/explanation etc.?
Neil–
You seem to suggest every possible reason why document should not be have been written and need not to even be required now.
I’ve said all along the people don’t want to write this stuff. Heck, I didn’t like writing some of this stuff at Hanford. No Ph.D. likes writing this stuff!
But given the stated motivations for governmental funding since, it’s a programmatic failure that it wasn’t required. Better documentations should have been forced on climate scientists. The funding has been driven by the need to guide policy since at least 1990, and based on someone else’s post, cries for policy action were well under way since 1985.
I know the 1990 date and the motivation for the programs because, my husband worked on climate change programs for 17 years. But, he worked mostly on DOE’s ARM program getting instruments to work in the field.
By the 1990’s these weren’t just science for the sake of science programs. People do draw salaries paid by tax payers, and the agencies justified the funding go guide policy.
BTW, Jim got got stuck on an icebreaker when the landing strip of the supposedly un-meltable ice melted– see Sheba issue.
Larry says:
This approach would likely produce good but useless software. GCMs are R&D projects where the requirements change as the scientist reviews the outputs. It would be impossible to manage development of such a project unless the developers were also climate scientists. I think it would make more sense to train the climate scientists to write good code and have their code regularily reviewed by outside experts who may not to know the science but can ensure code quality.
#410, lucia:
I’ve been giving what I view as a very plausible explanation of why GCMs are not driven by good documentation procedures. I have also pointed out that going back to do a thorough redocumentation costs money that will compete with actual scientific progress, and thus someone has to make a budget decision on the relative priorities. I have not been advocating bad documentation procedures, and I’m getting a little tired of your claim that I have been.
If your husband worked on this stuff, why don’t you go ask him why they didn’t do things right, and tell us about it. Or ask him to ask his colleagues.
411 Raven
It might be best for the scientists to write flow charts and let professional programmers write the code from that. The act of preparing flow-charts would be good discipline if they are not doing them already (and they may not).
411, now we’re back to the old argument that the scientist’s time is too valuable. And besides, you can’t teach old dogs new tricks. Quality is a culture. If you don’t internalize it, it’ll never happen. It’s always easier to rationalize that you only need a little patch here, and let’s name that variable “fido”, because I’m thinking of my dog.
Software is a non-trivial task. It’s not for dilettantes.
413, I’ve seen that work well, too. And that aids the overall documentation effort.
Larry-
Oh, I’m not so focused on the code-qua-code issues. I know others are. (But I repeat myself). Banging out code is best done by separating tasks.
I’m more focused on documentation of what sensitivity tests were run, and what parameterizations were sued, what bounding calculations were done etc. Also, more exampive documents include some key information presented in a way that doesn’t send interested readers running for an endless train of references.
I know Neil points out that running for references is a normal part of research. It is, we do expect researches to pull up endless journal articles references when doing their own own research. So, for them it’s ok to get one paper, circle 6 papers that might contain theory, order them. Circle 6 on each of them, and so on until they find what they need. We expect grad students to do it.
But re-peating the research is not a normal process of reviewing research , or communicating the results to the public.
416, That’s the genius of the IPCC. They write the SPM, because they know the policy makers won’t read and scrutinize the research. The body of the report becomes irrelevant to all but a small circle of auditors. Because of that, the wonks take the SPM at face value. It’s called how to achieve closure.
Larry says:
You can teach grad students who have choosen to specialize in climate modelling or you could hire developers with natural science degrees and train them on climate science. My point is the person developing the code has to understand the topic – without that understanding you will get garbage.
Pat Keating says:
Defining requirments for software modules requires a lot more than a few flow charts. However, writing a formal requirements document would provide some of the documentation trails that are needed. On the other hand, writing a good requirements document takes time and implies that you know what the requirements are. I am not convinced the developers of these GCMs know what they need until they build something and see the output.
Neil–
I said these things were not written for innocent reasons back in 303My husband now works on Homeland Security. Jim worked collecting data for the ARM project. ARM data are extensively document and available as they are collected for general use.
Jim has nothing to do with the GCM’s, NASA, the IPCC did not over see them, and did not manage any such work. Obviously, he can’t just go tell modelers or agencies how to document any more than you can tell another grad student or faculty member how to run his test rig.
I’ve said many times: the lack of documentation is a programmatic flaw.
My only point is: These programs were not exploratory as far back as 1990. At that point, better documentation should have been required. If you agree not transitioning to better documentation was a programmatic lapse, then we basically agree.
I don’t consider it the fault of individual scientists.
#418, raven: I agree with your view on scientific software development. Even when you know the science, you can be hung up on developing the code. If you don’t know the science, you’re likely to go over the deep end without noticing it.
#419, lucia: OK, they should have done better documentation. It looks like Steve Milesworthy is chartered to do that, at least for the GCM project he’s working on.
Oh, Neal, knock it off. As soon as the scientists started trying to promote their stuff at the level of global policy in glossy pamphlets they took on new responsiblity that required added due diligence. You can’t have it both ways. If you’re getting bigtime grant money to address policy, you’re doing so with the understanding that full accountability is going to be required.
Re: past CO2 levels and ice ages. Be careful about inferences about past climates relative to CO2 forcing. The last few million years we have had ice ages because of the confluence of 3 things: the south pole has a big land mass right there, the arctic ocean is almost land locked, and the isthmus of Panama got closed (which caused massive extinction in S. America), resulting in a change in ocean currents. So you cant simply look at these historical charts and conclude anything per se.
418 Raven
No question, but an informal communication of the requirements is probably all that is needed for those cases where the software is in a fluid state, as it is in research. (They are not writing airline flight-control software, after all). As the models become more settled, the requirements document should progress from a back of the envelope to a full formal document.
As far as I’m aware, only Steve Mc is fixed on 2.5C. Every model has a different range of answers, every observationally based assessment has a different range, every palaeo study has a different range. It’s one of the headline unanswered questions of climate science.
A lot of documentation does exist and is publicly available – I just don’t know how well it fulfils “engineering standards”.
Models live and die by their results. As with nuclear reactors and bridges, failures are evident. Unlike nuclear reactors and bridges, every model is a prototype, and partial failures are expected.
Due diligence does exist because the models are used and scrutinised by many independent scientists. The biggest scrutineers where I am are the forecasters – the model has to continue to produce better forecasts.
#421 bender: if the policy makers want better documentation they will pay for it. But they tend only to pay for science and not for infrastructure. So don’t moan at (all) the scientists. The documentation (for my employee’s model) is publicly available and people are free to view it and submit comments on it.
There has never been a climate model that did a forecast and probably will never be .
Like Trenberth himself said , what the models do is to analyse sensibilities but they don’t forecast the state of the system for a given area and a given time .
As they are not initialised and can’t be , they can of course make no forecasts .
All the models currently used rely on one unproven hypothesis that any bias that they might have , will cancel out in the projection .
In other words if a run for the current state of the system which is not to be confused with real initial conditions of the system is wrong , then a run for the state of the system with some variables changed (typically CO2 concentration) will also be wrong .
But the difference between the 2 runs will be more significant because the bias is supposed to be identical for both runs .
That is also the reason (already largely debated here in other threads) why the GCMs do NOT solve differential equations given by the natural laws with realistic initial and boundary conditions .
The best “forecasts” that can be expected of that approach are along the line : “The 2070 – 2099 average of the global parameter X could vary by delta compared to its 1970 – 1999 average .”
As for the regional projections , they are notoriously unskilled and the differences between models often don’t even agree on the sign of variation .
Climate modeling is the first and only area of science where it is allowed to spend time and money without proposing a prediction and comparing it to realisation .
Even the argument of needing to do multidecadal means doesn’t bring much – afaik there is no prediction of the 2000 – 2020 average precipitation , cloud cover and temperature at least at a continent level .
Raven, their is no reason why the code guy has to know climate science. All he needs are clear requirements from the scientist. If the scientist is doesn’t know enough to write clear requirements, then he doesn’t know enough to start coding in the first place.
Basically, if you don’t know something well enough to explain it to someone else, then you don’t really know it.
If the scientist doesn’t know what he wants well enough to write a requirement, then he needs to do some more experiments until he does.
#426 Tom
I agree with much of what you say regarding climate forecasting, but largely the same code developed by the same people using the same methodologies is used in both the climate and short-range forecast model here. There are obviously important differences in deployment of the respective configurations, but the point is that whatever the strength of the documentation, the result is fit for at least one of its purposes.
#424. Steve Mi, on the proxy side, I’ve been more critical of the inept administration by NSF in failing to require authors to archive. In that case, it’s nothing to do with cost; it’s scientists not complying with policies and NSF being flaccid or coopted.
What would be the result I all of the Paleo information that was not documented and reproduceable by independent means (using basic scientific criteria) were to be removed from the madels?
What would you have left?
Only colossal failures are evident. Most aren’t. That’s the whole point. The fact that the result isn’t absurd doesn’t validate the model.
427 MarkW says:
You are describing a classic waterful development process that is useful for developing systems that have a clearly defined endpoint where the system is deployed and used such as an airline reservation system. GCMs are elaborate prototypes which are constantly evolving as science changes. This type of system requires an iterative process where the requirements evolve as the software is developed. Iterative development only works well when the programmers have some knowledge of the topic at hand. That said, a large project does not require that every programmer be knowledgeable on climate science – one or two who design the architecture and provide daily technical oversight to the others would be sufficient.
That statement is simply wrong. The code that is written for instruments in airplanes (both large and small) is written by programmers who are not pilots or airplane mechanics. If you are talking about programming that is outsourced to people who can barely understand the language the researchers are speaking, then that might be true. But if you have a competent programmer who has a good basic understanding of technical English, and the researcher has a good basic understanding of what they’re doing, you will get a good program. Granted, that is a lot of caveats (competent, basic understanding, etc.). Programming is based on logic, not knowledge.
433, not only that, but while models tend to be computationally intensive, they’re not extremely algorithmically complex. Just lots and lots of nested loops. In fact, I dare say that if a good C++ programmer was given the flowcharts to Hansen’s 10,000 line Fortran ratsnest, it could probably be reduced to under 1000 lines of C++, maybe under 100.
The science is settled, yet the science changes. That makes my brain hurt.
You don’t count the number of lines to calculate the size of a C++ program. You go with the size of the compiled file. A C++ program could all be written on a single line. It is only written on separate lines to improve readability.
Also, this would only work if the good C++ programmer was also a good Fortran programmer.
However, there is really nothing wrong with the program having been written in Fortran. It is a very good scientific programming language. C++ adds nothing of substantial value over Fortran. The young kids coming out of college and trade schools are indoctrinated in using C++, but that tends to be the only language they can program in anyway. The older programmers are usually fluent in several dozen languages, and can easily adapt to the other hundred or so that are out there.
436, the goto was obsolete in 1960. Fortran is a bad language, period. And the size of the object file is irrelevant. The size and structure of the source program determines its readability and maintainability (and thus its auditibility). The source is important, the object doesn’t mean squat.
Steve Milesworthy @424–
First: if that’s not your agency’s number, the simple answer to not your agency not having a an exposition for that number is that’s not your number. If someone asks whose number it is, and no-one else has documented it, the simple answer is “I don’t know.”
If you did want to document it, a far as I can tell, what I would consider an engineering exposition of the 2.5C (or a range like the IPCC’s ‘1.5 to 4.5 deg C for a doubling of CO2’) would consists of a 5-20 pages chapter in a document.
As I tried to convey before, what I consider Engineering Expositions, cover a wide range. Lots of other people are focusing on documenting code. I haven’t been, because I never wrote codes like TEMPEST or COBRA when working at PNNL. I often did paper and pen bounding calculations and documented those.
What precisely is included in an engineering exposition varies depending on how a particular result is found. Sometimes they are long; sometimes they are short.
The main aspects are:
a) the expositions are not limited to presenting novel findings or truly original work, though they sometimes do present novel findings. That’s why a policy of documenting in peer reviewed articles only doesn’t work.
b) the expositions always cite to underlying documents even if they re-iterate,
c) you don’t have to re-prove all those documents. (So, if 2.5 C comes from a code run from a research model that was not validated and verified that’s ok. That is done all the time on safety projects. You just cite.)
d) the expositions are written so people with scientific background but in neighboring specialties can understand them relatively quickly. (So, for example, you might write for an audience who has taken heat transfer, fluid mechanics, thermodynamics, but isn’t actively engaged in climate science 40-60 hours a week. ),
e) the document is published formally. This could be a formal NASA / ORNL / PNNL /ANL report given a number and available from the lab.
Is this sounding like a MS thesis? Senior project? Chapter in a Ph.D. thesis? Nice summer project for a student intern? BINGO!
For example: if the 2.5C needs to be documented for some reason, and it’s a result from many, many GCMs runs, then you might collect together a list of references reporting values, show all the values they got in a table, and show the average is 2.5C. (You could discuss the range and why it varies from GCM to GCM, or leave that to the reader, citing traceable references. That depends on the scope.)
If 2.5 C really from the simple radiation balance, you’d show that, with formal numbers and illustrating assumptions.
It sounds like, you Steve, are putting together documentation (for NASA?). So, I guess you’ll want to ask yourself if this is a document you need to have written and published.
If 2.5C (or 1.5C – 4.5C) is highlighted in your agency’s policy reports or pamphlets for the publish or media, it might be useful from someone to put together a document showing the provenance. After all, an agency should be able to give background on this range if they are the perceived authority.
Otherwise, if the authority can’t point to some document somewhere, it looks a bit like the provenance is circular and goes like this:
“Sometime during the mid-80s IPCC sat our scientists around a big table one day and asked our scientists the range. The scientists didn’t do any formal literature search or tabulation that day, but said they thought it was about 2.5C. Then, IPCC formalized the number. And now, when our scientists cite the number is 2.5C, we all just cite the IPCC. The IPCC periocially collects us all back together, and we still all think it’a bout 2.5C.”
The number could well be right. But if the magnitude of the sensitivity matters, a 5-20 page document demonstrating the basis might be useful.
#433, LadyGray:
Scientific programming can depend vitally on both subject-matter knowledge and logic.
Imagine that I am trying to model a complex shock wave. I fiddle with some parameters, then the “shock” dies. I fiddle with them again, change the time increment, but the output becomes chaotic. I realize that I have to modify the spatial increment to match the time increment, so I have to change the lattice of points I’m doing the calculation on…
All of this could easily go on in one day, plus more. The decision I make to try the next approach will depend upon my knowledge of the physics of the shock, my insights into numerical analysis, in addition to my knowledge of programming.
If I had to write requirements for another programmer, it would be very frustrating for both of us. I would be writing him lots of “try this value; oh that didn’t work, try that value”; “that wasn’t the part of the shock I wanted to look at, could you run it again showing this other region”; with occasional “double the dimensions on the matrices, and change the equation to this”.
Sometimes I would want turn-around in minutes, and other times not for hours. Basically, I would need a programming slave at my beck & call, and both of us would still be frustrated. Additionally, there is the danger that, due to reluctance to over-burden the interaction, I lose sensitivity to how the behavior of the program responds to small parameter changes; or I’ll miss an unexpected pattern. Sometimes you find out that way that you had overlooked a subtlety, and actually need to re-think the physics. If I keep my hands too clean, I won’t be exposed to these clues – and a pure programmer will not be able to spot them.
Now, this approach could be hybridized to avoid a dual murder/suicide situation: I could go off and do my own thing, and occasionally turn over a well-defined “chunk” of the program that seemed to be behaving properly and not getting into trouble with anything else: a kind of mini-module. The programmer could work on integrating that into the larger calculation, while I worked on another aspect of the calculation.
Maybe that would work.
#435, lucia: Aspirin
What is considered settled are aspects that consistently show up across the range of GCMs and reasonable input parameters: e.g., additional carbon-dioxide does create a radiative forcing, and does enhance the greenhouse effect.
Certainly, there are aspects that are open: e.g., how clouds affect the picture, and exactly how much difference this makes.
Analogously: To take an even much-less-settled situation: We don’t have a complete theory of particle physics; but we can be pretty sure that whatever we end up with will uphold conservation of energy, as well as of other additive quantum numbers.
Having followed the above with interest, although, as LadyGray, 10:09, 7th Jan, says, sometimes it makes my head hurt. But one thing that has been mentioned in various places, but never seriously addressed, is to do with feedbacks and their relevance to the much sought-after 2.5 degrees C temperature rise explanation.
The rise that has been documented so far, and I’ll ignore all uncertainties and potential errors at this point, is generally reckoned to be about 0.6 degrees C. But this has happened in the real world, so it has to be assumed that any and all feedback processes are already in play. It is hard to imagine any way that a new process can come out of the woodwork just because of some particular increase in the global average temperature. So the 0.6 has happened while going from 280 ppm to 385 ppm. To move on up to 560 ppm, given an exponentially decreasing slope, is not likely to exceed 1 to 1.2 degrees C. Rough and ready numbers, I know, but, hey, this is climate science (sarcasm button off).
But, as I said above, this will still include all of the feedbacks, negative or positive. And given that we are talking about a change from 288 K to 289 K, this is not a large percentage increment, so none of the feedback effects are going to change substantially in magnitude or sign. So, where’s the 2.5 C leap?
I hope this isn’t too far off-thread, SteveM.
Lady Grey says:
That is an extreme example of the problem that I am talking about. However, many outsourced software projects have failed even though the programmers speak good english because the programmers do not understand what the software is supposed to accomplish.
Such a programmer requires detailed daily supervision and I suspect most climate scientists are not interested in micromanaging someone – especially if the person needs to have derivatives and intergrals explained to them. If you want an efficient and effective project you need a programmer who understands the science.
I never said the science is settled. New reserach papers come out every day that have impacts on models. That is what makes GCMs different from a control system for an aircraft – once the control system is designed the requirments are not going to change unless there is an engineering flaw.
Raven,
No, I am describing the basic process of code writing. If you don’t know what you want the code to do, it will always give you what you want.
If the scientists in charge don’t know what they want the code to do, then they have no business starting the process of code writing.
What you are describing is not computer science. Indeed, it is not really science. At best it is tinkering, or perhaps playing.
When you do get a result that you like, you won’t have any idea why, because there was no process followed in getting there. Additionally, with something as complex as these models, you won’t even know if you got a good answer because your code is good, or if you got there because all of your errors managed to just about cancel out.
If there is no discipline in the development cycle, then the end product is useless. It may produce the results you want, but you won’t know why, and you will never know if a minor change in input parameters will cause the whole thing to collapse.
Imagine building a bridge without any idea up front what kind of bridge you want, or even if it is a bridge that you want. You build the bridge by adding a beam here, a joist there. Remove a girder here, a couple of rivets there. Connect a chain between two points. Why? I don’t know, just wanted to see if it would make a difference.
Eventually you might get a bridge that wouldn’t collapse when a car drove across it. But I wouldn’t want to be the first semi to drive across it, or the first person to try it in the rain or a high wind.
Finally, the attitude that you can just continue to tweak code until it looks like it’s working is what is wrong with most code development. It’s why the current models are undocumented, indeed they are undocumentable.
Such code is impossible to maintain because you have no idea what the interaction between modules are. The code is impossible to modify for the same reason. If you don’t design in quality from the start, you will never get quality.
439,
And if you had training in software engineering, you’d realize that parameters needn’t and shouldn’t be embedded in the source code. You should be able to do all of those parameter adjustments without recompiling the source. You’re just demonstrating exactly why this should be left to the software professionals.
Neal writes
And therin lies the proble. That is, it seems to be working. Why, you aren’t sure. Since it gives you the numbers that you are looking for in the handfull of test cases that you fed it. You are satisifies. Will it work when you apply values beyond those that you tested it with. You cross your fingers and hope. That is not how computer science is done.
MarkW says:
I don’t see GCMs as products – they are simply a fancy way to do mathematical calculations that support a hypothesis. They are a means to an end and not an end in itself. You could create a GCM product but who would use it? Other scientists doing their own research? Who would pay to develop a generic framework? Who would support it?
GCMs need to be written in away that allows indepedent investigators to verify that they do what they claim to do. You can accomplish this goal by setting out software standards and ensuring that they are followed. Following software development standards does not require a heavy weight waterfall development process. You can produce quality code and still follow a flexiable process. The only thing you need is accountability – i.e. climate scientists must pay a penalty of some sort if they fail to follow the standards (i.e. have their papers rejected by journals).
MarkW, Larry, LadyGray:
You are saying that “that is not how computer science is done”, “it’s bad programming practice”.
Actually, what I am saying (and what Raven is saying) is in complete agreement with that.
My point is that the futzing around is necessary when, in fact, you are really exploring a new physical phenomenon. Remember that in numerical physical modeling, there is usually no such thing as an exact equation. There are just reasonable approximations. The question is, What do you have to do to get a reasonable approximation? What can I get away with, vs. what do I have to be much more precise about?
The answers only become clear over time. You cannot know until you’ve gone through the process.
But I thought the debate was over because the science was settled.
#451, Larry:
See #440
Neal,
The ‘science is settled’ argument is used to defend the assertion that CO2 is the major cause of warming and that the amount of warming in the future will be catastrophic. Both of those claims are made based on the GCMs which, by your own admission, are changing all of the time. Many of the key IPCC conclusions in the SPM could be over turned by new science without invalidating the basic principle that CO2 causes warming. For example future science could establish that cloud feedbacks, cosmic rays and/or brown clouds work to counter act any CO2 warming.
In other words, if the really important questions were really settled then it should be possible to write a clear requirements document that would allow a non-scientist to develop a GCM. The fact that it is not possible to write a clear requirements document for a GCM demonstrates that the 95% certainty claim made by the IPCC does not reflect reality.
@Neil–
I was about to agree with you in 439, but then in 440, you advised I take aspirin because LadyGray has a headache. 🙂
I’ll still agree with you that at certain points in the research process, the researchers need to write significant amounts of code. There certain specific types of things that can go wrong, and they can’t be anticipated. The fastest way to resolve them is have a person who understands the science, the mathematical procedures involved in turning the equations into a code, and knows what manipulations might be acceptable from a physics point of view write a code.
There is no alternative, because the scientists can’t describe an algorithm that is know to work at the outset.
Back in the days when finite volume formulations for transport were being developed, neither modlers nor cs types knew about courant conditions, and wiggles you get when the reynolds and peclet numbers based on cell volumes are too high. Things went faster if modlers did really simple problems and explored what the heck was going wrong.
Diagnosing the problem required revising the codes guts, running diagnostics and testing.
Trying to hand things off between two people would never have worked.
This code will be inefficient from a code point of view, and it will be impossible to maintain, but yes, this had to be done.
I just have a sense the AGW codes are past the stage where that is necessary. (I could be wrong, but I honestly don’t think so. )
That said: , I also think these arguments about the GCM’s per-se, documenting the GCM – as –code is not all that relevant to the actual topic of the blog post which is where does the 2.5 C come from and is that provenance available. This thread has strayed onto
a) what is an engineering exposition of a GCM would work and
b) how should GCM’s be written and maintained.
Yes, codes need to be documented as codes generally, and there is a lapse. Yes, the code writing could conform to better QA standards.
But those sorts of documents, if they existed or QA standards, they probably wouldn’t begin to answer the question “Where does the estimated 2.5C come from?” They would address the question: “How much do we trust predictions from GCM’s?”. It’s not quite the same question.
Steve Milesworthy says the answer is really a range, and the provenances for the range are multiple. Every answer provided points to some estimates based on analyses that have nothing to do with GCMs plus some information from GCMs. That means the engineering exposition is a literature search, that might be a “background” section in a Ph.D. Thesis, a stand alone report or something like that. It’s not a QA plan for writing code.
The GCM may not be your product, but the data being used by the GCM is.
If the GCM is garbage, then so is the data. You can’t seperate one from the other.
Would you eat at a bakery that didn’t bother to ensure that their utensils were clean?
If you don’t care whether the data you are generating is accurate or not, then I don’t see how you can claim to be a scientist.
Neal,
What I’m saying is that the futzing around that you are talking about, is extremely dangerous, if you don’t know what you are doing. It is even dangerous if you do know what you are doing.
Would you futz around with a nuclear reactor, just because an idea came to you overnight?
One futz, probably will work. Two futzes, you might be able to get away with. The problem is that one futz after another ends up generating spaghetti code.
The point I made before is the point that you are not getting. It is very easy to create code in which a change to one section creates totally unexpected changes in many other areas. That is why you have to be disciplined from day one. And you can never drop that discipline.
In other words, you guys are telling me, that in your labs, you would rather have the data fast, then bother with making sure the data is good.
That’s not how I learned how to do science.
Raven,
What’s the use of even writting code, if you can’t be sure that the code does what you want it to do?
Unless you maintain software discipline, you will never be able to trust your code.
If that’s good enough for you. Fine. Do you feel the same way about the rest of your equipment?
lucia,
There has been many times when I have had to create a little sandbox, to play with something I didn’t fully understand yet. Then when I had it figured out, I went back to the mainline code and made the modifications.
In the simplified sandbox, I have greater control of the code, there is less extraneous code that I have to consider before making changes.
MarkW says:
The best code comes out an iterative development process where initial prototypes are reviewed and the requirements refined or adjusted. At the end of the process the requirements and objectives for each code module should be fully documented as part of the documentation for that module.
The discipline comes from applying software quality control as you go through each iteration. It is not necessary to start the first iteration with a fully defined set of requirements.
Why go through all that? For the last 100 ppmv there’s been about .75 trend rise. So doubling from 400 to 800 would give 3C trend per doubling. Problem, solved. Science, settled.
Ref my question in 441/442, (sorry Steve, accidental double post) is it a reasonable question or plain silly? If it is reasonable, might the much sought-after 2.5 C be a figment of Playstation science?
#454, lucia: I think I’m in total agreement. Shock!
#453, Raven: No, not all the science is changing all of the time. If you ask ME what is settled, I can only give my impression from the outside; but given that there are a range of GCMs that can be compared, an expert familiar with these comparisons can state what seems to be settled. I believe that’s where the IPCC comes in: they can talk to the experts.
And there is a big difference between saying that requirements documents don’t exist and saying that it’s not possible to document the GCMs.
MarkkW, #459: That’s what I was talking about. Whenever you start to expand the scope or refine the detail of a new calculation, you need this “sandbox” time, because you may be getting into a physical regime where aspects/factors other than what you’ve been focusing upon become dominant.
How can one refine and adjust your requirements, if it’s too much bother to write them in the first place?
If you are adressing me, no, I am not saying I’d rather have an answer fast than the right answer.
I don’t see any point in insisiting there is one and only one right way to write a computer code under any and all circumstances. I have codes on my knitting blog that let knitters create custom knitting patterns for hats and socks using the yarn they like. It’s a hobby. I get thank you notes. Do you think I’m going to write version change control, describe knitting to a programmer, and have them write it? No. Who cares if those codes are a hash with inline documentation only I read?
What I am saying with regard to writing code in the physical sciences is that sometimes having the person who knows the physics and the math write the code is required. This is generally very early in a process of developing methods to model something. That’s what happens when the research is at the single PI, two graduate student level.
But, once projects are past this stage code development must proceed as you and Larry etc. suggest.
I don’t think GCMs used are at the state where the person who knows climate has to write the code that’s used for the full computations. At most, they can write modules that hook into the big code. Once that module works, they can describe the algoritthm and flow chart and the can be rewritten in a more standard form and used. That keeps the “big code” maintainable.
So, I disagree with those who say the one and only way to ever write code is for scientists to hire code monkeys, and do everything very formally. That would be inefficient in Neil’s situation. I also think Neil’s examples share few similarities with simply don’t have relevance to writing or running GCM’s.
People writing the early CFD code in the ’70s and 80s used version change control so they could communicate how bits were changed. Grad students don’t usually do that for single PI, two graduate student projects. But building GCM’s isn’t a single PI two graduate student project.
That said, I still don’t think a QA plan addresses the question where does the 2.5C come from? It may address the question, “Can we believe the value?”– but only if it really mostly comes from GCM’s. Neil thinks it does– but I’m looking at Henderson-Sellers and McGuffie’s “A Climate Model Primer”, and I think the range has multiple provenances, and is not primarily from GCM’s. Annan’s answer and Gerry North’s answer only mentioned GCM’s at the tail end, and discussed other methods at some length.
I have written lots of code, both production (private industry and government) and exploratory. In the exploratory setting, I am in control and play with it. No problem. In the production environment, it must be handed over to someone eventually and needs to be documented. The GCMs are one or the other. If they are exploratory, then they are still at the frontiers of science and are not settled. Exploratory simulations are suggestive, and maybe support a theory, but are not definitive. If they are to be used in policy decisions, then they should be production quality. This means well-documented, with clear testing having been done. The fact that they give reasonable results is ok for a thesis but not for a policy decision unless all the test data are specified, the results are specified, and the analysis of the results is comprehensive. If these codes (models, not just the computer code) were to be used for running a nuclear reactor, would the fact that they give reasonable results be taken as sufficient?
#465, lucia:
If you don’t think the 2.5 comes from comparison of GCM results, where could it come from? There is no closed-formula possible.
Any calculation is going to boil down to a GCM, of some degree of detail.
Re 442, 462 Tony, Q&D CS
This is precisely the argument of the empiricists, including Lubos Motl, who gives quite a nice treatment of this argument at his blog. Lubos:
— http://www.climateaudit.org/?p=2560#comments , see #3 & 7
Interestingly enough, a number of recent formal studies yield the similar low numbers for CS, in the 1-2ºC rise/2xCO2 range. Forex,
http://www.nasa.gov/centers/goddard/news/topstory/2004/0315humidity.html http://meteo.lcd.lu/globalwarming/water_vapour/dessler04.pdf — Minschwaner and Dessler, CS est as 1.8ºC with H2O feedback.
http://arxiv.org/abs/physics/0509166 Douglass & Knox. Hmm, I cant’ find a CS# for this one, but it’s low. Anyone have it handy?
Soden et al, Global cooling after Pinatubo eruption, Science 296, 26 APR 2002 [link?]: 1.7 – 2.0ºC per 2xCO2 (by my calculation, see http://www.climateaudit.org/?p=1335 , #84
P. M. de F. Forster and M. Collins, Quantifying the water vapour feedback associated with post-Pinatubo global cooling: http://www.springerlink.com/content/37eb1l5mfl20mb7k/
Using J. Annans figure of 3.7W/m2 forcing for a 1ºC tmp rise, http://www.climateaudit.org/?p=2528#comment-188894 ,
yields a 0.4(±)ºC for H2O forcing, or a 1.4ºC sensitivity (CS) figure for the Pinatubo natural experiment. See http://www.climateaudit.org/?p=1335, my #94.
So that’s 3 peer-reviewed pubs plus a dead-simple arithmetical calculation (Motl & many others), all in the ±1.5ºC range for CS. Looks like a trend to me… 😉
More?
TIA & Cheers — Pete Tillman
You’re on the wrong thread. There’s another thread where it’s been determined that it came from a “lively interchange”. All Steve wants is for this “lively interchange” to be documented.
I don’t know if I’d equate getting to a working nuclear reactor to climate models.
I have no issue with models per se; as long as they’re designed to give us some idea of what’s going on, to base policy on and to lead to further understanding of climate. So to that goal, the models should take all possible factors into account, with proper disclaimers for every value that is an estimate or based upon some other estimate. There should also be some way to gauge the strength of the model compared to reality. For example, I have model X. It has 50% assumptions. How much can I trust it? I’d have to look into the assumptions; perhaps have a few independent experts in the area under consideration give their opinion on how accurate or inaccurate the assumption may be. Combine all these and come up with some indication.
Note that of course, extrapolating the last ppmv rise in CO2 and attributing it, and only it, as the cause of the last temperature increase (such as 400-800 doubling as 4*100ppmv based upon the last 100 ppmv being a .75 anomaly) would be crazy. Who would do such a thing.
PT:
When you consider the range of GCMs, all the physics that is taken into account includes all the considerations that go into the simpler calculations. Plus much more.
Unless you honestly believe that the grunt-level scientists are deliberately dishonestly trying to get high numbers, why should the simpler calculations carry more weight in your opinion?
Neal, 471, CS calculations, asks:
“why should the simpler calculations carry more weight in your opinion?”
Well, because they are simpler? 🙂 Seriously, these are all empirically-derived estimates, and I can (more or less) understand how these numbers were derived. This is no small advantage. I have no idea how the GCM models work (in detail), and I know that many of their operators-in-chief have AGW agendas.
Why would you prefer a model-derived number to one that’s actually observed ? Reality trumps theory, every time.
Best regards, PT
@Neil,
As it appears the 2.5 isn’t an exact number, I can give a mushy answer. It will also explain why I think that if steve milesworthy were to believe this did required an “engineering exposition”, this would be a literature search involving a) going to the library, and b) buttonholing some of the climate scientists to ask them for references.
Here’s are examples of places where I have seen estimates for the sensitivity to CO2 doubling:
1) Hansen et al. 1988 ( the scenario ABC) paper says NASA GISS II says 4.2 C for doubling. That is a GCM and appear to have first been reported in a 1984 paper which I have not read.
2) The Gerri North blog post Steve posted gave a simple radiative balance that then considered the lapse rate in the calculation. Not a GCM.
3) In a little textbook called “A Climate Modeling Primer”, by Henderson-Seller sna McGuffie, chapter 4 discusses “Radiative-Convective” models. The result for sensitivity depends on an assumed lapse rate and some assumptions about humidity. These are 1-d models, not GCM’s. (I think these are a bit like Modtran? I’m not sure.) They cite a Hanse et al. 1981 paper that got S=1.22C, 1.94 C, 1.37 C, and 2.78 C for a variety of different lapse rates/ humidity cloud models. These are all ‘simple’.)
4) Schwartz’s recent paper estimates the sensitivity from an estimated time constant and a heat capacity. He gets something near 1C. Not a GCM.
5) The little text book I have discusses some other simple non-gcm models, but I haven’t found any sensitivities in there. But, if these were disccussed as simple energy balance models, I bet sensitivities were computed with these.
So, yes, the 2.5C number and range partly comes from GCM’s. But I think the reason Annans answer includes all that other stuff is that it doen’t only come from GCM’s.
And “engineering exposition” of all this would basically track down all of these sources, tabulate them etc. It’s not absolutely to bring the circa 1988 GISS II code into compliance with contemporary standards to rput the value for 4.2 C in a table, provide the references etc. If the scope were increased slightly, or some particular novel feature popped out, there might be a journal article in it, but it may be nothing novel will pop-out.
So, for people who need to published in peer-reviewed articles to get promoted, there may be little motive to compile this. So… that’s one of the reasons I suspect climate scientists haven’t all dashed off to do this. But, the information could be useful for the full AGW spectrum ranging from denialists to alarmists.
It might be nice if this sort of thing were available. If Steve Milesworthy were organizing it, I really do think it should be assinged to a student intern as a semester project.
I’ll agree that it’s ok to tinker in order to get a handle on what’s going on. However, once you are past that point, and it is time to create the formal code, you have to start over with a clean slate and design your code. You can cut and paste portions of your putzed with code, but there is no way it can serve as the basis for your formal code.
#474, MarkW: Agreed.
#473, lucia: I couldn’t get North’s write-up: there seems to be a problem with that file. But the rest of the sources look like the sort of thing that feeds into a GCM; the 1-d stuff I would call a 1-d GCM. I think all these results are suggestive in giving insight into what factors are really important. But they don’t pretend to be comprehensive.
#472, PT: As Einstein pointed out to a very young Heisenberg, what you believe that you have observed depends upon the theory which provides the framework for your observation. The relative narrowness of scope of the simpler calculations is something to keep in mind.
I’ve been though too many paper exercises in my career to trust much in documentation. The whole PDR, CDR, CSFS, CSDS alphabet and it’s variants usually turned out to be “dog and pony shows” for upper management, where the people who were the specialists were told to shut up if they asked any embarrassing questions. And that was NOAA, DOD and FAA jobs. Even if you use iterative or agile development you still need to justify that what you built is what you were supposed to build.
I think the real problem with the GCM’s is the lack of V&V (verification and validation) preferably Independent. Did I build what you asked me to build, does it do the job it was meant to do? Without a clear exposition of how each part of the model implements the equations that defines the physical property it represents there is no way to verify that they are doing it correctly. Without a similar explanation of why a flux adjustment has to be made and why that value was chosen (because it only works if I use that value is NOT acceptable) the model is simply not verifiable. I haven’t looked at the code but given the codes age, probable programmer expertise, and language, my bet is that it is tightly coupled and never tested at a unit level or regression tested when changes were made. Once you get it verified then you need to determine if it’s valid for the task your asking it to do.
RE: #268 – Indeed, biological systems are sinks, in a number of ways. Enter Homo Sapiens Sapiens. First, this primate learned to recreate its primal habitat, later refined into agriculture, husbandry and forestry. Then mariculture and taking back the deserts. We now harvest photons from incident flux and convert them into electrical current. Same for wind and of course, stream waters. We take reactive elements and compounds, transforming them into durable things. We are a positive factor in the net accretion of the earth. There was for several thousand years an exception to this, in that we have been burning carbon based fuels. This will peak, meanwhile, the Naked Ape will always continue to increase growing of plants – we subconsciously want to propagate edens. Recently, it was deemed that there is “too much” CO2 in the air, but of course we have the means, and increasingly, the will, to facilitate reactions to fix it into non gaseous compounds and biological systems. And now, financial incentives are in place to drive such facilitation. What is this road we are on?
I’m still not buying the “diddle first, do it right later” school of programming. Experience shows that laying things out formally goes a long way toward clarifying the task. Just like how it’s usually a good idea to write the O&M manual first, and design the thing afterward. Writing the manual fleshes out your thinking, and exposes contradictions and conflicts. If you can write the O&M manual, you’ve defined the device.
Neil–
Ahh… well, then 1/3rd of our previosu apparent disagreement may have been purely semantinc. Jerry’s stuff is 0-d! The the 1d radiative-convective models have no circulation; the convection isn’t really convection. The just impose the a maximum lapse rate if the temperature gradient gets too large.
So, at least the references I have don’t call them GCM– there’s no circulation. I only call things GCM if the have a 3D atmosphere. I think that’s standard, but I could be wrong.
No. None of these models claims to be comprehensive.
The main reason for pointing thos out is provenance. The question “where does this come from” is one of provenance.
With regard to the issue of “comprehesive”, one should realize that back when the parameterizations in engineering codes sounded little like what is described in the few paragraphs of model description of the GCM papers, simpler models with less physics got better results than more complex models full of parameterized physics.
That may not be the case for GCMs, but there is no reason to expect it’s not the case.
Fully 3D computations can in principle be more accurate than lower dimenstional models. It is certain they eventually will be more accurate. Unfortunately, during the early transition, accuracy can actually degrade because there are so many more parameterization (which skeptics call fudge factors.)
I don’t personally know how accurate they are today.
(On another note: It’s January, and we are having a thunder storm near Chicago. Unbelievable!)
Thanks to you all for one of the most instructive CA discussions ever. Thanks in particular to James Annan for taking the time to write a constructive attempted response to Steve’s legitimate (and longstanding) query and for Neal’s patient, persistent, respectful, and informed participation. Views contrary to the prevailing ones in any discussion should always be welcomed, and advocates of such views should be welcomed and appreciated; the lack of such authentic debate is the great weakness of RC.
snip – policy discussion. sorry bout that.
RE: “Larry says: January 7th, 2008 at 4:26 pm”
A well used copy of Sommerville’s “Software Engineering” is found in my library. You are right on.
#480, Michael:
Thanks for your welcoming remarks.
Does anyone know why the “Clear Sky Anomaly” can be so easily dismissed by the modeling community? They attribute the 20% difference between satellite data and radiative transport codes to poorly understood aerosols. To me this seems to be a huge problem for people that are constantly saying that the “physics” underlying the models is correct.
Lindzen never brings it up, and it *is* plausible, but 20%!
How can discussions of significant thermodynamic and hydrodynamic phenomena and processes be based on a zeroth-order approach that barely includes a less-than-zeroth-order approximation to only one part of the problem? That approach makes introduction of the actual controlling phenomena and processes very much less direct, and thus convoluted, ad hoc, and heuristic.
There was a guest post by Spencer Wearts over at Real Climate on why we should not ask for an engineering exposition of the 2.5 deg sensitivity. Spencer Wearts is a historian of science who has turned into an apologist for climate change. For the first time I even posted some comments, and some made it through (one was edited and I don’t know why). For some reason, other commenters said I was an idiot who knew nothing about science, and that seemed to be their only response, to which I had to reply with an endless list of my so-called accomplishments, that never seem to be enough to entitle me to have an opinion. I guess anybody can be a cheerleader, but no one has enough qualifications to be a critic. Not a very useful debate so far.
Re: Francois Ouellette (#485),
It is a waste of time posting there. You have a bunch of back slappers as you noted. They do not want to do the calculations, just in case it ruins the current “belief” It is easier to say “the science is in” or “let us cut carbon emissions”, without any proof.
Re: Gerald Machnee (#486),
Should you really be talking about RC here? Our host said we weren’t supposed to talk about religious beliefs ;-).
Re: BarryW (#488),
I did not intend to talk religion. I should have used the word “consensus”.
In any event, Steve has not received a suitable response to a request for a detailed calculation for two reasons. One, it had not been done and two, is that it appears that nobody wants to do it (I added, it might upset the “consensus”.
Re: Francois Ouellette (#485),
Your civility and humility are serving you well in your discussions there. Your intelligence and familiarity with the subject matter is more than evident. Keep asking good questions and perhaps you will get a significant response from someone in authority. Spencer Weart’s begging off of the question is unacceptable.
I just re-read James Annan’s exposition. One problem I have with it is that he calculates (correctly)the underlying change in forcing for a change in temperature as
where W is radiation in W/m2 and T is temperature in Kelvins. This is 1/climate sensitivity, which puts the sensitivity (at 255K) at 0.27 K per W/m2.
The problem I have is that he has calculated it at 255°K (the theoretical temperature of an Earth without an atmosphere).
But what does that have to do with current climate sensitivity? It seems to me that he should calculate it at the Earth’s current temperature, as that is the change that we are interested in.
Using the current temperature of ~ 290K gives us a starting sensitivity of ~ 0.18K per W/m2, only about 2/3 of the figure that he starts with …
w.
Re: Willis Eschenbach (#487),
There are so many things wrong that it’s hard to decide where to start. Stefan-Boltzmann has almost nothing to do with climate sensitivity. What Annan calculates is the sensitivity of the planetary brightness temperature of the Earth as seen from deep space to a change in the solar constant. While the surface temperature or climate sensitivity is related to the planetary brightness temperature sensitivity, the relationship is not simple and there is little reason to believe that it is equal to the brightness temperature sensitivity.
A forcing at the top of the atmosphere does not produce an equal forcing at the surface. For clear sky conditions, even with no water vapor feedback, the forcing at the surface is more than two times larger than the forcing at the TOA based on MODTRAN calculations with 1976 standard atmosphere and CO2 at 280 and 560 ppm. Even if you don’t change the ghg concentration, a 1 C change in surface temperature produces a somewhat larger change in IR viewed from the surface looking up than that viewed from the TOA looking down.
In the emails, Phil Jones says the bare warming due to a doubling is 1.2C. I can’t find it anymore though.