[Climate Audit was started on Jan 31, 2005. Prior to its startup I had some notes at a prior website http://www.climate2003.com, responding here to blog criticisms at Deltoid and similar sites.]
Maybe I’ll start blogging some odds and ends that I’m working on. I’m going to post up some more observations on some of the blog criticisms.
One of the most common arguments against our criticism of MBH98 is that it is supported by other multi-proxy studies. This "support" is usually shown by "spaghetti diagrams", usually showing the results on an almost unintelligible scale. Here’s an oddity from spaghetti diagrams from Briffa et al. (2001) and Jones and Mann (2004). In the Briffa et al. spaghetti diagram, the Crowley-Lowery reconstruction is the "coldest" in the 17th and 18th centuries and does not intersect the MBH99 reconstruction. In the Jones and Mann spaghetti diagram, the Crowley-Lowery reconstruction intersects the MBH99 reconstruction in the late 17th century. 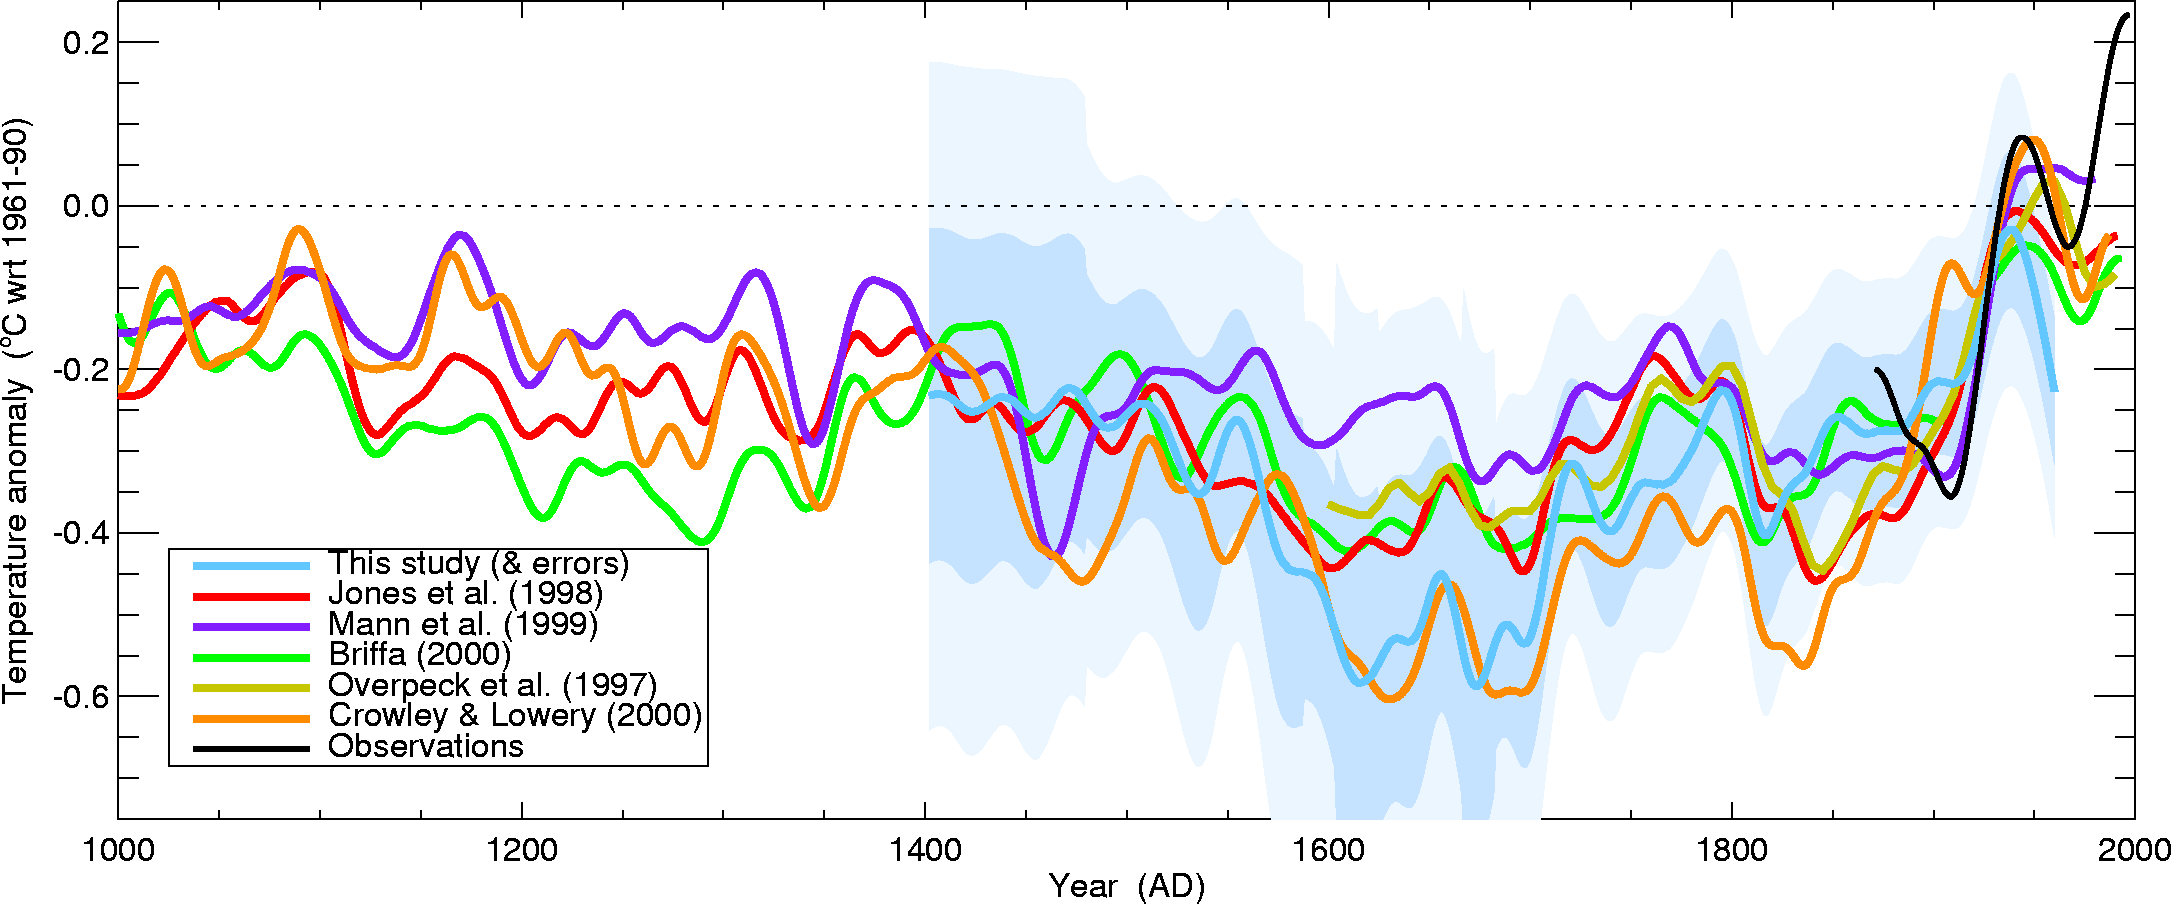 From this site. The Crowley-Lowery (2000) reconstruction is in a orange-brown and is the lowest strand in the 17th and 18th centuries, lower than MBH98/99 (purple) or Briffa et al (2000) (green).
  Here Crowley-Lowery (2000) is in black In this diagram, it intersects MBH99 in the late 17th century and is consistently above Briffa et al. (2001). In the Jones and Mann spaghetti diagram, the reconstructions were "scaled by linear regression against the smoothed instrumental NH series over the common interval 1856-1980, with the exception of Briffa et al (2001), which has been scaled over the shorter 1856-1940 interval owing to a late 20th century decline in temperature response in some of the underlying data". This supposed "decline in temperature response" is an interesting story in itself. The Briffa spaghetti diagram states that all values are re-expressed relative to a 1961-1990 mean (see y-axis label). I’m not expressing any views on this right now, merely noting it.







