An amusing farce with French protagonists is currently playing at realclimate here. The main protagonist is Raymond Pierrehumbert, the second line of whose CV proclaims that he is a Chevalier of some sort, a term which I will adopt in this post. He mocks another set of French authors, whom he labels as being Chevaliers of a rank presumably less dignified than his own. He accuses them of a variety of transgressions. As it turns out, I agree with most of his criticisms, but, as so often in climate science, Pierrehumbert (or the “Chevalier”) is silent on similar or more egregious transgressions by his fellow RC coauthors or IPCC.
In the farce at hand, the Chevalier raises a variety of issues. The only one that I review here pertains to the provenance of temperature data, since it is an area with which I am familiar and which also appears to be the most “Ugly” problem in the Chevalier’s beauty contest.
The temperature data problem originated with the Chevalier’s opponents (Courtillot et al), who, among other sins, failed to provide a proper data citation to their temperature series. (The lack of an accurate data citation is hardly a unique occurrence in climate science – it is more fair to say that it is the norm; it is something that I have regularly criticized and the failure of Courtillot et al to do so has led to much of the present farce. Although the authors provided the provenance of the data (in a reply to a Comment by another set of French authors, Bard and Delaygue), the Chevalier contests whether they provided actual provenance. He notes that Bard and Delaygue consulted the supposed originator of the data (Phil Jones), who denied ever producing the data in question. Bard and Delaygue reported this in a Note in Proof to their Comment, but this accusation was removed by the editor, to which the Chevalier took umbrage in his RC post. As we shall see, despite Jones’ denials of paternity, the data in question did originate with him – classic mistaken identity.
All in all, it’s a French farce with the Chevalier often acting more like Inspector Clouseau than Hercule Poirot.
In order to properly identify digital data, an adequate citation requires an identification code, which, in practical terms, means a URL together with a download date. My daughter in an undergraduate non-climate course knows this. The AGU has a policy requiring this in its publications:
The following elements must be included in the [data set] reference: author(s), title of data set, access number or code, data center, location including city, state, and country, and date.
Unfortunately, this excellent policy is totally ignored by climate scientists, even in AGU journals like GRL, JGR etc.
The wisdom of a policy requiring adequate data citation is amply demonstrated by the present comedy.
The Chevalier commences his post by stating:
It’s the physics, stupid [in smaller font in the original post].
We put the last word in small letters since we’ve learned that it is not a good debating technique to imply (even inadvertently) that those who are having trouble seeing the force of our arguments might be stupid.
If I may say so, it’s not just a matter of debating technique. People are not stupid. If people have trouble seeing the “force of [his] arguments”, maybe he should spend a little time examining how he’s presenting these arguments. Maybe the problem isn’t that the people are stupid, but that his explanations are not as clear as he thinks they are. RC always seems a little quick to lay blame elsewhere, when a look in the mirror might be in order. Just a thought.
The Chevalier then announces:
we’ll expose a pattern of suspicious errors and omissions that pervades Courtillot’s paper. Sloppiness and ignorance is by far the most charitable interpretation that can be placed on this pattern.
We are completely in favor of realclimate authors spending the time to expose “patterns of suspicious errors and omissions” wherever they lie. (Verification r2 statistics anyone?). He then describes some papers as “Ugly” (as opposed to “Bad”):
These papers cross the line from the merely erroneous into the actively deceptive. Papers in this category commit what Damon and Laut judiciously call a “Pattern of strange errors.” Papers in this category often use questionable (and often hidden and undocumented) data manipulations to manufacture correlations where none exist.
One would have thought that a realclimate coauthor of Michael Mann’s would tread lightly when it came to raising the level of rhetoric about “questionable (and often hidden and undocumented) data manipulations to manufacture correlations where none exist”, but the Chevalier is charging into battle seemingly reckless to the effect that such standards might inflict on his associates.
In our critique of Mann’s principal components methodology, we criticized the standardization on the short calibration period, which introduced a bias in his methodology. It seems that Courtillot et al, the Chevalier’s opponents, also carried out short segment standardization, to which the Chevalier takes great umbrage as follows:
By snipping out just the last bit of the curve and normalizing to unit standard deviation, Courtillot inflates the variability and makes the fit look better than it would be if the full data set were used. As a bit of deceptive data manipulation, this has to go down in history with the selective smoothing used on some of the solar records that Damon and Laut discuss in their critique of the Danish solar work.
Obviously we share the Chevalier’s concern about the perils of short segment standardization. However, I would have thought that a more obvious comparandum for the perils of short segment standardization – and one surely familiar to RC coauthors was MBH98 itself, where much publicity has been attached to the effect of short segment standardization. One would welcome the Chevalier’s expert opinion on whether short segment standardization in MBH98 was also a “bit of deceptive data manipulation [that] has to go down in history”, given that our own formal opinions have used more moderate language than that employed by the Chevalier.
The Chevalier also condemns opportunistic truncation of series – another issue discussed on this blog, where the truncation of the post-1960 values of the Briffa et al 2001 reconstruction by IPCC TAR and AR4 has been sharply criticized on several occasions. In Briffa et al 23001, post-1960 values go down showing a sharp mismatch between the Briffa et al 2001 recon and both temperature and other reconstructions. As a reviewer of IP AR4, I specifically asked IPCC to show the post-1960 values and explain the mismatch as best they could. They refused, saying only that it would be “inappropriate” to show the post-1960 mismatch. The post-1960 values of Rutherford, Mann et al 2005 were also truncated in IPCC AR4. Here’s the Chevalier’s view on opportunistic truncation:
there is no legitimate reason in a paper published in 2007 for truncating the temperature record at 1992 as they did. There is, however, a very good illegitimate reason, in that truncating the curve in this way helps to conceal the strength of the trend from the reader, and shortens the period in which the most glaring mismatch between solar activity and temperature occurs.
Again, I completely share the Chevalier’s severe views on opportunistic truncation – especially where the effect of the truncation is to conceal a mismatch. Having condemned the practise, perhaps the Chevalier will move his sights to other even more prominent truncations, such as the truncation of post-1960 values in the Briffa et al 2001 and Rutherford, Mann et al 2005 reconstructions in IP AR4 (and for the former, in TAR). As a reminder, here is a graphic showing the untruncated Briffa reconstruction (you never see the downturn on the right in the spaghetti graphs.)

On to the Farce
In his description of the really “Ugly” part of Courtillot et al, the Chevalier reported:
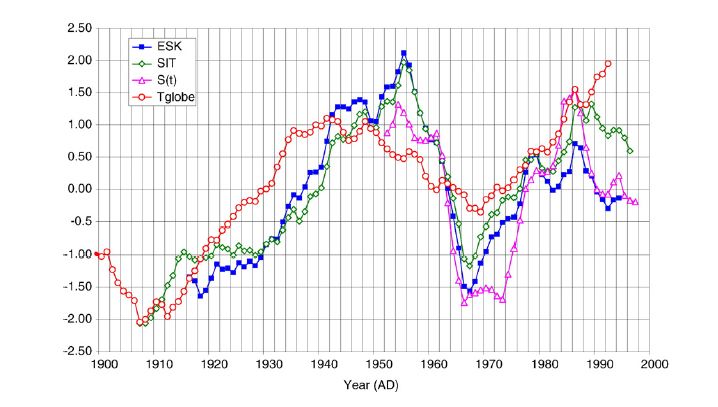
Bard and Delaygue noticed another strange thing. Courtillot’s “Tglobe” curve did not look much like the curve published by Jones. Jones’ curve, plotted from his actual data files, is shown in Bard and Delaygue’s corrected version of the figure; they also show the NASA reconstruction for comparison. These two curves are in agreement, but neither shows the sharp rise/dip pattern between 1940 and 1970 which is seen in Courtillot’s figure. So if Courtillot’s data is not Jones’ global mean temperature, what is it that Courtillot plotted? We may never know. In his response to Bard and Delaygue, Courtillot claims the data came from a file called: monthly_land_and_ocean_90S_90N_df_1901-2001mean_dat.txt. Bard and Delaygue point out, however, that Jones has no record of any such file in his dataset, and does not recognize the purported “Tglobe” curve as any version of a global mean temperature curve his own group has ever produced.
The Bard and Delaygue comment, cited by the Chevalier, included the following statement as a Note Added in Proof:
For the global temperature Tglobe curve cited from Jones et al. (1999) in Courtillot et al. (2007), these authors now state in their response that they had used the following data file: monthly_land_and_ocean_90S_90N_df_1901-2001mean_dat.txt We were unable to find this file even by contacting its putative author who specifically stated to us that it is not one of his files (Dr. Philip D. Jones, written communication dated Oct. 23, 2007).
The Chevalier chimed in with the following comment:
In the revised “Response” Courtillot now admits that the temperature record called “Tglobe” is not from any of Phil Jones’ datasets at all. Courtillot now claims that the data came from a study by Briffa et al. (2001), giving the address of a file stored at NCDC.
The Data
Now that the characters in this French farce are now more or less all on stage, let’s examine some actual data. On the left is the Courtillot et al figure being criticized, as posted at realclimate from Courtillot et al. On the right is a graphic that I produced from the data in column 7 of ftp://ftp.ncdc.noaa.gov/pub/data/paleo/contributions_by_author/briffa1998/briffa2001jgr3.txt, which is entitled:
Observed temperatures from Jones et al. (1999) Rev Geophys
To produce the graphic on the right, I first applied a filter (running 11-year mean) and then standardized on the 1900-1990 period – both operations frequently carried out in paleoclimate. The code for retrieving the data and producing the graphic is shown in the first comment below. I’ve looked at hundreds of data versions of various climate series, and it is my opinion that the Tglobe series illustrated in the Courtillot graphic is a filtered and rescaled version of the digital data cited above.
 |
 |
Left: Diagram from Courtillot et al 2007 with temperature series in red; right – plot of column 7 from ftp://ftp.ncdc.noaa.gov/pub/data/paleo/contributions_by_author/briffa1998/briffa2001jgr3.txt, entitled “Observed temperatures from Jones et al. (1999) Rev Geophys”
As noted above, Chevalier P-Humbert says that Courtillot has “admitted” that the temperature date did not come from any of Phil Jones’ datasets and comes instead from a Briffa et al 2001 study as follows:
Courtillot now admits that the temperature record called “Tglobe” is not from any of Phil Jones’ datasets at all. Courtillot now claims that the data came from a study by Briffa et al. (2001), giving the address of a file stored at NCDC.
We are well in the middle of the farce by this point. Readers of this blog know that Briffa and Jones are close associates and frequent coauthors, so, before concluding that an article by Briffa et al is unconnected with Jones, one should obviously check the co-authors, who in this case are:
K. R. Briffa, T. J. Osborn, F.H. Schweingruber, I.C. Harris, P. D. Jones, S.G. Shiyatov, and E.A. Vaganov.
As noted above, column 7 of the NCDC archive for Briffa et al 2001 states that the temperature data is:
Observed temperatures from Jones et al. (1999) Rev Geophys
So Chevalier P-Humbert’s allegation that the data in question did not come from any of Jones’ data sets appears to be simply untrue and an allegation that P-Humbert could have checked with the most elementary due diligence.
(Interestingly, Briffa et al 2001 referred to here is the very study whose post-1960 values were truncated by IPCC TAR and AR4, a truncation that, in my opinion, is as egregious or even more egregious than the truncation in Courtillot et al 2007 and, to avoid any perception of hypocrisy, I’m sure that we can expect the Chevalier to promptly communicate his vehement opposition to this truncation to IPCC authors, the Briffa et al 2001 coauthors and the Rutherford et al 2005 coauthors.)
So the citation for column 7 in the above archive by Briffa, Jones and coauthors was Jones et al. (1999) Rev Geophys; the citation in Courtillot et al 2007 was: P.D. Jones, M. New, D.E. Parker, S. Martin, G. Rigori, Surface air temperature and its changes over the past 150 years, Rev. Geophys. 37 (1999) 173199.
Notwithstanding the identity established above, Chevalier P-Humbert reported that Phil Jones claimed that the series illustrated in Courtillot et al 2007 has nothing to do with him:
its putative author specifically stated to us that it is not one of his files (Dr. Philip D. Jones, written communication dated Oct. 23, 2007)
Unfortunately, the statement by the “putative author” was false. But, hey, this is climate science. Why should Jones have to undergo paternity tests? The Chevalier no doubt correctly reported that Jones had denied paternity, but the fact that Jones denied paternity did not mean that he was not a father or co-father of the data (even though he failed to recognize the filtered and smoothed version of the data provided in Briffa, Jones et al 2001).
As noted above, the editor of the journal removed the allegations added in proof, to which the Chevalier took great exception. However, in this case, and undoubtedly merely by happenstance, the editor’s judgement has been vindicated, as he removed an untrue allegation by one set of disputants.
Despite all the clumsiness by Phil Jones and the Chevalier, this is, after all, a French farce and there is plenty of confusion to go around and Courtillot et al are not innocent: indeed their failure to provide a proper data citation, even if standard in climate science has fostered the comedy. They also misconstrued the series archived in Briffa et al 2001 as a global series instead of a 20-90N series. As noted above, the data archive referred to above column 7 provides data purporting to be:
Observed temperatures from Jones et al. (1999) Rev Geophys
Jones et al 1999 reports Global, NH and SH temperature and apparently Courtillot unwarily assumed that the digital data said to come from Jones et al (1999) actually did come from that publication and then to have assumed that it was the global temperature (as opposed to the NH temperature). As it turns out, the data here does not appear to be any of the three series (NH,SH, Global) illustrated in Jones et al 1999, but a special-purpose series calculated for Briffa et al 2001 covering 20-90N. In addition to the temperature said to come from Jones et al 1999, the Briffa et al 2001 archive lists 6 temperature reconstructions with the following comment:
The following reconstructions have been taken from the source “references listed below, and then RECALIBRATED to obtain estimates” of April-September mean temperatures from all land regions north of 20N. All series are temperature anomalies in degrees C with respect to the 1961-1990 mean.
The reconstruction data is listed in columns 1-6. It appears that the column 7 data said to come from Jones et al 1999 is actually a new composite for 20N-90N calculated for Briffa Jones et al 2001 – it doesn’t say this – indeed it might be interpreted not to say this – but, based on familiarity with Team methods, this would be my guess and Courtillot seems to have been wrongfooted here. (My guess is that it’s probably not a whole lot different from the contemporary NH version but that’s just a guess)
Adding to the comedy is the obsolete version used here. The series in Briffa et al 2001 only comes up to 1997 and was itself over 3 years obsolete when published (although I don’t recall any previous objections). When Courtillot applied an 11 year filter, the smoothed series had 5 fewer years and thus ended in 1992, exacerbating the problem from using an obsolete data version in the first place.
I strongly disagree with the use of obsolete data – a position espoused on other occasions at this blog. I entirely concur with the Chevalier’s objection on this point. I’ve consistently objected to the use of obsolete data versions – as far back as MM03, we reported MBH98 use of obsolete data versions. But in Mann et al 2007, Mann hasn’t changed a comma in the MBH98 data set, continuing the use of data versions already obsolete in 1998. The Chevalier is silent as a lamb. Mann’s PC1 has surely become obsolete in light of the criticisms of Wegman and the NAS panel and yet Mann et al 2007 perpetuates its use. The Chevalier remains silent. So while I strongly agree with the Chevalier’s criticism of obsolete data, I disagree with the hypocrisy of his silence to other similar transgressions.
All in all, a comedy of errors and mistaken identity – a French farce indeed. Courtillot used an obsolete data set without providing a data citation. Courtillot did not realize that the series said to come from Jones et al 1999 was not one of the series illustrated in Jones et al 1999. Courtillot did not realize that the data entitled “observed temperatures from Jones et al. (1999) Rev Geophys” (which showed global, NH and SH temperatures) was actually temperature for 20-90N, a subcalculation nowhere mentioned in Jones et al 1999. When Courtillot identified the provenance (it seems accurately), the originating author, Jones, did not recognize the series from Briffa, Jones et al 2001 in Courtillot’s smoothed and re-scaled version and falsely denied paternity. Bard and Delaygue accepted Jones’ denial of paternity at face value and falsely accused Courtillot of misrepresenting where they obtained the data from. Neither Bard nor the Chevalier actually bothered plotting the data from the location (Briffa et al 2001 at NCDC) to see whether it matched the Courtillot figure. The Chevalier then recklessly accused Courtillot of making a “suspicious error” even though a simple plot of the ncdc data as done here would have proved the provenance. The editor of EPSL removed these allegations (which have proven false), and, in doing so, has incurred the wrath of the Chevalier for removing the allegations (now shown to be false).
I have only discussed the farce of the temperature measurements. I have not visited the issues of magnetic data or solar data or correlations. None of the authors in this dispute provided proper data citations (with exact URLs). I have no doubt that there are many more episodes in this comedy, but even I have a limited appetite for French farce.
Code for Right Panel Above
In case the Chevalier or his entourage elect to deny that the temperature series in Courtillot can be derived from a Jones data set, here is source code which yields the above graphic on a turnkey basis:
url=”ftp://ftp.ncdc.noaa.gov/pub/data/paleo/contributions_by_author/briffa1998/briffa2001jgr3.txt”
Briffa=read.table(url,skip=24,fill=TRUE)
temp=(Briffa< (-999)); Briffa[temp]=NA
dimnames(Briffa)[[2]]=1900)
par(mar=c(2,3,2,1))
plot(1900:1997,x[temp],type=”l”,ylim=c(-2.5,2.5),col=”red”,xlim=c(1900,2000),xaxs=”i”)
points(1900:1997,x[temp],pch=1,col=”red”,cex=.9)
grid(lty=2,col=”grey80″)
abline(v=seq(1900,2000,10),col=”grey80″,lty=2)


61 Comments
duz he hav a licenz pour dat minkey ??
Sorry, but after reading through that well documented farse, I could only think of the great Inspector Clousseau.
I was hoping you read this
Maybe that’s because Poirot is Belgian. 🙂
Thanks Steve. A merry read for the start of the holidays.
“Un Ane en la Merde? …”
I believe Inspector Clouseau was Belgian as well. I know that peter Sellers affected a belgian accent for the role.
Re: #6
Poirot Belgian? Oui
Clouseau Belgian? Non
Just a totally attrocious accent from Peter Sellars which made fun of the French with some double entendres.
Thoroughly enjoyed the thread, thanx Steve.
Alan
Ray Busts a move
Ray contemplates Hansen’s chair
Very nice post, Steve. I believe they make it too easy for you. I must admit, when I read;
a few days ago, I was a bit nonplussed. Can he be that blind, or does he just think we’re stupid? Uh, never mind, I think I know the answer to that question.
I wonder where one can find Courtillot’s paper in question. (I read French). He seems to have put quite a burr under the RC blanket. It is interesting how the criticism starts by citing the eminent qualifications of the targets, and then points out all mannner of stupidities on their parts. One might ask if such emminent figures would really commit such obvious faux pas, or if they do, why similarly qualified members of the hockey team might not exhibit similar failings. Of course the team conclusion must be that stupidities must be expected of anyone so obtuse as to be skeptical, and people clever enough to be believers are equally clever enough to avoid such errors. Hmmm.
I’m reminded of proverbs and nursery rhymes we learned as children, such as: “What’s sauce for the goose, is sauce for the gander.” and the one about Pots and Kettles. Or perhaps it is a just case of “do as I say, not as I do”?
sigh,
Robert
When I first saw Courtillot’s paper, I decided it was not worth my time. As they say “one look was all it took”. This is a time-honored method to deal with bad papers. You simply ignore them and they die on the vine.
Great work Steve. We needed some humour to end the year. Stuff like this should be handed out with (or instead) of the inconvenient truth in English schools.
P-Humbert said that he put the Bard and Delaygue Comment online so that:
You’d think that he’d have done the same thing for the article being criticized and the Reply.
Chevalier de l’ordre de la terre plate = Knight of the flat earth society
This is a poetic unflatering way of portraying skeptic/denialist, which are by definition anyone who is not a Mannian friends.
Steve: I’m from Canada; I studied French in high school for 4 years and I’ve done French language securities offerings. I didn’t need a translation; I knew what he intended. But he was the one that introduced the chevalier motif; I was just having fun with it.
Chevalier de l’Ordre des Palmes Academiques
from the Collins/Robert dictionnary this is:
.decoration for services to education in France.
well done MC
Now you could have made an allusion to The Enchanted Hunters …..
Chevalier or ‘Chevrolet’?
Look up: Chevrolet http://surnames.behindthename.com/php/search.php?terms=French&title=French+Names&usage=yes
– Usage: French, Swiss
– From chevaux meaning “goat” and lait meaning “milk”, perhaps a name used to describe a farmer who cultivated goats.
Re #15
Actually it was to draw attention to the error made by Courtillot of not allowing for the spherical geometry of the earth.
A flattened sphere! Of course, that’s how you can get the rain in Maine to fall on the Seine. Michael Mann can put that in his Chevrolet and drive it to the left bank! With a flat earth, he’ll only need a 4 cyl engine and two gears. Al Gore will be happy.
Re #21
I know it’s only about 100km drive but I suspect he’ll need more than 2 gears on the E-50.
#12
Fascinating approach, Doctor. I’m unfamiliar with science conducted in this fashion.
Did you read the result, and decide the methods had to be all wrong? Or did you study the methods and decide the results had to be invalid? Or dd you read the authors’ names and go no further?
Re #22
It’s a little farther than that from State College. But if we’re going to nitpick, maybe he can drive to West Chester, PA, and pretend he’s in Bombay.
Amazing what you can do with flat earth.
Re #24
I thought you were talking about Maine to Seine? I would have thought the rain in Maine falls on the Loire?
Sounds like you’ve missed the general thrust of one of the longest running jokes on this blog. Since Chevalier’s work is open to ridicule because of a silly sounding mistake, I thought you might see the humor in a silly mistake Michael Mann has made and continues to make.
I guess I was wrong.
23: When one [like me] is very famililar with the geomagnetic field, activity, and data analysis, it does not take long to relaize that there were serious problems with the paper. After 40 years as a scientist one learns to spot bad papers. No extensive research was needed to decide on this one. And you can spare me the sarcasm. Now, if you think the paper is worth your time, maybe you can try to convince me that the paper is also worth my time.
Excellent sleuthing, Inspector McIntyre!
May I suggest that a suitable complete title for our French friends over at RC, one that they might actually appreciate, would be les Chevaliers de l’Ordre de la Crosse d’Hockey? (Knights of the Order of the Hockey Stick)
The reference in Raymond Pierrehumbert’s title to les Chevaliers de l’Ordre de la Terre Platte (see Sylvain, #15) brings to mind Jean-Antoine Letronne (1787-1848). According to Ontario book dealer David Anderson, “Letronne is implicated with Washington Irving in having helped to popularize the historically incorrect notion that medieval savants held the world to be flat — a now wide-spread belief of our time but that has no scholarly foundation.”
The details Irving’s Flat Earth scam, and the failure of subsequent historians to check their references as thoroughly as Steve would have, may be found in Jeffrey Burton Russell’s highly recommended Inventing the Flat Earth, at http://www.greenwood.com/catalog/B5904.aspx. As I recall from Russell’s book, however, Letronne was not in on the joke per Anderson, but was, with with the American “science historians” Draper and White, one of the suckers who swallowed it, hook, line and sinker, without checking the facts.
Just for the record RE Phil., #25, the rain in Maine falls mainly in the Huisne, which flows directly through Le Mans. This feeds the Sarthe and then (near Angers) the Maine, and only then does it flow into the Loire as mentioned by Phil. However, from my atlas, it does not look like much, if any, of the rain in Maine actually reaches the Seine.
#27. Leif, you’ve almost entirely missed the point of the post. What interested me was the standards enunciated by P-Humbert for an “ugly” paper, for basing arguments on correlations without a physical basis. Now apply those standards to MBH98-99 or Mann et al 2007 RegEM and what do you get.
And why is the Team so sharp at spotting the defects in some minor paper like this and so blind to the defects in the paleoclimate recons. How is it that the flaws in one are quickly spotted while the flaws in the other continue uncorrected. E.g. JEG’s associate, Kim Cobb, continues to use the HS in her popular presentations.
#28. It’s the rain in Washington that falls mainly in the Loire.
How does that work again.
1) I am an expert.
2) I disagree with the conclusion this paper reaches.
3) Therefore the paper must be wrong.
What was it Einstein said to Heisenberg? “God does not play dice with the universe.” Or something like that.
29 (Steve): Yes, I know. My post was just triggered by my reaction to the Courtillot paper. I know the authors and Le Mouel is a good and respected scientist in his field. It was immediately obvious that he (and co-authors) had strayed, and the sooner the [geomagnetic] community forgets that miserable paper, the better. I was just venting that feeling. My point [at it was] was that commenting on Courtillot et al. is a waste of time as the paper deserves to be quietly forgotten, unless you want to use the comments as a means to another end.
31: your comment speaks for itself and speaks volumes about you as well, and gets the same fate as Courtillot et al should have had, as you do.
#18
Nice one
re 33 the unfortunate consequence of a far too liberal education, a
good memory for obscure detail– Ah yes, and a wonderful class taught by Alfred Appel.
@Leif:
Yes. Ignoring poor papers is a time honored tradition. It’s better to spend time discussing good papers, unless a poor paper is already being widely discussed. In that case, one often can’t avoid discussing the bad paper.
Have any other Climate Change bloggers discussed the paper? I did a Google search, and it appears RayPierre introduced this topic into the blogosphere. I realize some may have read it, and also that some people may have said things in comments but still.
Why RayPierre’s spend so much time on a paper that no one seems to be embracing? Ordinarily, all Raypierre would need to do is ignore it.
35 lucia
There must be something in the paper that makes M. Humbert feel insecure. Do we have a link to it?
re 35 & 36.. the explanation is simple. They need to maintain their skeptic cred.
Whenever I blast RC on being believers, they intone about the skepticism inherent in all science.
Consequently:
they need to do debunking, periodically. And they won’t debunk the mainstream so they debunk
the CLP. Closest lame paper.
Steve:
Appel was wonderful on N. I have a nice letter from him. Merry Holidays.
#24.
This is an excellent point. But we’re not talking about a “flat” earth here, but something more like a projective plane or something with a more complicated topology. One of the interesting techniques in topology is to create new shapes by identifying opposite points – that’s how you get Mobius bands, toruses and all the strange multi-handled beasts of topology (which I studied as a youth.)
If I recall correctly, a projective plane can be constructed by identifying antipodal points on a sphere as being the same point. Don’t ask me to explain: if you understand the point, you will understand it immediately.
Viewed topologically, Mannian teleconnections do not require physical meaning – they are purely mathematical. Thus Mannian teleconnections can arguably construed as imparting a topology to the sphere in which West Chester and Bombay are the same place – it is not merely pretending.
Chevaliers de l’Ordre de la Terre à la Plan Projetif, as it were.
Is it possible that by discussing this paper they are trying to distract attention away from Ross’s good paper? That thread at RC was quite busy. Maybe they didn’t like the way it was going?
RE 38. Funny, I was just talking about him (alfred) to my daughter as I passed her my Borges and Barth
which I have kept all these years from his class. I was there a long while ago, did you know Knepper?
RE 40. I made three new posts to the Ross thread a couple days ago.. youth-en-nized? we will see.
I think they want it to die. At one point gavin inlines that Ross’ finding was a statistical FLUKE.
That a wonderful defense, modern warming is a statistical fluke. Oh artic ice is a statistcal fluke.
here a fluke there a fluke everywhere a fluke fluke,
SteveM should contact Ross about Gavin’s “test” Gavin proposes that Ross’s approach can be tested
with GCM output. You’ll have to read the thread to get gist, but it’s an “interesting” idea.
I went to get the GCM data, but I am awaiting “clearence”
“Facts, Hercule, facts! Nothing matters but ze facts, you feul. Without zem ze science of climate investigation is nuzing more zan a guessing game. ” (free to Insp.Clouseau in “A Shot in the Dark”)
#19 _Jim…I’m sorry to say but this source is wrong:
“Chevaux” means “horses” a good example that also french
words of latin origin may have “umlaut” sing. “cheval” Goat
is “chevre” “lait de chevre” thus is goat milk
BTW Steve McIntyre what a coincidence, in “Toronto record
snow” thread I asked “ou sont nos amis francais?” et voilà!!
Joyeux Noël!
#39
Mannian teleconnections and a Mobius reference?
I thought “Mo’ BS” might be a better term.:)
Snip away if you wish, and have a Happy Holiday!
Staffan Lindstroem, BTW:
不要认为, 外语提供您以任一个程度保密性。
http://babelfish.altavista.com/
Unnecessary? ? Outside? Offer? From here the duty one 个 preservation dense characteristic.
(Japanese)
Does not want □□, outside □provides you by any □degree secrecy.se)
(Chinese) ANDREY!! Perfectly clear Spassiba khorosho, Andrey…
Keep it cool, Norse Bro. I used back country ski Ural at -43C.
Marry Christmas!
re 48.. we should all converse in norse code.. I mean morse code
Is this norse code?
re 50… thank you for the christmas present numbnuts. Your link gave me
my first ever eggnog nose enema. Merry Effin christmas.
#48 Norse bro = “Norwegian brother”?? Well Andrey I can’t
beat your -43C downhill eh..cross-country skiing in the
Urals; -29C bicycling 3 km in Bollnaes 300 km N of Stockholm
in 1978, January perhaps. Cold enough…”Swedish brother”
please…Telenor is our workplace’s neighbour in a house that ressembles
a Stockholm-Finland ferry(!) IF you read some misplaced
posting of mine in another thread. If I possess a Norwegian flag, I hope
I don’t become Norwegian by that,LOL, of course I know most of them think it’s
a shame Al Gore/IPCC receives NPP…Too late now only non-holiday chance
to sleep 2 nights in a row…02:32 local time…
#48 But we should all marry Christmas, that I agree on…
Izvinite, Andrey not too tired to not resist that…21
hours 21 minutes to weekday again…
#50 Larry …HILARRYIOUS Correct me if I’m wrong
but since I mentioned YouTube (as a source for
weather event videos) the frequency of …you
know what I mean …Is there any “homemade” animation
of the RATification of the Kyoto with 200 Rémys…Probably
not but in your heads there is now…??!! MBN Señoras y
señores
Of course I know you are Swedish, Staffan Lindstroem!
Norse Bro stands for Norsemen Brother :
http://sv.wikipedia.org/wiki/Nordm%C3%A4n
Or you prefer ‘Varyag’? They did a good job for creating Russia/Ukraine state! :
http://sv.wikipedia.org/wiki/Varjag
Maybe someone can clarify something for me. The Courtillot Reply presently online states that is was “Accepted 29 September 2007 Available online 5 October 2007”. The version presently online states:
This is a correct statement of provenance and would that the Team were so clear.
On Dec 18, Pierrehumbert posted up the following statement:
When I observed that the Courtillot graph could be replicated, NASA employee Gavin Schmidt stated:
Now I realize that there seem to be two iterations of the Courtillot Reply. Question – has the version presently online been changed since Oct 5, when it was said to have been placed online. If it has not been changed, then Gavin’s statement quoted above is false; Pierrehumbert could readily have determined the correct provenance of the data long before he posted up on Dec 18 and these particular accusations should not have been made.
If the online version was changed between Oct 5 and Dec 18, 2007, then the circumstances obviously differ. Does anyone know the facts?
Re #56
Steve the dates don’t match, I can’t check the library from home but Bard & Delaygue’s comment was accepted on 29 Sept and subsequently had the ‘note added in proof’ added to it (after 23rd Oct), the on-line version was available 13th Oct. The note was subsequently removed and replaced by the response I linked on here earlier today. The date on the response 5th Oct implies that the response to the comment by B&D was received on the same day as the comment and published a week before it! Since that clearly didn’t happen this can only refer to the ‘note’ or an earlier form of the response, the current response is a significant document, clearly not something produced overnight and can’t have been written in its present form before the end of Oct.
Clearly there is some obfuscation going on re the dates, based on B&D’s note there must have been two versions of the response and the earliest the second version could have been produced was November. Raypierre says that the original version was on-line through Dec 15th which seems likely.
#57. Phil, all I’m saying is that we don’t know the date when the version presently online was placed online and there is reason not to rely on the date presently shown. I’d rather determine the actual date rather than speculate about it. I’m not familiar with academic protocols on changes after acceptance. We ran into this issue with Wahl and Ammann 2007, whose accepted version cited and relied on their rejected GRL submission and, as I reported previously, it was interesting to see how this would be handled. In the end, they recast their GRL submission and submitted it to Climatic Change (the publisher of their article) and Wahl and Ammann 2007 was held up over 18 months while this article wended its way through the process. The “accepted” Wahl and Ammann version cited an article whih was not accepted until nearly 18 months (summer 2007) after the first article was accepted. Curiously the submission date of the latter article was said to be 2000, whih I take to be a misprint.
Re #58
The dates presently shown are obviously not right for the reasons I posted yesterday, regarding protocols I would have expected something like ‘original version received Oct 8th, revision received Nov 15th’ or some such (those dates just for illustration). Dates are very important to establish priority, it might not be so important in a response but in this case B&D have a case to argue because at present without the revision date it could make some of their comment look odd. It looks as if the editorial board is trying to ‘tidy up’ something this way with the removal of the note as well. Perhaps the print versions out next month will have a more rational timeline? At the moment the scenario that the response went on-line before the comment is absurd. The response is rather lame in any case, it completely misses the point on the first comment and still covers up the fact that Tglobe is actually N hemisphere extratropical summer!
#59. can you contact the journal and get a correct timeline? Before getting too excited about the Courtillot gaffes, keep in mind that such gaffes are widespread in Team climate science. MBH98 also gave an incorrect attribution of its temperature data – it cited Jones and Briffa 1992 which had 5×10 degree cells, but actually used 5×5 degree gridcells. They did not correct this in the Corrigendum. Likewise they said that they used 1902-1995 data (1128 months) but appear to have only used 1902-1993 data. Does it matter? Not compared to other issues, but it’s typically sloppy. Humbert’s reaction is over-the-top given prior acquiescence in many more egregious incidents.
Without sorting out the bucket adjustments, I’m doubtful that one can put much weight on any 20th century explanations. Earlier toilers in the same fields as Courtillot (e.g. George Reid) tended to use SST rather than land temperatures in solar-temperature discussions. It would have been open to Courtillot to use SST in their calculation. I’ve experimented a little with SST without bucket adjustment and there’s probably a better case available than Courtillot actually used.
I notice that Allegre is in the news again!
http://sciences.blogs.liberation.fr/home/2008/03/claude-allgre-m.html
3 Trackbacks
[…] https://climateaudit.org/2007/12/21/the-comedy-of-the-chevaliers-a-french-farce/ […]
[…] https://climateaudit.org/2007/12/21/the-comedy-of-the-chevaliers-a-french-farce/ […]
[…] a recent post, I reported that the Courtillot graphic could be easily replicated from column 7 of the data at […]