As noted in my previous post, Marcott, Shakun, Clark and Mix disappeared two alkenone cores from the 1940 population, both of which were highly negative. In addition, they made some surprising additions to the 1940 population, including three cores whose coretops were dated by competent specialists 500-1000 years earlier.
While the article says that ages were recalibrated with CALIB6.0.1, the differences between CALIB6.0.1 and previous radiocarbon calibrations is not material to the coretop dating issues being discussed here. Further, Marcott’s thesis used CALIB6.0.1, but had very different coretop dates. Marcott et al stated in their SI that “Core tops are assumed to be 1950 AD unless otherwise indicated in original publication”. This is not the procedure that I’ve observed in the data. Precisely what they’ve done is still unclear, but it’s something different.
In today’s post, I’ll examine their proxy #23, an alkenone series of Isono et al 2009. This series is a composite of a piston core (MD01-2421), a gravity core (KR02-06 St. A GC) and a box/multiple core (KR02-06 St A MC1), all taken at the same location. Piston cores are used for deep time, but lose the top portion of the core. Coretops of piston cores can be hundreds or even a few thousand years old. Box cores are shallow cores and the presently preferred technique for recovering up-to-date results.
There are vanishingly few alkenone series where there is a high-resolution box core accompanying Holocene data. Indeed, within the entire Marcott corpus of ocean cores, the MD01-241/KNR02-06 splice is unique in being dated nearly to the present. Its published end date was -41BP (1991AD). Convincing support for modern dating of the top part of the box core is the presence of a bomb spike:
A sample from 3 cm depth in the MC core showed a bomb spike. The high sedimentation rate (average 31 cm/ka) over the last 7000 years permits analysis at multidecade resolution with an average sample spacing of ~32 years.
Despite this evidence for modern sediments, Marcott et al blanked out the top three measurements as shown below:
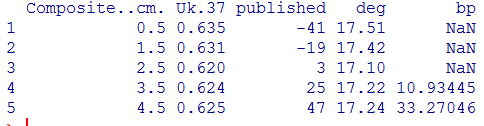
Table 1. Excerpt from Marcott et al spreadsheet
By blanking out the three most recent values of their proxy #23, the earliest dated value was 10.93 BP (1939.07 AD). As a result, the MD01-2421+KNR02-06 alkenone series was excluded from the 1940 population. I am unable to locate any documented methodology that would lead to the blanking out of the last three values of this dataset. Nor am I presently aware of any rational basis for excluding the three most recent values.
Since this series was strongly negative in the 20th century, its removal (together with the related removal of OCE326-GGC30 and the importation of medieval data) led to the closing uptick.
BTW in the original publication, Isono et al 2009 reported a decrease in SST from Holocene to modern times that is much larger than the Marcott NHX estimate of less than 1 deg C, reporting as follows:
the SST decreased by ~5 °C to the present (16.7 °C), with high-frequency variations of ~1 °C amplitude (Fig. 2).
A plot of this series is shown below, with the “present” value reported by Isono et al shown as a red dot.


225 Comments
Reblogged this on Climate Ponderings.
The bottom line is Marcott made these changes for a reason , otherwise he would have used the same data has for his Thesis.
Why he made them and what he did is ‘unclear ‘ , however we can see the effects of this change , the hockey stick , and we can consider what this addition did for the the author and its status.
In the these two cases it made is a shoe-in for AR5, get a whole load of PR and brought much prise from ‘the Team ‘ who we seen act has gatekeepers to career and funding for those working within climate science,
These would have been highly unlike to occur given the original results , indeed we seen what happen to those challenge ‘the cause ‘ and its not good .
As ever changes are not the problem , the justification for changes and valid description of them , so that they can be checked , is the problem .
And this is problem that seems to hang around ‘climate science’ the same way a bad smell seems to hand around a open sewer.
Speaking of ‘shoe-in’, look at that 1939.07 AD fit like spike heels on 1940 AD. Howls of laughter curvette like calves.
================
Could it possibly be that he got Mann as a peer reviewer? If that would have happened, there is no way he could get the paper published unless he produced a hockey stick.
I also wodered if Mann was one of the reviewers of the Marcott paper. Then I thought no, even God would not be that cruel(kind?).
Rawd and John B:
Of course! That explains everything. Mann was a reviewer!
Not based on what he said to Andy Revkin at the NYT. His comments suggest that he had scanned it and then read it in more depth. But then ….
I don’t trust what Mann says about anything, but he did indicate to Revkin of the New York Times/Dot Earth blog that he was just then reading the paper, and then in a follow-up remark that he had just read the paper closely. That would be quite a pantomime routine if he had reviewed the paper for the journal…..
Remember Eric Steig’s reaction to Ryan O’Donnel’s Antarctic paper:
“Back when Ryan O had written comments at RC, I said something like “I encourage you to submit this work for publication.” I’d glad to see that this work has gone through the peer review process, and I look forward to reading it.
. . .
Ryan, if you don’t mind sending me a preprint, and a link to your reconstructed data, I’d appreciate it.
I will presumably have more to say after I get a chance to read the paper, but it’ll be a month or more as I’m simply too busy with current projects.”
Steig, of course, had been Reviewer A on the paper. (He hadn’t seen the final draft, but still, I’d say this qualifies as a “pantomime routine.”)
If not reviewed by Mann directly, definitely by proxy via a few of his buddies from the hockey team. You can count on this, the way Mann is tweeting media articles about the Marcott paper like crazy. Alas, it’s all blowing up in Mann’s face AGAIN after Mr McIntyre immediately saw through this new ‘hide the decline’ trick.
By the way, whatever happened to the Gergis et al paper?
In the manner of hot air balloonists,
they noticed their awkward descent;
to mask their decline,
“Bomb Away” was just fine,
toward the heavens they suddenly went…
No way to blame this on the computer doing MonteCarlo, the judicious pruning happened prior to the horizontal bop…
RR
Paragraph 4, MD01-241/KNR02-06 should be MD01-2421/KR02-06 ?
Caused me some trouble when googling papers.
Comment from a non-climate researcher: You are wasting your time. Your last several posts have been wasting your time. Indeed, most of what I’ve seen on your blog is wasting your time.
However, it’s not your fault that you’re wasting your time – indeed it is laudable. The fault is of an insane setup where a paper can be peer-reviewed, accepted, and published by one of the most prestigious science journals without (in earlier times, mostly) archiving all the data, and (these days, mostly) without archiving all the methods and code used to get to the results.
Why in the world should this game of reverse-engineering be necessary?
History will judge whether Mr McIntyres efforts here are a waste of time. I think you may be surprised at just how history will see this in time.
The fact that the authors of this paper have not stepped forward to willingly supply the missing information/code to carry out an easy replication of their ‘findings’ speaks volumes for the integrity of the ‘Team’. Every minute they delay, further drains away any credibility they still have.
It’s a long slog which requires inestimable patience, but Steve and CA colleagues have developed a record of problems (here and also in peer-reviewed literature) which can be examined by anyone who becomes interested in these matters. It is not the fast result of reforming the science and public debates that many of us long to see, but it provides the sound prerequisites for future progress. Just one example, which may be neglected to date but is there in the record for reference when thoughtful people review these matters:
I did not at all mean to suggest the lack of a “fast result” in terms of wider impact as a knock on Steve or fellow auditors, since I think it is remarkable how much had been accomplished in the face of intransigence and worse. I simply offered one kind of response to the comment saying this is all a waste of time and effort.
miker, from the comment I submitted to the journal on Saturday:
“The supplementary material provides no explanation for how the graphs were constructed. Carrying out an averaging of the proxy data yields a graph similar to that in the thesis, quite different from that in the paper. Why was no detailed explanation of the procedure reported? Will the authors supply the code that was used?”
Paul: I posted your letter in a comment at Revkin’s DotEarth and it finally went up this morning. Unfortunately, because of its length I had to post it in two parts, nor did I think to post the second half first so that they would be in order. But they’ve been published. Here’s the link:
http://dotearth.blogs.nytimes.com/2013/03/07/scientists-find-an-abrupt-warm-jog-after-a-very-long-cooling/?comments#permid=103
theduke
Isono reports an NC at BP -21 for KR02-06. ftp://rock.geosociety.org/pub/reposit/2009/2009139.pdf
Is this a related issue?
I had an opportunity to circle back to this comment and a PC instead of an iPad to work from.
Isono reported NC in the Calendar date for his .03m data. I’m no expert in carbon dating but isn’t Marcott’s NaN justified on that basis?
KR02-06 St.A MC1
0.03 -21 22 NC This study
Steve: No. On several counts. The ocean reservoir effect is 400 years and radiocarbon on ocean cores does not resolve cores younger than that. Plus, as you recall, there was a bomb spike in the core. MUCH better dating information than radiocarbon on modern cores. Plus he should get specialist approval/review before redating.
“In order to publish in high impact journals the numbers must keep getting bigger and the outcomes more scary.”
– Julia Heargreaves, senior scientist, paleoclimate group, Research Institute for Global Change (RIGC)
Seems we are starting to see the results of this wild scramble now…
Seems the behavior of these authors, and so many others over recent years, might better be labled as studies in Crypto Climatology.
This is Shaun Marcott:

Interesting pose given that Easter is just around the corner. Just saying.
See how taxpayer dollars are used to fund the activities of Shaun and friends at the following blog: http://blogs.oregonstate.edu/antarctica/
Saving the World, By Flying All Over It (TM)
What the heck? It was mid-summer when they were down there. How come I don’t see one flower or any greenery in all that excessive warmth?
I found the blogposts quite interesting and informational. However, could this paragraph from the blog show weather influencing the author’s thoughts about global warming?
“Before leaving we have to prepare our gear and new rock collection for transport. This basically entails a bunch of busy work where we run around all of McMurdo Station organizing our gear and then packing and repacking it over and over. To add to the complication, the runway here in McMurdo is having extreme problems getting flights out because of the unusually warm weather, which has turned the runway that exists on the ice shelf into a slushy surface. Because of this added complication, few people are leaving the continent, and getting any gear on or off is becoming a big problem. Hopefully we’ll get to leave because it is feeling like the Hotel California sometimes. Luckily, yesterday was quite successful and at least two flight left McMurdo.”
Note: weather is not climate.
I see no problem with field work in the Antarctica. Let’s not be small-minded.
Bernie1815, your right. No problem with field work, but the least one can expect is a certain fidelity to the data gathered from that field work. Duplicitous people sometimes get treated more harshly that they otherwise would.
Actually, field work in the Antarctic is absolutely necessary IMO. It may be a sad commentary on our times that the competition for limited funding might drive a person/professor/department/school to endorse potentially shoddy work to garner the accolades necessary to access this meager funding. Sad times.
There has got to be a better way.
And I agree in principle. But would the effort and airmiles expended be better spent getting the data already gathered in some kind of order first, for instance?
A bit dull all that paperwork, I expect.
page moved..
anybody to salvage on the wayback machine?
Steve/mods,
Might I suggest that the comments and replies regarding Marcott’s photo be snipped.
The fact that they took down that page suggests that Dr. Marcott was uncomfortable with his image being introduced into the discussion. Since the comments don’t add much why not take the high road?
Shaun’s blog posts from google cache, view it while it lasts:
Winding Down:
http://bit.ly/142P9c3
Back in Mactown:
http://bit.ly/16DLPUt
McMurdo Station:
http://bit.ly/XTNlyL
Stuffing It:
http://bit.ly/113v698
Preparing for Antarctica:
http://bit.ly/118riaz
I find it odd they would delete the blog. They are behaving like they have something to hide. They should remember that their research grants are taxpayer funded, therefore all data/text/images related to their research should be made public.
The other thing is, from the blog posts, Shaun comes across as a thoughtful and intelligent guy. I fear that Shaun has become a tool for the hockey team; Mann is definitely involved intimately in this new ‘hide the decline’. I feel sorry for Shaun because this episode may destroy his once promising career in climate research–hopefully he will learn from this episode and do more honest research in future. Hint: run far away as you can from the hockey team and take a statistics class from Steve.
I echo Jeff Norman’s sentiments, there must be a better way. Unfortunately, if you make a deal with the devil, you have to accept the consequences.
Here’s the blog via wayback machine:
http://web.archive.org/web/20130122165915/http://blogs.oregonstate.edu/antarctica/
Hmmm … I thought “disappearing blogs” was simply a Gergis specialty. See: https://climateaudit.org/2012/05/31/myles-allen-calls-for-name-and-shame/#comment-336062
Oh well … that’s life in the CliSci fast-falling lane, I suppose.
Meanwhile over at RC here a is comment in their March open thread.
It is now nine days hence and nothing more said by Mann. It appears crickets have taken total control of the subject at RC.
Perhaps the Mann crew is learning to wait to see how bad the carnage proves to be before adopting a fall-back position, e.g., on how many points can they get away with saying “it doesn’t matter” and on which points will they actually try to mount a defense?
Here’s a handy way to keep track:
http://goo.gl/Cxv3n
Please note accuracy of elapsed time is “indistinguishable within uncertainty”
Is the RC crowd becoming restless? I see 10 days after the subject was first mentioned at RC someone else became curious about the cacophony of crickets.
It is now 13 days of no comment. I think they will have to wait until Steve finishes his audit before Mike says anything at RC. If he ever does.
Since they cannot seem to judge the problems themselves at RC (nor can I, may I hasten to add), they must wait for the completion of Steve, Jean S, et al. analyses so that they know what “case” they need to try to answer.
Excellent point; they need to know which loopholes are closed before attempting to bolt through one.
It was me who asked that at RC, I’m not from RC crowd. The reason I asked was this discussion here but I tried to phrase my question in a way that would let me pass the gatekeepers.
Answer. No. That’s in the Calendar Age BP column.
Note to self – read slower.
The motivation of these people is easy to discern:
New PH.D needs to get world-wide attention in the Mainstream Media, and career enhancement with the Team. Generate scary scenario that agrees with prior BS. Get the headlines; presto–bathe in glory.
Real scientists like Steve McIntyre get no visibility in the MSM. No corrections or retractions, and the public is bamboozled once more.
Meanwhile, the idiots and charlatans at Science and other journals make no waves, and keep their high-prestige positions.
It disgusts me no end.
I agree that the silence from Science is one of the most disturbing aspects to this omnishambles. Either they have been taken for patsys by the authors or they were in on it all along. Either way really is about equally as bad from a PR point of view.
Ah, ‘importation of medieval data’. Every other type has been used to show modern catastrophe. It’s time the Middle Ages pulled its weight.
The removal of the three recent data points of the MD01-2421/KNR02-06 splice is I assume not explained by the authors, despite its drastic effect on the graph? Hard to find words when they haven’t.
‘NaN’ indicates that they divided by zero somewhere along the line. (i.e. they may have missed an obvious mistake in their ‘processing’).
Dividing by zero is what happens when I try to figure out what they have done…
It’s hard to determine the source of the literal string “NaN” in the spreadsheet included in the SI – Division By Zero is just one explanation, dependent on the source material and the route it took before it ended up as a cell in the sheet. Excel itself for instance has different behaviour if you type 1/0 in a cell.
But searching for “NaN” in the worksheets shows missing recent values in:
OCE326-GGC30
GeoB 3313-1
MD01-2421,KR02-06GC,KR02-06MC
Yes, 1.0/0.0 is only one of the many methods for generating NaN’s. It could also be that modern climate science relies on sqrt(-1.0)…
There are only four instances of negative Marcott ages, the least of which is -3.1. I think the formula may return NaN for larger negative values.
That would explain the NaN’s here. It makes sense, though the linear interpolator should have yielded a (positive) 1940 value here.
…, negative ages, ‘would explain’, ‘makes sense’, …
Only in climatology!
Perhaps it’s shorthand for “Not aN increase”
But I like your sqrt(-1) far more – an imaginary uptick
And the sqrt(-1) – when I did electronics theory – is J. Which kinda looks like an uptick.
(Mods: What did I say that was so wrong that had my previously similar comment deleted?)
I agree with miker613. Let Marcott explain his methods. Let him release his code.
As with Mann’s 1998 graph, a variety of choices can be made to draw out a proxy graph, it is almost like a painting, a work of art. Its reproducibility and statistical rigour are secondary to its ability to affirm the choices made in its creation.
Absolutely. After Climategate, all claims about proxies for temperature should be met with utmost scrutiny.
Steve – I don’t see the mileage in this. At best you will put forward evidence that strange things were done to the data which largely affects the temperature region which the authors themselves describe as being unreliable. I doubt there will be enough evidence to do anything other than show that it was an odd thing to do which may not have been standard practice.
In the most uncharitable interpretation they performed a PR stunt to get a scientifically meaningless uptick which would look nice even in the media whist being careful to attach no faith to it in the paper. If true, this certainly raises ethics questions. However, such an ethics issue would be less severe than the original “hide the decline” and nobody in the climate community seemed to care much about that.
I hope I’m wrong.
If I submit my tax return and redate my expenses to show that in my last financial year they outweigh any obligation to income tax, should I expect no censure providing I’ve scribbled a note on the bottom of the return that my calculation may be unreliable?
Yes, Robert, by all means let’s overlook shoddy science as long as at least some part is right. Where do we then draw the line? As long as 51% is right?
Oh, and by the way, if the redating that causes the uptick is wrong, hasn’t it also impact the bulk of the reconstruction which you keep telling us is “just fine”?
If I were you, I’d take my head out of the sand before the empty space in it gets filled with grainy bits.
Begging for mercy will not help, I am afraid.
Re: Robert (Mar 17 13:49),
You say
But it isn’t any more just about what ‘the climate community’ cares about.
It is what the wider world cares about.
And brilliant forensic work like that done by Steve and others is coming to be much more appreciated. Whereas once ‘the climate community’ could give their opinion and have it pretty much accepted without question, nowadays their main function seesm to be to set themselves up for ritual blogospheric dissection.
We saw it with ‘Gergis et al’, we are seeing it with Marcott et al. And Lewandowsky is another whose hubris has led to nemesis.
In UK at least the MSM is finally latching on to the idea that all is not well in the methods and practices of ‘the climate community’, so we can expect the trials and tribulations of Marcott et al to get a far wider circulation.
If you live in the academic world (and your comments suggest that you do) you may see things only through the very narrow prism of papers and citations and tenure and all those academe-only constructs. But rest assured that there is still a huge world out here among the real people who care not a jot for any of that stuff. But do care very much that the science being done on their behalf and which they are paying for is done right.
Steve has done a great job (so far) of showing that – at the very least – Marcott has some serious questions to answer.
And on a slightly facetious note, I propose a new term for committing career suicide by publishing an unreliable paper without having thought through the answers to the obvious sceptical questions….to ‘McIntyrise’ oneself.
Robert,
as I replied to you at WUwT, I agree with many of your comments though often not the nuance. As you have observed on several occasions (and I’m paraphrasing or interpreting here), Marcott et al could have written an article without the uptick and still been able to make many (though not all) of the claims of their article. I have not thus far addressed the validity of their comparison of Holocene temperatures to modern temperatures. It seems to me that there is considerable hair on that calculation as well though I have written about it yet.
My attention was drawn to the uptick because the paper was heavily promoted as a new analysis also yielding a Stick, thereby supposedly “confirming” previous analysis – as though results using contaminated and upside down data could somehow be “confirmed”. (But that’s a separate beef.)
I don’t think that analysis of the uptick is entirely trivial or beside the point. I do not agree that the authors unequivocally described the modern portion of their results as “unreliable”. Certainly no such impression was given in their statements to the press. I do not agree that the sentence in the article on which they presently rely is a clear and unambiguous statement that their modern results are “unreliable”. Had such a statement been clearly and unambiguously made, the course of present discussion would be different.
It is a longstanding complaint of mine that scientists make public statements that are exaggerated or even inconsistent with fine print somewhere in an article. This is not permitted in press releases for mining speculations for good reasons and should not be permitted in academic press releases and statements.
As you observe:
It is hard to imagine that Marcott et al did anything quite so egregious as the original Briffa “hide the decline”. As you observe, no one in the climate community “seemed to care much about that”. I think that it was unwise of the climate community not to care, as I’ve said on a number of occasions. I think that the practice should have been disowned in the strongest possible terms and that this could have been done without drawing and quartering the scientists involved. That’s what I would have done if I were trying to manage the situation from their point of view. By failing to do so, the overall credibility of the community has been diminished and that’s too bad. I made comments at the Heartland conference in 2010 to this effect and they read sensibly still today.
Over the years, I’ve tried very hard to stay away from criticizing articles by young career scientists and to limit my commentary to established figures (Mann, Briffa, Jones, Hansen, etc.) I’m not particularly comfortable with that aspect of the present commentary, though I’m not sure how it could have been avoided, once the article itself got so much play. Marcott unwisely invited this sort of focus by pre-labeling potential critics as a “fully mobilized troll army” and expressing “curiosity” about how potential critics would respond:
There are many reasons people follow you Steve but this is one of the best. It’s an enormous pity Marcott took the route he did.
Marcott and Shakun, in their public remarks to the meda, have dug ther own holes. It is a shame to see two young scientists starting their careers in this way, although in so eagerly seizing the propaganda levers and in uncritically swallowing Mann’s view of everything, they are bringing problems upon themselves.
Regrettable as the Gleick tragedy was, it’s not regretfully sad.
They just dust off a few crumbs and back to the cookie jar.
A small addendum,
There are lots of junior scientists who don’t succumb to such temptations as Marcott and Shakun. Feeling pity for these would be a disservice to them
I look at Marcott and Shakun as possible victims of their years in higher education. They were undergraduates roughly a decade ago. Were they indoctrinated? That was when the global warming enthusiasm was its peak and largely unchallenged—right around the time Steve and Ross had their findings on Mann’s work published.
Were they young, impressionable types who were indoctrinated by their professors? Did no one ever present them an alternative view that challenged the AGW hypothesis? Or was it simply presented to them as the overwhelming “consensus view” wiht all opposition being of the flat earth variety?
“I’m curious to see how the skeptics are going to take this paper.”
I wonder what his curiosity has transmogrified to at this point?
Good question 🙂
A few skeptics that I have read have ‘piled on’ with unnecessary personal comments. But if Marcott is man enough to read carefully and interact directly with McIntyre he is bound to emerge in a very different place. A good road to take.
Re: Robert (Mar 17 13:49) —
Razib Khan wrote a short post about a recently-published study on the genetic history of the Roma (Gypsies). It highlights that other scientific fields have technical challenges that are just as daunting as those faced by Marcot et al. Unlike paleoclimatologists, the community that is exploring “paleogenetics” (1) has recognized major pitfalls, and (2) is addressing them in their specialty’s peer-reviewed literature.
Many of us outside the climate science community aren’t dismayed by the imperfections of their published work, per se. Rather, it is these practitioners’ unwillingness to learn from past errors — that this field chooses to celebrate The Narrative rather than embracing careful data curation, and seeking methods with statistical rigor.
In contrast to non-politicized areas of science, the thought leaders of climatology seem to be determined to set poor examples for their fellows.
Khan’s post is Method well articulated makes for good science.
Echoes of oft-stated points made by Steve McIntyre and others at this blog —
Marcott’s age redating was extraordinarily comprehensive. Of 9480 published dates, he redated 7795. Of the latter, he left unchanged exactly four (4) published dates.
Redating by a few millenia was not beyond his capabilities. The greatest move forward was 1612 years. (Second-greatest has already been noted by S. McIntyre: the importation of the 1008-year-old observation of a particularly high temperature anomaly to the 0-20 year period (1930-1950)needed to supply the modern uptick). The greatest move backward was 3117 years.
http://tinypic.com/r/4opy/6
The Excel file used for the above histogram is in Dropbox:
https://dl.dropbox.com/u/75831381/Marcott%20merged%20data.xlsx
Many of the cores that were re-dated are also used in “Global warming preceded by increasing carbon dioxide concentrations during the last deglaciation” by Shakun, Clark, Marcott, Mix et al. Although exactly the same methodology (Marine09) was used to re-date the cores there are still large differences in the dates. As an example this shows the dating differences between Shakun 2012 and Marcott 2013, for MD95-2043, for the first 100cm of the core.
Steve: the re-dating is only material to the modern portion and unlikely to be relevant to the issues in SHakun et al. This is not to say that there aren’t other issues with this paper. Nor is Mar09 relevant to the dating issues raised in my posts – a point that I’ve made on several occasions.
> Nor is Mar09 relevant to the dating issues raised in my posts
But what is interesting is that the same authors (Shakun, Clark, Marcott, Mix) using the same methodology (CALIB 6.0.1/Marine09) on the same raw data (MD95-2043) produce completely different dates for the start of the core.
PS. You can can find an unspliced MD01-2421 that has been dated using Marine09 here
Re: Lance Wallace (Mar 17 14:04),
Lance, a simple suggestion: if you change the vertical access to be logarithmic, it will allow better understanding of both small and large adjustment values.
OK here is the histogram with the log of the number of observations:
http://tinypic.com/r/311ujgh/6
Nothing wrong with criticism. Its at the heart of scepticism. It should be reasoned criticism though.
If you disagree with me it may be more useful to explain why I am wrong instead of just objecting to my post.
Re: Robert (Mar 17 14:19),
Robert, I think you’re entirely correct in what you say in this comment.
My thought about the “no mileage” comment: in a reasonable world, the (at least) unusual methodology would have been highlighted during peer review, with a requirement that further explanation be given.
The fact that the paper sailed through is reason enough to articulate the issues, require clear cogent response and dialogue from the authors, and hold the review and publication process to account.
If we can’t at least do some significant fraction of that, then your perspective is a reflection of essentially giving up on the scientific method.
AFAIK, at least Stanford Univ is firing up an effort to better understand how the modern scientific method has gone astray. This is the kind of story that ought to helpfully inform such efforts.
MrPete, you have stated well my points in a reply to Robert that somehow got lost. Thanks.
Re: MrPete (Mar 17 17:27),
I seriously begin to wonder if academics are as bright as they like to tell us they are.
Here we have four supposedly clever guys producing a paper with some results that are at least ‘surprising’ and it never seems to have occurred to them that somebody might just raise and enquiring eyebrow and wonder exactly how they were arrived at.
Nor did it seem to cross their mind that a reader might idly pick up Marcott’s PhD thesis on the same topic and note the striking differences. You do not need to be a Nobel Prize winner to imagine that the other eyebrow might become twitchy at this point.
Even a non-climatologist of only average intelligence might conclude that explanation for these ‘interesting’ phenomena will likely be needed. But it appears to be a complete bolt from the blue to our Four Hapless Musketeers. ‘Rabbits in the headlights’ is the expression that springs to mind. After over a week of brick by brick demolition, they have had no response whatsoever. The sensible far-sighted authors would have addressed these points in their paper..and it wouldn’t be unreasonable to expect that even mediocre authors would have had a Q&A pre-prepared with the answers to the likely top 20 objections.
As to the peer-reviewers and peer-review process I think that the exercise so far has amply demonstrated what a laughably inadequate process it is. That no reviewer had eyebrows of sufficient mobility to prevent the paper being published without such explanations is ludicrous.
Anybody from the ‘real world’ who has ever been involved in presenting ‘new stuff’ (as I have) surely views this lack of preparation as shamefully amateur and deeply unconvincing. If the authors really wanted their work to be taken seriously they should have acted professionally and thoroughly from Day 1. Instead they give the impression of not knowing their arses from their elbows.
To get an uptick, just clip a downtick, and make a Facebook fool of the old school. Well done, Shaun: at last a hockey stick every school kid can debunk by just looking at the spastic input data and lack of final spike in it.
Folks keep saying (eg, 1st comment by kr) that Marcott’s paper was published just in time for AR5. Can someone clear this up for me.
My understanding is that papers cited in an IPCC draft report are often not yet published or not even accepted (not even written!). This is entirely tolerated and extremely common. However, if a paper so cited does not reach acceptance by a certain date then it must be removed from the reference list. All papers cited in drafts of AR5 must be submitted by 31 July 2012 and accepted by 15 March 2013. Now Marcott’s paper clearly gets in under the accepted date. However, the trouble is that I don’t recall it cited in the leaked 2nd order draft. And so, I don’t think the IPCC allow a new paper to be added to the reference list so late.
The reason for this ruling on acceptance dates seems to stem back to problems in the 2nd Assessment and strong criticism especially from the US delegation (Watson after Michaels) during the review. But this review missed one particularly paper that was inserted after review. This was a certain game-changing paper by Ben Santer that was absence entirely from the circulated review draft and published more than a year later. I have not heard of this every happening again (but I really have not looked into it). Thus, even if Marcott’s paper were a complete champagne success, I cant see that it would have had any chance of getting into AR5. Am I missing something here?
Bernie, There is nothing in the rules to stop the IPCC authors adding in whatever new papers they like to the final version, as long they are accepted by 15 March. There is also nothing to stop them completely re-writing the text in whatever way they like. This is one of the huge flaws in the IPCC process, and one of the reasons why the whole reviewing process is largely meaningless.
That is a very interesting high resolution temperature proxy. I particularly like it because it reinforces my bias in understanding Holocene climate. I see all kinds of events and the data is noisey enough to have something of a Rorschach effect.
I am pretty sure that I see:
– the recovery from the Younger Dryas, though this is more prolonged than I thought it was
– the 8.2 ka event, a sudden cooling spike
– the Holocene Climate Optimum, when the world was much warmer and apparently better for flora and fauna
– the sudden drop in temperature towards the end od the Roman Empire, when Germanic tribes were able to walk south across the frozen Rhine
– the Little Ice Age
I think I sort of see:
– the Minoan Warm Period
– the Medieval War Period
I’m not sure if I see:
– the Roman Warm Period, at the “right time”
It would be interesting to see this graph annotated with these histrorical events.
Don’t forget the junk data (discussed by Nick Stokes on previous thread) — what are the chances it was included in Marcott’s processing. After all, it was left on their data spreadsheet. If they’d seen it, they would have removed it, right? And if they didn’t see it, then their processing would have picked it up, right? What are the chances their processing included that data? The uptick looks like it includes it. That junk data was archived — it’s ARCHIVED DATA! Who are we to say that Marcott did not use it, when all indications are that he did?
The bomb spike at cm depth on the box core is absolutely damning evidence of either inexcusable sloppiness/ignorance or of willful deceit. The 3cm depth is definitively the 1950s. The core top must be later. It cannot be before 1940 since the first atomic bombs were exploded in 1945.
My supposition is that they did not realize this smoking gun was in that proxy. They evidently did not go back and read the original reference. They just had to disappear a negative proxy, and did so in a scientifically unjustifiable way. Absolutely unjustifiable.
Steve: Bomb spikes are regularly used to date cores. The tritium peak is generally assigned to 1962-63.
Or someone, knowing the radiocarbon spike was in there, knew they couldn’t get away with shifting that one, so deleting the later data was the only (possibly) defensible step they could take that’d give them the needed curve.
Re Rud Istvan Posted Mar 17, 2013 at 2:38 PM: The bomb spike markers in core samples are significant at another level, too. In the 1960s and 1970s, Oregon State University Oceanography Department was at the forefront of marine radioecology, tracing atmospheric testing fallout and Hanford WA radioactivity discharges into the Columbia River to their resting places in marine sediments.
Michael Mann now has 20 or so media articles posted on the Marcott study (on his Facebook page).
Is it possible he’s a bit obsessed with hawking this Marcott hockey stick to all comers, in order to try to shore up his own work and influence?
Impossible! The hockey team has “moved on,” lol.
Marcott et al redated 68 proxies, sparing only the 5 ice cores. Of 7795 observations redated, only four (4) were left unchanged from their published values.
Moving dates by 1000 years or more was not beyond their capabilities. Besides the 1008-year move forward noted by Steve, there was a 1612-year move forward, and a 3117-year move backward. The mean direction was slightly toward making dates older (by only 42 years), with a 10%-90%ile range of -111 years to +232 years.
Can we please wait for a response from the climate rapid response team, it’s going to take some time to further obfuscate the paper.
Steve, will you be ending a letter to the editor of Science regarding this discovery, or will you petition Marcott directly?
Regarding the “junk data” left in the S1.xls file by mistake (one presumes), perhaps further study might show some kind of clue to the authors’ approach. These values appear in ID 64, 65, and 68.
64 A7 Mg/Ca (G.ruber)
65 RAPID-12-1K Mg/Ca (G. bulloides)
68 GeoB6518-1 MBT
For ID 64, the depth goes from 0 to 350 cm and the published age is monotonic reaching about 15000 years. Then there is a hiatus, and the next depth we see is 883 cm, but the published age is now about 11000 years, so a graph produces a double-valued function, with higher temperatures for the deeper section:
http://tinypic.com/r/205qxd2/6
For ID 65, the first section cuts off at 637 cm (12000 years BP, T about 10 C) and then picks up again at 1070 cm (about 16000 years BP with temp showing a whopping increase to 28 C):
http://tinypic.com/r/2ir3ot1/6
For ID 68, a new wrinkle is that the “junk section” is identical with that in ID 65 (depth starts at 1070 cm, etc.):
http://tinypic.com/r/1z5mdrl/6
All of these junk sections have entries in the Marine09 age redating variable, but they are clearly not dates, all being in the range of 4 to 5 (unknown units).
I can see how this would have messed up Nick Stokes’ initial effort, since values of 4 to 5 would put them all in the 0-20 year most recent period, where the uptick appears.
Lance,
Yes, that’s exactly what happened.
I’m mucking through this data, two observations:
(1) EPICA DomeC (#25), DomeF (#27), Vostok (#50), EDML (#61), and Agassiz-Renland (#67) already show temperature anomalies, not temperatures — baselined at 1950AD. So must process these differently than the other data.
(2) Junk data appears in 3 proxy series: (a) 209 valid junk rows in A7 (#64) with avg temperature anomaly of +0.75C. (b) 155 valid junk rows in RAPID-12-1K (#65) with avg temperature anomaly of +16.44C (junk data is from another proxy) (c) 155 valid junk rows in GeoB 6518-1 (MBT) (#68) with avg temperature anomaly of +1.64C.
So if the junk data was processed by Marcott, they would all contribute to the uptick, but RAPID-12-1K junk should have rung some alarm bells due to very high anomaly — unless a maximum cap was applied somewhere.
two IPCC authors, actually! on the Shakun et al.. (2012) paper in “Nature”:
Bette Otto-Bliesner of NCAR is a Lead Author in WG1 for the Paleo chapter
Peter Clark of Oregon State is a Coordinating Lead Author for WG1, the Sea Levels chapter
[and ofc Clark is also co-author on the new Marcott et al. (2013) paper in “Science” …. he was dissertation supervisor for both the Shakun and Marcott PhDs]
What I would like to see, is a list of all proxies, and compared with the thesis, whether they were removed, added, corrected forwards in time, or corrected backwards in time. Moreover, we should have for each proxy a simple shape category, especially regarding the tail, whether it has an upward or downward tail. With these we can summarize them in a contingency table to see whether the changes were independent of shape.
Basically what we have in Marcott et al. is the use of completely arbitrary methods, deliberately chosen to generate a particular outcome.
In short these methods replace and/or truncate data that does not support the politically correct scenario.
Someone must write to “Science” to point out this methodology.
Will an honest climate scientist stand up for the integrity of science?
Mr. (Dr?) Marcott –
You may be finding yourself in the midst of something quite larger than yourself, and perhaps more than a little nervous…? Feeling maybe a bit like a sacrificial lamb? In which case I suggest honesty the best policy with specific and public answers to Mr McIntyre’s important questions.
Its not too late, and YOU are the Senior author, can’t hide behind your Advisors and Reviewers on this one. The responsibility is yours….. All you have to do – is Do What’s Right.
here is some excellent insight it would appear – from the Revkin story (bold mine):
The hype from the NSF – who wrote the check – is regarding the “last century” – the hockey stick. The very section which the authors state was “clearly” noted as not robust.
A.Scott, yes and here is a longer section from the offical press release fed widely to journalists (from Oregon state via Eurekalert), showing that OSU scientists and their NSF sponsor offered this study as firm evidence of temp. change in “the last century” without any hint of “not robust”…. without robust evidence this is merely “science-by-press-release”….
OSU and NSF team up for science-by-press-release
[emphasis added]
Those comments appear almost as though those making them did not read the Marcott et al paper and its very obvious disclaimers. Running through most of these comments is the idea that reconstructions, whether Marcott’s or Mann’s or others have been shown to faithfully reproduce past temperatures and the variations of those temperatures and that comparison with the instrumental record (as opposed to what the proxies show in that time period) is a completely valid exercise.
Lesson to be learned here is that the advocate may well see what the advocate wants to see and unfortunately a scienctist/advocate may be looking as an advocate and not a scientist. I would thus judge that the advocate who wants to believe a foregone conclusion is probably the most susceptible to the misleading practice of tacking an instrumental record on the ened of the series. Notice also that Marcott foregoes a tacked on instrumental record and instead places (somehow) a spike upward at the end of the graph and the believers out there seem to go to great efforts to justify it.
Look at Mann’s comment above where he states, counter to what the Marcott paper states, that the series can show century variability when the authors say 300 years is the limit and with reduced variability for periods of time up to 2000 years. The latest warming period is actually on the order of 40 years.
A couple more seemingly relevant excerpts from the Revkin article (emphasis mine)
Mann excerpts:
Rohde excerpts:
Jeremy Shakun in Revkins comments:
CALIB software is available from http://calib.qub.ac.uk/calib/
I was able to replicate the Marine09 numbers for GeoB5844-2, and it looks like the updated dates are computed using linear interpolation between computed C14 based dates as control points. And from the documentation, “Post-AD 1950 samples cannot be calibrated with CALIB”, which may be a reason why some post-1950 data was just dropped.
So for one of the newly recent cores, MD95-2043 (paper here), the original authors look to have used the first two C14 ages to estimate ages in samples above the first age. 14cm=1527BP and 54cm=3011BP, so 0cm=(1527-((3011-1527)/(54-14))*14)=1007.6BP. Marcott apparently uses a 0cm=0BP assumption is what’s bringing this proxy forward. This pattern looks to exist for other big shifts in dating. The MD95-2043 paper was about matching the core to GISP2 over 50K years, the recent data wasn’t important.
The CSV I used as input for CALIB is here
Steve: As I’ve said over and over, CALIB is not what’s at issue. What’s at issue is the extrapolation to coretops and, in this example, the seemingly arbitrary exclusion of recent data points. CALIB is a red herring for this discussion.
Calib may be a reason for excluding recent data points, since it won’t calibrate dates earlier than 1950.
And the Calib redating changes are generally minor for the original vs new control points, it’s the 0cm = 0BP assumption (which is Marcott, not Calib) that’s causing the large, early shifts.
I’ve processed the data and gotten the 0.8C uptick at the end. But so what, it’s only 18 data points, whoop-de-do. 0.8C changes are routine in the whole data, e.g. 220BP -1.41C, 240BP -0.70C, 260BP -1.28C, 280BP -0.38C. Talk about much ado over nothing!
Wait — I get it. The reason that Marcott generated 1000x perturbations was so that they could generate a data chart that looked like it was robust — as though there were a lot of data — when actually there is nothing. What a show, need clown suits!
NZWilly–
I get 16 observations for NHX alone in the 0-20 (actually about -40 to 20) range. But it is striking how the slope differs using published ages (nearly zero–well, OK 0.1 C per century) compared to using Marcott ages (0.9 C per century). The 0.8 C difference seems to agree with your 0.8C value, although this may be serendipitous since we may be comparing different things.
http://tinypic.com/r/2r3lg5f/6
http://tinypic.com/r/29gflw4/6
Of course the slope is far from significant in either case (p>0.37) and the R^2 value is on the order of 0.1%, so one can see why Marcott says the recent (100-year) data is “not robust”.
…and as I earlier noted, Marcott’s perturbations are done within the age uncertainty — and for the 1950-era that uncertainty is very small. So the 1000 perturbations POSITIVELY FILL UP the data chart at the 1950-end — really looks robust — whilst more diffuse in earlier eras. What phony-baloney.
This business of 1000 Monte-Carlo trials really is phony-baloney.
The premise is that there is uncertainty in the timing of each of the 7700 proxy points from 73 proxy series. Within the parameters of the uncertainty model (Jitter = 150 (of what units?) How many possible configurations are there? There can be only one most correct solution.
What are the odds that a thousand random-walk trials will find it? My educated guess is that 1 in 10^50 is very optimistic. The odds of even getting close are unrealistic. Even if one trial gets close, 999 trials are looking at nothing but noise.
Marcott fails the Nyquist test in design regardless of result.
Perturbations are used here to mechanically actualize the uncertainties, but here the uncertainty dwindles to zero at the 1950 end. Marcott et al used it to smooth out the whole proxy record except for the last, 1950, record. Then all that remained was to select the desired warming signal for that last, 1950, record. Snake oil.
… and lastly, looking at Marcott’s temperature stacks, the first one presented is the “Standard 5×5 Grid” which has amazing smoothness of temperatures up to 1900AD. That’s the 1000 perturbations, of course, crossing over the 20-year bins and smoothing everything out. But for the final bin, the 1940 bin, the perturbations cannot cross over to it because the time uncertainties are so small there. So the 1940 bin has only its own values and nothing from the earlier bins. So all the earlier bins are smooth with each other, and there is a sudden uptick to 1940, and it’s only an artifact of the 1000 perturbation. It looks like an artifact, surprise, it is an artifact. Grr-r-r.
You redacted, I say redated.
What the hell, let’s dance.
I can’t find a reference to the acronym BP. Is that “Before Petroleum”?
It means Before the Present. In this case the present is deemed to be January 1, 1950.
bp = before present. “Present” is conventionally taken as 1950 CE.
Is Isono et al going to be included in AR5, presumably along with Marcott et al? If so,
how do you reconcile the huge differences?
Ah, one more small note, Steve. A simple measure of how much warming was selected for in the 1940 data, is the resultant anti-selection in the 1920 data. Therefore, if the 1940 data was selected for warmth, there should therefore be a ~0.5C dip from 1900 to 1920 — which indeed there is, in the raw data before it gets 1000x perturbed. Marcott’s temperature stacks of course show only the homogenized data after perturbation — with the unperturbed (zero-age-uncertainty) 1940 data sticking out like a sore thumb.
In a way this analysis is “the wrong way around”. Marcott et al. does some stuff with the proxy data, and then draws some conclusions from it. As I understand it the conclusions are:
1] Today is warmer than 75% of the last 11,000yrs
2] The rate of warming today is higher than at any time in the last 11,000yrs.
Now to my mind these two statements are really the hypotheses that Marcott et al. should have started out with, then used the data to either prove or diasprove the hypothesis with an open mind. But the real hypothesis should have been:
1] Data will show that today is warmer than any time in the last 11,000 yrs
2] Data will show that the rate of rise is the fastest in 11,000yrs
After all, so what if it is warmer today than 75% of years going back to the last ice age? What exactly does it tell us? Nothing. So what we need to do is use Marcott’s data to test the REAL hypotheses. For [1], just eyeballing the proxies shows that 90% of the proxies have a higher temp than today. And it looks like the range is from about -3Celsius to about +6Celsius with an average around 2Celcius higher than today. So that would indicate that we are probably some way from any dangerous tipping points, given than no tipping point has been found in the last 11,000yrs(assuming the data has any validity at all) and given that we don’t have any real data showing us where a “tipping point” might be.
As far as [2] is concerned I don’t think that the data going back >100 yrs has anything like the resolution that would be required to make such a bold statement.
I think far too often climatologists are starting without a specific hypothesis clearly stated. They are doing some measurement work, and then doing some statistics, and because they haven’t stated what they are actually looking for they can do whatever statistical analysis they feel like. Then they end up with some graphs and then they draw some conclusions which are actually hypotheses untested against the data. This is all wrong. If they draw some conclusions they should at least test those conclusions against their own data. Certainly it is the job of a reviewer to ensure that any conclusions that are drawn are reasonable when tested against the data.
Paul Dennis has some excellent comments in the “OMG” thread at Bishop Hill. I won’t try to quote an excerpt because I think it’s well worth reading them in the context of that thread.
Whoops. Paul Dennis’s comment is here. Sorry to host and readers for the repetition
Skiphil:
Thanks for noting Paul Dennis’s splendid comment. I do think that he has produced a very nice informed summary of what is wrong with the paper. I particularly liked the following:
We mustn’t torture data to fit an apparent paradigm. One can only guess at what Marcott et al were attempting to do when they made gross adjustments to core top dates. It is one thing to run a new, for example 14-C calibration, that will make small adjustments to age models but a completely different issue to redetermine core top dates by such gross margins.
It would be also nice to know how much Steve’s and others’ work on the paper helped Paul pull his own thoughts together.
However, I think he is somewhat letting Marcott, Shokun, Clark and Mix off the hook. His descriptions of the confirmation bias makes it look more like an understandable transgression rather than serious scientific malpractice. It is the difference in my mind between keeping a valuable ring you found in the street and trying breaking into the Tower of London to steal the Crown Jewels. SteveM has shown us how they tried to do it!!
The really good news is that Paul’s comments will increase the likelihood that Science will withdraw the paper.
! (if True?) via twitter
Watts Up With That @wattsupwiththat
People send me stuff. Word has it that Michael Mann was one of the reviewers of Marcott et al.
wow… IFFF true that would mean that Mann did a Steig kind of pantomime with Revkin, pretending he was just getting acquainted with the paper. But I don’t know how we can ever know, though editors at “Science” do….
My suspicion was that this was added at the request of one of the reviewers:
I wouldn’t be surprised that Marcott’s sudden love for the uptick arose from referee comments too.
Do not count out the NSF program director. She was blustering in the press release and/or some news report.
Given whom it reconfirms the result of, it does sound like Mann or one of his colleagues “requested” that change as well as “strengthening” the “important conclusions”. (Otherwise, why single out just that reconstruction?!)
I’m not sure the NSF director would have cared quite as much about grooming Mann’s ego, but would probably have assumed an uptick in temperature would naturally correlate with an uptime in her program’s funding level.
Carrick, your comments remind me that Steig as Reviewer A of O’Donnell et al. Steig asked that language be changed to mitigate criticism of Steig et al – needless to say, with the authority of an anonymous reviewer rather than a party to the dispute. I am very strongly of the opinion that conflicted reviewers should disclose such conflicts to authors so that the authors can respond appropriately.
Steig also pantomimed surprise even though he had been Reviewer A – as (if reports are right) Mann is doing in the present case.
I was asked last year to review a manuscript by Wahl and coauthors and submitted a signed review that clearly noted that I had strongly criticized that type of article in the past and that the authors were entitled to be aware of this in their response. My own experience has been that editors ignore my review comments even though I try to provide review comments within the context of the author’s enterprise, misguided as I may feel that enterprise may be, rather than trying to impose my own views of what his enterprise should have been.
Make that “uptick in her program’s funding level.” 😛
Carrick (2:24 PM): “why single out just that reconstruction?”
Mann et al. 2008 (specifically the CRU-EIV reconstruction) had a privileged place in Marcott’s thesis, being the only one shown in figure 4.2. [Other reconstructions appear in figure 4.3b&f.] So I don’t think that one can fairly attribute that preference to the journal review process.
HaroldW, thanks. I went and located his thesis (for some reason the comment that included the link got moderated), and it does appear he leans on Mann’s workout, so the comparison makes a bit more sense now.
I will say it still lacks the details to know what he’s actually done, which for a thesis, kind of floors me.
On Facebook Mann writes,
Slate and MotherJones featured write-ups promoting the Mann-Marcott confirmation, both cited by Mann.
Paul’s comment in here, as I just said on the previous thread.
I don’t see any comment from Paul Dennis at Bishop Hill OMG. Are you referring to Paul Matthews?
Never mind, got it.
-1
Never thought I might defend M. Mann or E. Steig, but as a reviewer of many journal articles over the last 40 years, I have taken seriously the prevailing convention of anonymity. So one is placed in a dilemma if one is asked to comment on an article of which one was a reviewer. If you say you were a reviewer you are violating the pledge of anonymity, but if you comment without revealing that fact you are in a conflict of interest. I guess the proper response is “No comment”, but the desire to say something, particularly if it was in your review but ignored by the author, may be irresistible.
Lance,
I don’t think the ethical and professional failing in either case (Mann or Steig) is making any public comment on a a paper one has reviewed anonymously for the publishing journal.
IMHO, the problem arises in both cases from (1) the deceptive pretense in both cases that one is just now encountering the paper, and (2) taking especially strong positions in public controversy when one played a crucial anonymous role in how the paper came before the public.
I.e., neither Mann nor Steig had any reason to LIE about not having encountered the papers previously. In each case it was a perfectly gratuitous deception, because they each could have simply commented on the paper in question without any pretences. Although we see lots of squawking from climate scientists about doubting their integrity, in these two cases Mann and Steig showed an ease with deception for no good reason at all.
In the current case Mann is loudly and frequently flogging the paper rather than simply stating hs scientific assessment of why he approves of it.
In the Steig/O’Donnell case there were of course further issues about Steig as an interested and hostile reviewer criticizing in public a revision which he had urged in private as an anonymous reviewer.
That is IF Mann were an anonymous reviewer of the Marcott et al. Paper, which I do not know to be true (it has been rumored, it seems plausible, and we are waiting to see it will be denied or not.
Thank you Steve for laying this all out for us. (Sorry for my mis-speculation on the matter). Sadly, the end result of this is that the Team gets to cite another ‘peer-reviewed’ manuscript which ‘validates’ their hockey stick (I guess it does validate their method, their ‘tricks’ can make hockey sticks out of any data). I would never imagine to manipulate my data this way. If I could omit and ignore inconvenient data, I could publish a lot more than I do. This is just stunning. IPCC will cite this above many others. Sadly, I’ve stopped being stunned by this crowd anymore. Sad state climate science is in.
Regarding NaN
This is actually an IEEE designation, not Microsoft. In the context of excel, Microsoft says the following:
“Not-a-Number (NaN): NaN is used to represent invalid operations (such as infinity/infinity, infinity-infinity, or the square root of -1). NaNs allow a program to continue past an invalid operation. Excel instead immediately generates an error such as #NUM! or #DIV/0!. ”
http://support.microsoft.com/kb/78113
NaN gives me flashbacks to FORTRAN.
It would be fun to have another FOIA to get us The Team’s e-mails after these posts be Steve 🙂
It remains to be seen whether the FAQ will, in fact, be a FAQ, or whether they will attempt Mannian bluster.
Further questions that I think could be considered ‘frequently asked’:
1) If their redating and smoothing of historical low-resolution data made a dog’s breakfast of the 20th century numbers, why report modern era findings at all?
2) What changes if any were made to the paper in response to Science reviewer critiques, and did these changes materially affect the conclusions of the paper?
2) …in response to Science or Nature reviewer critiques…
If history is any guide, it will likely be notable for what it does not say. Revkin mentioned this morning that he is trying to get some kind of communication going between ClimateAudit and Marcott et al. I’d be interested to know what that is about.
But we can hope there will be a forthright and open exchange of views and information. As they say in the vernacular, “they gotta lotta splainin to do.”
Above was a reply to JEM . . .
Who appointed Revkin as the great mediator in climate science. He has given skeptics nothing but grief even when a rational and objective mind would give credit.
Damage control, I guess.
Steve: I don’t think that he regards himself as a “mediator” but is one of rather few people who is even acquainted with all the relevant parties. He is concerned about climate change, but unconvinced by “skeptic” arguments. Nothing wrong with that.
Of course Revkin is welcome to his views on AGW, but my problem with him is that he appears to rely less than independently on the scientists/advocates for his talking points. It would be better in my view to have someone doing what he is doing who could think more independently.
McIntyre, you http://www.datathief.org/
Seems like this will save you alot of manual labor
The final joke about the Marcott paper is that, having constructed a process to shield the 1940 data-bin from cross-pollination from its neighbors, that bin (regardless of its actual contents) can be held to show the heat of the dust bowl years only — nothing to do with CAGW. Strike 4!
The plot you’ve posted bears a striking similarity to reality. Probably no real surprise. Responsible Climate Change professionals would view that plot as a wake up call. What goes up … must come down.
Should the text “-41BP (1991AD)” be “-41BP (1909AD)” (1950-41)?
Thanks.
Steve: No.
Calib cannot calibrate post-bomb radiocarbon dates. There is no post-bomb marine calibration curve in general use.
I don’t know if they used Matlab, but it will generate NaN if you pass the interp1 function lookup values outside of the input table range unless you pass in the ‘extrap’ parameter.
I just looked more closely at Mann’s comments to Revkin re Marcott et al.
Here is a list of prevaricating phrases taken from the five paragraphs in which he was quoted, listed in the order they were written (all bolds mine):
Courage personified 🙂 Great extraction.
Potter: Those are NOT “prevaricating phrases.” Prevarication implies lying. These are not lies; they are what is known in the trade as “weasel words,” and, as such, are likely legitimate. Usually.
Jorgekafkazar, is that perhaps a legal definition? Is it all but an accusation of lying? Or is there a nice subtlety here? Oxford dic rewarded my understand that the use of weasel words would often be a case of prevarication. Oxford uses the example “he seemed to prevaricate when journalists asked pointed questions” And it says it is from the Latin praevaricat- ‘walked crookedly, deviated’. I would say that the IPCC became very good at prevaricating phrases over the years and this has done as much damage as outright lying. For example when they were asked the question: Has warming been detected? they answered that the balance of evidence ‘points towards a discernible human influence.’ This looks like a ‘yes’, was taken as a ‘yes’ but the scientists could allow themselves to say it when they knew that the answer was not ‘yes’ because the phrase could easily be argued to be a ‘no’. When we find in Mann’s gush of support such phrases as ‘One gets the sense from looking at their reconstruction..’ we see that it works in a similar crooked and evasive way. Neither is outright lying. For me the thing was that I myself hardly even noticed it in Mann’s comments. Clever work by Dr Mann! And thanks for pointing it out Pottereaton. Great collection.
Thanks, Berniel. Although it’s a quibble, jorgekafkazar has a point. Perhaps “equivocating” is a better word than “prevaricating” in this instance. But they are synonymous in some dictionaries.
The point is that Mann is being very careful with his language and that’s probably because he’s been caught being loose with the truth so many times. You know he’d love to give this paper a full-throated endorsement, and probably did, if he was a reviewer. Does he believe the paper does not perform as advertised? How could anyone not believe that at this point?
Steve McI, are there any proxies that meet the requirements set out by Marcott et al but were not included in the 73? If so, why not? Perhaps this might be a question for the promised FAQ, although I suspect you may be able to answer it without waiting that long.
For people interested in the histories of individual proxies, I have posted an active viewer. It picks out curves in a spaghetti plot, and shows the metadata and location.
Brilliant, Nick, thank you.
Congratulations are in order.
How about if we could click the plot and/or map as well and have the nearest proxy selected? I appreciate that requires a somewhat algorithmic approach.
Thanks all for the kind words. DaveA, the rainbow color gives a rough idea of where to look, but yes, clicking on the plot would be nice. The algorithmic aspect could be done, but would require downloading the numerical data – at present it just downloads pre-drawn bitmaps.
That is a very interesting display. Its is a nice way to look at individual proxies. It would be nice if you could select more than one for highlighting. Just exploring things shows up some interesting points. For example proxies 47 and 48 are very close geographically but have very different temperature profiles. That seems very odd.
Eddy,
Thanks for that suggestion. It’s late here now, but I’ll add it tomorrow.
Nick:
Very nice job. It certainly helps pull everything together. My assumption is that Marcott et al would have done something analogous at the beginning of their study simply to see how things look. If they did then how did they come up with the idea of an modern era uptick?
Nick Stokes,
Wow and thank you very much.
After reviewing these proxies, I find it hard to understand how anyone could draw any kind of conclusion from them. My understanding of the impact of the ice age on global weather suffered a blow. Perhaps there is no such thing as a global climate, the world after all is a big place.
Nick, I would hope your methods of showing individual proxies in that manner could be used by blogs like Real Climate. Have you offered to post these active graphs there? You did the same with some spaghetti graph reconstructions awhile back and with/without the instrumental record attached to the end. What a difference an active graphic makes. Thanks much.
That’s a nice tool. There is a pretty remarkable similarity of values between 4000 and 6000 BP. Would that be expected for any (good or bad) reasons.
Nick:
#19 and #20 appear to have the same label. Are they distinct proxies? The metadata suggests different authors but the same location. The profiles are certainly different.
Nick:
#8 and #13 are also duplicate labels but different profiles.
Nick:
Sorry to be a pain – also #21 and #22.
Bernie,
I took the labels from col B of the metadata sheet of the Marcott spreadsheet. #21 and #22 are duplicated there, as are #19, #20 (also in the pdf). I think the label is the core, and in those cases different constituents were analyzed. In each case one is UK’37, one is TEX86.
Some labels I had to shorten to fit into the table, but the full version should be shown on the right when you click. I probably overdid it with #13, which had more info, but I showed just the first component, which is also #8. Again the full label appears when you click. But I’ll fix that.
Nick – Steve McIntyre indicated that the duplicates reflect the use of different proxies by different authors using the same core. Sorry if I caused any extra work.
Bernie,
Sorry, I missed this when I replied. No problem – I’m glad to have sorted it out. Thanks for noting it.
Very cool Nick … this is something you should package and offer as a tool (or perhaps a “service”) to others. I suspect many folks/web sites would pay for a tool like this.
Two possible suggestions for enhancements; (1.) The ability to select (a.) what proxy’s to display in the spaghetti, and (b.) an ability to select multiple proxy’s for the black line (and maybe sub option to show as individual black lines or as a single average), (2.) make the black line “interactive” – ie. when you hover or click on a point it gives the data and date
Re: Nick Stokes (Mar 19 04:09),
Excellent plot. The click feature to highlite individual proxies is great. I went thru all the proxies one by one and see nothing to support the uptick in Marcott et al. It certainly isn’t supported by the graphs. If it was, it should appear regularly in a fair percentage. It doesn’t. The newer data is all over the place with no consistent trend.
Nick:
If you recall I mentioned that there were three pairs of proxies developed from the same cores, MD95-2011,74KL, NIOP905. The last two cores are both analyzed using TEX86 and UK37. However, thanks to your tool, the profiles are very different and the records do not correlate with each other at all for either core. This was confirmed by Huguet’s thesis (http://igitur-archive.library.uu.nl/dissertations/2007-0918-200439/full.pdf ) See Part III SST in the Arabian Sea …
It may be worthwhile to separate the proxies by method since in these two cases at least it is hard to see how both methods can retain their validity. It is hard for me to see the basis for aggregating them.
Bernie,
I’m no expert on the actual proxies. My take from the graphs is that TEX86 is noisier than UK’37. People speak well of alkenones as proxies – maybe that’s what we’re seeing here.
Nick:
I am no expert either, but the divergence in the two interpretations of the temperatures for the same locations is difficult for me to fathom. Either drop the TEX86 or UK’37. Keeping both makes little sense. Huguet is quite clear about the divergence though he(?) struggles to explain it:
Hey Nick Stokes (Mar 19, 2013 at 4:09 AM) – way cool! Someday this type of tool will be built in to the papers!
Re: Geoff (Mar 19 04:19),
Geoff is right. It’s a great way of visualising the data. Thanks Nick!
I wonder how long it will be before the academic establishment get their mindset kicking and screaming into the twenty-first century and start to exploit all the wonderful tools that computers and the internet have given us to interpret the world around us?
The current way of academic publishing is barely changed from that which was the leading-edge technology of the 17th century. And many of the conventions (word limit, limited diagrams, lengthy but inadequate review process etc) evolved to suit the limitations of that technology. The world has moved on…but academia has not. It remains a deeply conservative institution.
BTW – at a quick glance through the datasets, I couldn’t find a single one that showed the 20th century uptick. Did I miss something, or is it genuinely not there at all as our host suggests?
Thanks, Latimer. I’ve updated the plots – originally I had stopped at 10 BP, but now I’ve allowed negative values, since I’ve plotting published dating. I don’t think it makes much difference and yes, I haven’t seen upticking proxies. Few have enough time resolution to expect this.
Nick, brilliant effort.
1. You should be able to do the same with Marcott ages replacing published ages. Then the two graphs could be compared (blown up) for the first hundred years, perhaps for NHX vs SHX vs tropics (since the effect seems strongest in the NHX).
2. Any reason why you stopped at about 12000 BP? I know that data gets spotty beyond that, but some proxies go back to about 20,000 BP. Of course, this period is of less interest than the most recent 100 years–still, showing all the data could be useful.
I’m posting this question again b/c it really intrigues me.
There is a pretty remarkable similarity of values between 4000 and 6000 BP [in Nick Stokes’ spaghetti graph tool]. Would that be expected for any (good or bad) reasons?
Is there any theory that predicts much lower natural variability in that time frame? Is it an artifact of a selection process?
OTOH, it seems to be lost in the earlier post that separated the NHX and SHX recons.
The series were centered on about that period. That means they were forced to have the same average for it. That’s all you’re seeing. If they had centered the series on a different period, that different period would have the same similarity.
Nick –
Adding my voice to the chorus of appreciation. Do you have code which you can release, which would allow this technique to be used for other datasets? I was looking yesterday at CMIP5 runs, which present much the same sort of tangled pasta. It would be helpful to be able to highlight one curve (or a couple), and also to zoom in on areas of interest.
Ah, centering. Thanks. And the reason is looks like much greater variability on either end is just that many go up while many go down over the entire lifetime. Got it.
HaroldW,
Thanks. I’ll write a section on methods under the plot. Basically it requires that in R you make the spaghetti plot, and then with the same parameters but almost everything omitted, you make 73 plots with just the relevant black line. The Javascript overlays these as requested; the only thing that is really problem (or really layout) specific is turning the label location into an index, which could be made general.
Lance,
Thanks too. Yes, I think the age contrast would be useful, but only on a graph of recent times – I don’t think much would show clearly on the full 11300 years. The main reason why I didn’t go further back is that it does get ragged, which means I’d have to compress both scales to get everything in.
Thanks Nick. Excellent explanation; I understand the approach. Unfortunately, doesn’t lend itself to dynamic pan/zoom. 😦
HaroldW,
I have now posted the code. There are input files (eg HTML) to make it run.
It’s getting boring saying it but you’re doing everything right, Mr Nick. Many thanks for this.
Thanks Nick! It looks straightforward enough. I should have a chance to play with it this weekend.
Nice visualization work. Thanks for posting the code.
Harold,
For zooming, you might find the climate plotter useful. You can enter your own data, and plot combinations of curves, changes scales etc as you wish.
I tried that. But on this machine, it just stares at me and tells me that my browser (IE8) doesn’t support the canvas tag. I’ll try it later on another computer.
Latimer – not just in academia. I work with aviation engineering data, and its visualization has, if anything, regressed thanks to the total domination of Powerpoint. At least old-fashioned academic print graphics contain detail in plots and tables that encourages and rewards further study. Powerpoint eliminates detail and replaces it with childlike block lettering and cartoonish pictures that hide information rather than reveal it.
Very nice work, Nick.
Two ways software can be used: to hide or to reveal. Thank you for that title of a presentation I will soon give, but not using Powerpoint 🙂
(Showoff with Ruby has been nice and there’s no doubt more of the same coming to one’s browser with CoffeeScript. Open source all the way down, with the reader able to drill down to their heart’s content. But whatever the tool, the intention is the key. Thanks for this insight, triggered by Nick’s example.)
Navy Bob:
Edward Tufte of data visualization fame has a great anecdote about your very point. If I recall correctly, he contrasts a 100 or so power point presentation with the actual flow charts used by the scientists and engineers to analyze the Challenger disaster.
I went to Google and checked. Here is an article on your very point (http://www.scientificamerican.com/article.cfm?id=the-feynman-tufte-princip ) The author writes:
As Tufte poignantly demonstrated in his analysis of the space shuttle Challenger disaster, despite the 13 charts prepared for NASA by Thiokol (the makers of the solid-rocket booster that blew up), they failed to communicate the link between cool temperature and O-ring damage on earlier flights. The loss of the Columbia, Tufte believes, was directly related to “a PowerPoint festival of bureaucratic hyperrationalism” in which a single slide contained six different levels of hierarchy (chapters and subheads), thereby obfuscating the conclusion that damage to the left wing might have been significant. In his 1970 classic work The Feynman Lectures on Physics, Feynman covered all of physics–from celestial mechanics to quantum electrodynamics–with only two levels of hierarchy.
Thanks Bernie. Tufte is my idol. Nick’s display exemplifies his principles – overall graphical shape showing big picture view for trends (all over the place in this case, which is an important point) with the ability to drill down to extract an enormous amount of specific detail. It’s really a masterful job.
That SciAm article linked by Bernie also has this gem, which I think highlights the kind of insights into the real meaning of data which Steve pursues:
[emphasis added]
sorry, last paragraph in the blockquote should have come after the blockquote, those are my words not the SciAm article….
Ironically, that SciAm article is by Michael Shermer who is a rather fervent alarmist/conventionalist about climate science. Maybe he can be convinced to re-examine his beliefs about climate science in light of his advocacy of skepticism and rigorous data handling.
Has anyone else taken a look at the rest of Nick’s Moyhu site? Take a look especially at his climate plotter. Sorry for digressing so far from Marcott, but he’s done some incredible data visualization work.
Here’s my hypothesis.
Paper, as originally submitted to Nature, lacked the “blade”.
Rejected as not adding anything new.
Submitted to Science, same thing happens.
Some bright spark decides it needs “Sexing-up”, the blade is tagged on; with Marcott’s rider about the last 60 years not being reliable, added because he’s embarrassed by the manipulation?
While trying to convert the Marcott-2013 S1 Excel data sets into an SQL database, my import script spotted a missing value (and also a duplicated row) within “MD79-257”. As I moused over their “Published Temperature” and “Published Age” values, I became aware that the underlying, unformatted values are of a remarkably high precision. For example, the first value of “Published Temperature (yr BP)” is 1553.72251908109, implying a precision of 300 micro seconds.
I therefore looked into their SI for an on line data source:
Following their criterium no. 5, I checked h ttp://pangea.de and h ttp://gcmd.nasa.gov for MD79-257, with a negative result. Although I found, e.g., Bard 2003, the available series reflect different approaches. I then followed their reference 39 (recte: Levi et al, 2007), but again the temperature series were not among the supplemental information nor were they tabulated in the paper.
However, a graph created from Marcott’s columns “Published Proxy Foram T.F. (warm season)” and Published Proxy Foram T.F. (cold season)” closely matched the first 15,0000 years BP of Levi’s Figure 3b.
Thus their highly precise values stem from the process of scanning a printed diagram (which indeed was “provided by the authors in a non-proprietary form”). Anyway, the other day I found that they applied the very same method for the depth – age relationship, this time using Levi’s Figure 2. Figure 2 shows a depth versus age model based on C14 data which are published on line in Levi’s S2. This data set contains relatively few samples and starts in course steps: 0, 50, 100, 250 cm …, relating to C14 ages of 2070, 4100, 6180 and 7820 years BP, respectively. Hence, Marcott’s “Published age” is a graphically resampled version of Levi’s age model, using sampling intervals of 5 and 10 cm. This is obviously how they met their proxy selection criterium no. 1: “a sampling resolution typically better than 300 years”.
The majority of control points of Levi’s age model lies between 10.000 and 15,000 years BP, where their C14 data are more dense. I thus suspect that the Marcott approach inadequately narrows the error band for the most recent values.
There appear to be more data sets ripped off diagrams published elsewhere. Other suspects are contained in the Excel tabs “MD98-2165”, “JR51GC-35”, “MD95-2043”, “MD39-008″,”GEOB 7702-3”, “EPICA DomeC”, and probably many more.
Levi et al 2009 is online at h ttp://onlinelibrary.wiley.com/doi/10.1029/2006GC001514/abstract
Steve: nice spotting. Faux precision is an excellent indicator of scanning.
Hugo: Well spotted. This is very intriguing. Manipulation seems to come in all shapes and sizes. It certainly should be the basis for a question in Clark’s promised FAQ piece.
The lack of respect for data integrity and quality in the climate-science field would kill people if applied in many engineering disciplines.
JEM, shoddy climate science IS killing people–via government policies that are driving up energy and food costs, reducing the standard of living of many. Poor senior citizens have frozen to death in the UK because they couldn’t afford the high gas prices. In Africa, villagers have been driven out of their homes to make way for the creation of “carbon-capture” forests. Biofuels have driven up the costs of basic food staples like corn and caused food shortages. So let’s be clear: Shoddy climate science is guilty of many cruel economic crimes.
There are some interesting values in KY07-04-01 as well, e.g. 516.1710526. While I can’t say anything about the possibility of scanning from a hard copy, such floating point values can also occur if some intermediate calculations had been performed on the values given computers’ inability to represent all decimal numbers. Something to keep in mind.
Steve: Sinan, nice to hear from you again.
Lake Njulla also shows signs of redating. Laroque’s sediment data is available. Interestingly for Njulla there is no constant resolution in Laroque’s original archive data and it is certainly not 190 years as Marcott et al appear to indicate.
Thanks Steve. I am very happy to be here. We’d be lost without your blog.
I have also been trying to get all proxies into a single data set. While parsing the Marcott.SM.database.S1.xlsx file, I noticed that some sheets have extra data tucked away below the fold.
For example:
I don’t think these matter in the grand scheme of things, but they may trip up automated processing.
Steve: others have noticed those as well. I have a collation of the spreadsheet as a downloadable r-list at climateaudit.info/data/marcott-2013.
Reblogged this on Climate Daily.
The paper is being revised?
From Jeremy Shakun’s page,
Marcott, S. A., Shakun, J. D., Clark, P. U., and Mix, A. C. A reconstruction of global and regional temperature for the last 11,300 years. Science, in revision.
http://www.people.fas.harvard.edu/~shakun/
Steve: No. His webpage is not up to the minute and is from earlier than march 2013.
Ah, there we are, “Science, in revision”
Revised to add the blade?
Hah! There is some additional fun in Marcott’s main plot (Figure 1A). Mann’s hockey stick there is the global EIV-CRU from Mann et al. (2008), which means that there is no actual reconstruction post 1850, since it’s the Reg-EM produced EIV reconstruction! So they have now essentially “grafted the thermometer record onto” Mann’s reconstruction. To his credit, Mann has always been careful to plot the post 1850 part in EIV reconstructions in a different color. He is actually explicitly warning in his data description spreadsheet that the values for 1850-2006 are instrumental data.
So in Marcott et al Fig 1A we have a comparision in the interval 1850-1950 between their reconstruction (uptick) and Crutem3 (LAND only) (annual?) intrumental record (no uptick). But that’s not all, folks! See the associated uncertainties … Mann et al (2008) uncertainties (which seem to match in the plot to those given in the spreadsheet, i.e., 2 sigma, whereas Marcott et al uncertainties are 1 sigma) are naturally calculated only up to 1849 (as there is no actual reconstruction afterwards), but in the Figure 1A they continue all the way to the end. Where did those 1850-2006 uncertainties come from?
Jean S, hmmm, Anthony just made this a head article on WUWT after I quoted you, hope you don’t mind the added attention….. ha.
I finished reading through the threads here and went to WUWT and almost immediately followed a portal back here.
Well done Jean S.!
Recapping:
Funky redating and graphing as Steve is researching in detail
Odd grafting; yet to be fully delved and divulged
Perturbing data a thousand times; yet to be fully delved and divulged.
Code, oh code where is the actual code? Are there secrets in the code?
Re: Skiphil (Mar 19 19:14),
No problem. I left the following comment to WUWT:
Here is a close-up from Marcott’s Figure 1A:
Since Mann denied in 2004 that anyone to date had done such grafting, in the context of rebutting criticism, can we infer that he agrees it’s a bad idea to present such an undisclosed grafting of the instrumental record onto a proxy record?
Mann on grafting a thermometer record onto a reconstruction
To those waiting impatiently for Dr. Clark’s FAQ, I propose McIntyre’s First Law:
The time required to create the FAQ is proportional to, and always greater than, the time required by McIntyre to formulate the Q.
T(FAQ) = T(McIQ)^2
17 Trackbacks
[…] Hiding the Decline: MD01-2421 […]
[…] Hiding the Decline: MD01-2421 (climateaudit.org) […]
[…] Full story […]
[…] AGW proponents must be reeling from McIntyre’s takedown of Marcott et al, because I watched the most hilarious smear genesis unfold this morning a few […]
[…] decade. This year, he takes aim at the latest nonsense, from Marcott et al. On his blog (Climate Audit), he explains how the timing of the data was manipulated – in one case, a dataset was moved […]
[…] decade. This year, he takes aim at the latest nonsense, from Marcott et al. On his blog (Climate Audit), he explains how the timing of the data was manipulated – in one case, a dataset was moved […]
[…] Anthony Watts, on his Watts Up With That blog, summarizes the work of climate-science watchdog and data analyst extraordinaire, Steve McIntyre. McIntyre figured out how the “hockey stick” scientists “hid the decline“. […]
[…] Romm is sooo entertaining these days. Yesterday, when I pointed out to him McIntyre’s takedown of Marcott et al, he came to the immediate conclusion that I was an “instrumental record denier”, […]
[…] Source comment here […]
[…] […]
[…] But, this comment was in a thread which discussed a comment from Steve Mac’s Climate Audit from Jean S…… […]
[…] https://climateaudit.org/2013/03/17/hiding-the-decline-the-md01-2421-splice/ […]
[…] Hiding the Decline: MD01-2421 (climateaudit.org) […]
[…] did not discuss or explain why they deleted modern values from the Md01-2421 splice at CA here and here. Or the deletion of modern values from OCE326-GGC300 as asked […]
[…] did not discuss or explain why they deleted modern values from the Md01-2421 splice at CA here and here. Or the deletion of modern values from OCE326-GGC300 as […]
[…] did not discuss or explain why they deleted modern values from the Md01-2421 splice at CA here and here. Or the deletion of modern values from OCE326-GGC300 as […]
[…] Hiding the Decline: MD01-2421 […]