In today’s post, I’m going to show Marcott-Shakun redating in several relevant cases. The problem, as I’ve said on numerous occasions, has nothing to do with the very slight recalibration of radiocarbon dates from CALIB 6.0.1 (essentially negligible in the modern period in discussion here), but with Marcott-Shakun core top redating.
Marcott et al re-dating appears to originate from the following:
Core tops are assumed to be 1950 AD unless otherwise indicated in original publication.
MD95-2043
The most recent radiocarbon date for this core was at 14 cm. The radiocarbon reading (1980) was converted by the authors using CALIB4.1to 1527BP. Marcott showed CALIB 6.0.1 upper and lower bounds, the average of which was 1535BP. Marcott showed a date of 1535BP for the alkenone sample at 14 cm. The differences between CALIB4.1 calibrated dates and CALIB6.0.1 calibrated dates in the last two millennia are negligible – single digit years.
The sedimentation rate between the final two radiocarbon points of MD95-2043 was 26.7 cm/kyr. The original authors (Cacho et al 1999;2001) dated samples above the most recent radiocarbon date by assuming a continuation of these sedimentation rates, thus interpreting the top 14 cm as covering the period from 1537BP to a coretop of 1007.6 BP. This implies core loss from the piston core of about 26 cm, a fairly typical result. (Box cores are used when recovery of surface sediments is desired.)
In contrast, Marcott et al 2013 dated the coretop to 0BP (1950 AD) and interpolated dates back to the radiocarbon date at 14 cm. In effect, Marcott et al presumed that the sedimentation had fallen to one-third of previously observed rates (“unprecedented”?). The difference is shown in the graphic below, which compares the age-depth according to the original authors to the age-depth of Marcott et al. It shows that there is negligible difference between published and Marcott radiocarbon dates.

The next graphic compares the temperature estimates using published dates to temperature estimates using Marcott et al dates. The two are essentially identical up to just before AD500. But whereas the original authors date the next few cm to late first millennium, Marcott et al dilate the data to go from AD500 to AD1950, reassigning the core top from AD943 to AD1950.
Marcott state in their archive – in my opinion, with unwarranted optimism – that there is zero uncertainty in the 0 BP dating of the core top.

Figure 2. MD95-2043 Temperature Estimates.
I do not take the position that non-specialists such as Marcott, Shakun, Clark and Mix are precluded from arguing that core dating by the original authors was incorrect and proposing their own alternative dating with the reasons laid out in the sunshine for relevant specialists to assess. However, that’s not what happened here. There was no listing of re-dated cores with the before and after core top dates. The only hint of anything going on with core tops was the following statement in the SI:
Core tops are assumed to be 1950 AD unless otherwise indicated in original publication.
This seems innocuous enough on the surface, but that’s not what Marcott et al actually did. For example, here is an excerpt from the NOAA MD95-2043 archive, where the core top is indicated to be 1007.6 BP.

MD95-2011
That core loss at surface in piston cores can be 26 cm or so should not be any surprise. Indeed, it seems to me to be a credit to the carefulness of the drillers that core losses are as low as this. Core loss in piston cores can be approximately estimated if there is a contiguous box core. (Box cores don’t go as deep as piston cores, but have much better recovery of near-surface sediments.)
MD95-2011, used twice by Marcott et al (#8 and #13), is another piston core, but in this case, there is a contiguous box core JM97-948-2A. These cores were discussed at CA in 2007 in connection with Loehle 2007. At the time, Richard Telford mentioned that he thought that alkenone results for JM97-948-2A had been measured but not published. They remain unpublished six years later: this is too bad as this would have provided an important addition to very scarce high-resolution alkenone records.
Pb210 dating confirmed the modernity of the top 10 cm of box core JM-948-2A, which was dated from 5-80 BP (1870-1945AD.) At 30.5 cm, box core JM-948-2A had a radiocarbon calibrated date of 579BP (radiocarbon 940BP), while MD95-2011 had a near contemporary date at 10.5 cm (601 BP – radiocarbon 980 BP). The data from the box core clearly indicates core loss of somewhat more than 20 cm at MD95-2011.
The original authors dated the 10.5 cm of MD95-2011 above the latest radiocarbon date to approximately 50 years, assigning the core top to 510 BP. In contrast, Marcott et al assigned the core top to 0 BP, using the same methodology as MD95-2043. This is illustrated in the age-depth comparisons shown below.
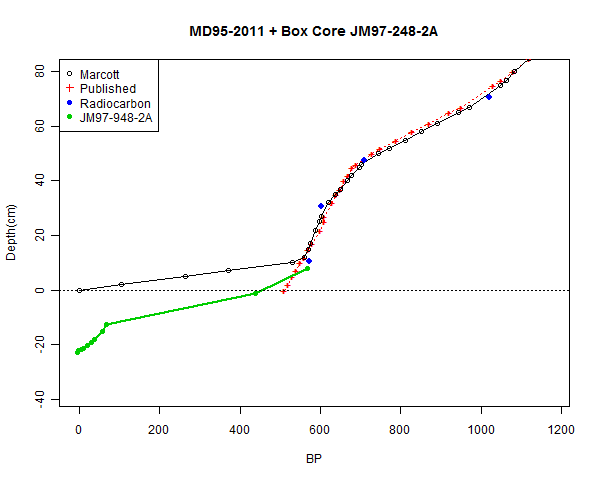
Figure 3. MD95-2011 and JM97-948-2A age-depth diagram.
As with MD95-2043, the Marcott re-dating dilates the time series after 560BP, so that data assigned by the original authors to 510BP is Marcott-dated to 0BP.
MD01-2421 Splice
The above two examples illustrate one face of Marcott et al re-dating. However, there is a second and even more puzzling aspect: their re-dating of cores which actually do have 20th century samples.
I started analysis of this in my post two days ago in which I drew attention to Marcott et al’s truncation of the final three (highly negative) values of the MD01-2421 splice. MD01-2421 is a piston core with considerable core loss. It was combined with contiguous gravity and box cores to yield a continuous record into the 20th century. The modernity of the top portion of the box core was unequivocally confirmed by the presence of a bomb spike, a commonly used marker. Out of all the ocean cores in the Marcott network, this series undoubtedly has the best dated modern material.
In the graphic below, I’ve compared the age-depth diagrams from the original information to Marcott’s re-dating. As noted yesterday, the three most recent values are truncated from Marcott calculations. Oddly the other recent values are dated somewhat younger by Marcott. The sample dated to 1922 AD by Isono et al is dated to 1939AD by Marcott (just missing inclusion in the 1940 roster.) I have no idea what they’re doing here. It is possible that some algorithm has gone awry (as opposed to Briffa’s manual deletion – commonly and incorrectly described as “MIke’s Nature trick”). Again, I am presently mystified. I emailed Marcott for an explanation yesterday, but thus far no response. In my next example, I’ll look at a related series for further clues.

OCE326-GGC300
OCE326-GGC300 was identified in an earlier post as one of two highly negative proxies (the MD01-2421 splice was the other) that had been disappeared from the 1940 network, the removal of which “explained” the 1940 uptick in the alkenone and dependent reconstructions.
This series was published by Julian Sachs, an accomplished specialist. Radiocarbon dates at 0, 2.5 and 12.5 cm all have “modern” radiocarbon dates – dates that are not further resolvable using radiocarbon. (In passing, Pb210 dating on this core would be very useful.) Sachs showed a date of 0 BP for all measurements between 0 and 12.5 cm in his archive here and in a summary here dated the coretop (0.5 cm) to 0BP, an assumption that on its face is identical to the declared methodology of Marcott et al.
However, once again, the Marcott calculation truncated the most recent values. The diagram below is an attempt to summarize the information. The black line shows the Sachs age-depth diagram from here with the coretop (0.5 cm) dated to 0 BP. The black + points show the sample measurements as reported (with unresolved “modern” samples). The red horizontal arrows show the radiocarbon upper and lower dates as archived by Marcott et al. Marcott’s archive also shows radiocarbon dates for 0.5 cm and 2.5 cm which have been set to NA (shown here in blue.) The most recent sample used in the Marcott calculation came from 12.5 cm, with the seven higher samples being excluded.

Figure ^. OCE326-GGC Age- Depth Diagram.
The next diagram compares the two versions as time-temperature plots, as shown below. (Note that Published is black this time and Marcott red.) If the coretop were dated at 0 BP and dates for samples between 0.5 and 16.5 cm interpolated, this would yield a series continuing to the present, with alkenone-indicated temperatures continuing to decline (for whatever reason.) Instead, Marcott’s series ends in the late 18th century and does not contribute to the 20th century network (which is primarily composed of coretops from different centuries and even millennia.)

Figure ^. OCE326-GGC30 Temperature Reconstruction Comparison. Black- published; red – Marcott; blue- excluded.
Summary
Both types of example result in serious errors, though of different types.
At this stage, I can more or less see what they did in the MD95-2043 class of examples. As noted above, if this was done intentionally and with knowledge of the effect of the re-dating on coretop dates, this should have been disclosed with red letter caveats, showing the effect of the redating on affected cores and relevant specialists should have been asked to review the reasonableness of the methodology. (I do not believe that a properly informed specialist would have signed off on this redating, let alone with no caveats.) Nor do I believe that the actual calculations are consistent with the methodological statement “core tops are assumed to be 1950 AD unless otherwise indicated in original publication”, since core tops were re-dated to 1950 regardless of what was indicated in the original publication. This seems just as serious to me as the problem with Gergis et al.
The problems with the cores with actual modern values are over and above this. I don’t think that they manually blanked out modern values (I hope not for their sakes.) I presume that some algorithm went awry, but right now I can’t picture what sort of algorithm would yield the observed truncations. I’m sure that we’ll find out in due course. As noted above, I’ve requested an explanation from Marcott and hopefully he will clarify things.
Not unexpectedly, William Connolley’s reaction to the problems with Marcott dating is the same sort of wilful obtuseness that characterized “professional” responses to Mann’s use of contaminated (and upside down) Korttajarvi sediments. Connolley pretended that this is nothing more than recalibration of radiocarbon dates.
If you think the “secret” of re-dating comes from “McIntyre’s latest analysis” you’ve been sold a pup. The re-dating is in the SOM itself: The majority of our age-control points are based on radiocarbon dates. In order to 67 compare the records appropriately, we recalibrated all radiocarbon dates.
So I’m curious – who sold you this pup? And why didn’t you bother check the original? -W]
On the hand, Paul Dennis, in a thoughtful comment at Bishop Hill, had no difficulty in understanding the difference between core top redating and radiocarbon calibration.
One can only guess at what Marcott et al were attempting to do when they made gross adjustments to core top dates. It is one thing to run a new, for example 14-C calibration, that will make small adjustments to age models but a completely different issue to redetermine core top dates by such gross margins.
As to the title of this post. I was reminded a few weeks ago of the “Junior Birdmen” ditty, which was sung at YMCA and Cubs and camps in the 1950s – a ditty that seemed especially apt for Upside Down Mann, who serves as inspiration for Marcott and Shakun. Its chorus goes:
Up in the air… the Junior Birdmen
Up in the air and upside down
UP in the air… the Junior Birdmen
Keep their helmets to the ground
The Junior Birdmen were apprentice pilots who were flying upside down. The verse talks about “box tops”, which slightly modified to the present circumstances:
And when they make… the grand announcement,
That things are worse than they’ve ever been…
You can be sure… the Junior Birdmen
Have bent their core tops in.Up in the air… the Junior Birdmen
Up in the air and upside down
UP in the air… the Junior Birdmen
Keep their helmets to the ground


272 Comments
The text between the first and second graph should say that the results were identical up until just before AD500, not AD1000. Also, the core top was originally dated to AD1000, not AD^.
Steve: fixed.
So, to be charitable, they have no idea how piston cores work in soft ocean sediments…and didn’t bother to find out from the people who did the drilling. THIS is grounds for withdrawal of the paper in my mind.
More to the point, it bespeaks a mindset of scientist-as-Excel-twiddler, for whom any number looks exactly the same as any other, without the engineer’s knowledge of physical process nor even the attention to data handling you’d find among the DBAs and ad-sales staff at some second-tier internet-advertising website.
Indeed. As a ‘gonzo data analyst’ embedded in a biology group, I think I have some ideas as to what is going on here. Copying and pasting data around in an intractable jungle of excel sheets, without even the pretense of metadata, will beget these kind of results.
wrt the MD01-2421 Splice, I would not be surprised if they reinterpolated that series for alignment with one particular analysis, and then copied the interpolated series into another column but with the original depth values.
Depending on the kind of scientist you are, you may be tempted to just iterate that process of ‘creative destruction’, until ‘convergence’ upon a result interesting enough to publish, then put a one-line backwards rationalization in your paper, cross your fingers, and hope no one ever looks at it again.
It is a smart bet really. Reviewers that actually review just like Steve does? I havnt had the honor of meeting any yet.
I blame computers for screwing up science, but then I’m only a physicist.
“they have no idea how piston cores work in soft ocean sediments”
I presume you haven’t taken the time to check the authors’ background.
Steve: Richard, as you point out, Alan Mix has an extensive background in ocean drilling and thus with problems of core loss. Why would he sign off on such a wrongheaded methodology? My presumption is that he couldn’t have understood exactly what they did because if he did, he wouldnt have accepted it. Do you agree?
Hopefully the core experts will not bend their core tops in “to serve Mann”.
Superb Twilight Zone reference!!
Setting coretops to 1950 in the absence of other information is a common assumption. I have probably used similar assumptions. When you are mainly concerned with Holocene-scale features, this is a reasonable assumption, especially on cores with few dates. Had I been asked, I would have recommended setting coretops to 1950 in the absence of other information and then doing a sensitivity test.
While I understand the core-top assumption as a rule of thumb, would you mind explaining what a reasonable sensitivity test would consist of?
The obvious sensitivity test is to run the analysis on the new and old chronologies and checked there isn’t a material difference. Obviously this would have to ignore the chronological uncertainty in the Monte Carlo analysis. I tend to be fairly paranoid – when I get an exciting result, my first thought is what could I have done wrong, what is the null expectation. Even so, it is easy for errors to creep through, as they are not always where you expect them to be.
Steve: in an earlier post, I showed that there was a material difference between results with original dating and Marcott dating. Indeed, trying to understand that difference was what led me to the present posts
RT: “Setting coretops to 1950 in the absence of other information is a common assumption.”
OK, that seems reasonable, but what about the case where there is other information, where the coretops have a well defined date. That seems to be the issue at hand.
The problem here is that for many of these cores there was already other information that ruled out 1950 as a core top date, and the original authors had already carefully defined the chronology. To just wholesale redate things without careful item by item justification is really sloppy.
Thanks for the reply. I was wondering if you were thinking of something else so that answered my question nicely.
@Richard Telford
“mainly concerned with Holocene-scale features”.
Looking at the graph that they present, if all the samples were taken only from the equator, and only from the oceans, then I would accept that their “Holocene-scale features” were a reasonable representation of events, minus the last one hundred years.
However, the samples have been taken from all over the planet and from all types of places. Where’s the 8.2 kilo-year event, the Holocene optimum, the Minoan warm period, the Roman Warm period, the Medieval Warm period, the Little Ice Age?
If this was a fair representation of events, these features would be more apparent, so I don’t accept your premise. It’s a dog’s dinner of a pile of different things that subtracts from the sum of what we know.
Steve – sure, that’s your interpretation of someone’s actions. You may well be right. However, to someone like me who has never seen a core in his life, let alone attempted to measure one, I can’t make that judgement. I think your argument is strong but I’ve seen too many counter-intuitive effects in science to buy it at this stage, not least given that it has some very strong implications for the reputations of some young scientists.
As I observed on another blog, the response, when it comes, will be critical for me and also, I suspect, many outside the CA environment in assessing your findings. The reason I thought the original Mann et al. work was flawed was not just because of the M&M papers. They provided certainly strong evidence in that direction. However, I still had to assume that no mistake was made in the preparation of your results and that the you weren’t biased in some way; in academic disputes these aren’t often assumptions one can lightly make. It was Mann’s failure to address these points, together with the original critiques which killed that hockey stick. You may have dug the grave but Mann threw the hockey stick in and put up a headstone.
Anyway, I’ve made my point and shan’t repeat it here other than to say that scepticism is needed especially when we find results which are to our liking.
Steve: I agree 100% with these comments. For the record, I didn’t presume that anyone would automatically accept our criticisms of the Mann et al hockey stick, particularly given that they didn’t know me at the time. That was one of the reasons for providing a detailed archive of code. But I have been disappointed at the facile acceptance by the community of non-responsive arguments by Mann and associates. Nor do I preclude the possibility of better proxy analysis being able to show that the Modern Warm Period is warmer than the Medieval Warm Period – a point that we clearly stated at the time and subsequently. And should someone do this, that wouldnt mean that our original criticisms were “WRONG”. Same with the Holocene Optimum. I don’t preclude the possibility that the Modern Warm Period is warmer than the Holocene Optimum, though, for the Northern extratropics, I doubt it. But arguments on this point should be based on proper analysis of the information, rather than flawed work. I understand that marcott et al will now argue that the uptick is not material to their “main” point. Then they should immediately and voluntarily re-issue all the incorrect graphics.
Posted Mar 19, 2013 at 3:44 PM | Permalink | Reply
“Setting coretops to 1950 in the absence of other information is a common assumption. I have probably used similar assumptions.”
I am not a scientist. But, in my professional career, I have used assumptions when analysing data. These assumptions were as well-based as I could make them, and required a lot of thought and research.
There is no way that I could airily claim that I “probably” used “similar assumptions” (whatever that means). My memory is far from eidetic, but that kind of slipping and sliding really needs to be pulled up at the start. Either I did use them, or I didn’t use them, or I don’t remember so the answer is zero.
Your emulation is very similar to Marcott’s version except for the last century. Marcott’s procedure smooths the results more that you have done.
One Richard Telford can state that these undocumented changes don’t matter for the greater Holocene, but it clearly matters in the timeframe the assumptions affected; the timeframe in which the Marcott proxies values differed from published values, the timeframe which (now) contains the “unprecedented” uptick, the key aspect which generated the significant hype we all clearly witnessed. Via an assumption method which didn’t match the paper’s stated methodology. With no explanation or reference. Wow, Richard, just wow. I googled you and found out you are a climate scientist. Wow.
I am really learning about climate science thanks to Richard’s apologism. How he can ignore the complete focus of the press this paper received is beyond belief. Richard, if you think you are winning over skeptics by stating irrelevant half-truths, believe me you are wrong. Your rationale here is making the skeptics feel more and more reservations about taking climate scientists at their word, because it is what you are NOT saying that is the problem!
And Steve, thank you for this awesome dissection. This single post has taught me much about climate science and how the peer review process cannot provide this feedback (and does not want it).
And so is this just about the greater Holocene Richard? Or is it an attempt to bolster the claims of a previous hockey stick with independent results? And convince a public to vote/demand a specific action or at least lean one way on the climate issue? What was the purpose of the press fanfare?
Richard is telling us that Marcott and company used techniques widely accepted in peeling oranges, while most of the rest of us are asking why Marcott, Shakun et al didn’t stick to citrus and instead went on a whirlwind tour prattling about the horrible rotten apples they just peeled.
The tools and techniques widely accepted for measurement and analysis on geologic timescales simply do not offer the resolution necessary to make useful assessments at decadal intervals or less. It’s like hanging an artist on the end of your wing to sketch control-surface flutter in real time. It’s like measuring network packet latency with a stopwatch.
Re: richard telford (Mar 19 17:53),
@hmm
Seems to me that Richard Telford is hoping that by continually pointing to small aspects of the bathroom design (professionally hung wallpaper, nice grouting, elegant soap dish etc) that we will somehow not notice the elephant therein.
snip
+1 for Latimer
Unless there is evidence to the contrary, its sensible to assume good faith. Is there any evidence of Richard Telford conducting poor research, showing bias etc ? He has pointed out that the author list of paper contains good ocean drilling experience – pertinent to the issue at hand. This seems like a positive contribution to the discussion.
His posts here certainly show a certain degree of scepticism, this is good. I’m not sure that attacking him as “patronising and transparent” and damaging the reputation of “climatology and climatologists” is a sensible response to his posts.
Steve: as I observed, I value Richard’s comments. I delete many comments with such over-editorializing, whether against Richard or the world at large, but usually in the morning. As I also observed, most scientists, such as Richard, are very reluctant to publicly call out other academics and Richard’s very mild disapproval of the redating of MD95-2011 was him speaking quite loudly AFAIK. On the other hand, I was disappointed that Richard was very quick to correct me on a passim comment in which I had placed MD95-2011 offshore Iceland rather than offshore Norway without voluntarily commenting on the dating of a core that he knew well.
snip – foodfight
Has anyone had any indication of when there might be some sort of response to Steve’s (and others) work from the authors of this paper?
At the moment they are suffering a slow death by a thousand cuts.
Did none of the questions that have been raised ever occur to them prior to publication? Or did they just think that their status as ‘climatologists’ would ensure unquestioning acceptance of their contribution?
If the former, then they don’t deserve to be considered to be professional scientists. If the latter, they have completely failed to realise how much the world has changed in the last decade.
Even if their paper is eviscerated here, if they do not respond and let it sit in the literature, it becomes one more in a ‘series of studies that independently confirms the Hockey Stick hypothesis.’ All they have to do is keep silent and they win this battle.
True Tom. But the blade of this stick is so easy to refute, in print and one-to-one, that Latimer’s death by a thousand cuts is I think the right description for its future too. The moment the Hockey Stick and its independent verification is trotted out by any friendly green I for one am ready to spring into action. Am I wrong to see thousands, across the world, by my side?
Here…
Current argument:
“Clearly, if any press, bloggers or anyone else’s focused on the uptick, the paper is invalid and can be thrown out, and any instrumental temperatures ignored.”
“Are you denying the instrumental temperature record”
all by doing things like… focusing on the uptick that was focused on.
Re: Salamano (Mar 21 07:00),
I find it funny that even the one supposingly “carrying the load” (as Eli put it over Curry’s place) has not read the paper carefully enough (hey, it’s already in the second column!) to realize that the height of their “robust” “seat of the wheelchair” is ultimately dependent on the mean height of Mann et al (2008) MWP with all the upside-down issues etc. related to it.
YEs Latimer,
There has been an answer from the Marcott-camp. By Marcott’s (former) advisor Peter Clark, who goes on to say:
In their view it is thus ‘the best way’ if they get to phrase those questions they feel comfortable answering themselves, and provide them together with said answers.
However, I don’t expect those FAQ & answers to be that much clarifying, and even less expect them to be directed towards those here asking the pointed questions. Rather, it will be for general media consumption and others those of hockeystick-ideation ..
Marcott response now up at RealClimate
http://www.realclimate.org/index.php/archives/2013/03/response-by-marcott-et-al/
It looks like Jonas N was writing it 10 days ago.
=============
Maybe I don’t understand peer review…Shouldn’t have this been caught and then the paper returned for major re-write? At least have something in the paper that detais the why and how instead of a “not robust” statement. I read the reviews on Lindzen Choi in PNAS last night and that paper was rejected for much less. I am not too impressed with science today. Thanks Steve for suffering through this.
The type of analysis that I do is well beyond what peer reviewers do or can reasonably be expected to do. Peer reviewers can’t be expected to vet everything.
Because peer reviewers are not doing an audit, authors therefore need to be held accountable for properly disclosing what they did. As Simonsohn has argued, authors should also disclose the results of analysis attempted as well as their final results.
In this case, the core-top redating was a major change of the method used in the marcott thesis. It evidently yielded very different recent results and this should have been disclosed.
I don’t think that referees reading the manuscript would have been aware of their core top redating enterprise given that their reported methodology on this point was (in my opinion) materially different from what they actually did. It was a difference of this character that caused the retraction of Gergis and I think that Marcott et al will be hard pressed to distinguish their situation from Gergis’.
Nice work.
Marcott et al. have already described the recent period as being unreliable. The issues you have raised don’t really touch the measurements they regard as being reliable.
In contrast to this, the methodology issue affected the entire Gergis et al. paper.
There is no difference in the type of problem between both works. However, there is a very large difference regarding the effect on the measurements.
I disagree with you. I think they won’t be particularly hard pressed to distinguish their case from Gergis’.
That said, I think it very much depends on the nature of the explanation they provide and the indulgence of the journal.
Robert, I am about to publish a paper with a whole lot personal information about everyone who posts on Climate Audit. I even managed to get ahold of your personal account numbers and key identifiers. But don’t worry, I’ll let people know that information is unreliable so you should be safe.
Robert, I think the standard of reporting you are willing to accept from Marcott et al is incredibly low given that these scientists were funded ultimately by the taxpayers. I don’t know if you rely on taxpayer funds to finance any of your own work, but I would hope and expect that if you do that it is of a much higher standard than you appear to suggest you are willing to accept here.
Re: Robert (Mar 19 13:38),
Two wrongs don’t make a right. Slicking a disclaimer on a data manipulation that is contrary to the documentation does make the everything OK. The disclaimer masks the reason why the result is unreliable. Thus, the study does not show what it says it shows. Which is grounds for retraction.
Did Marcott et al say ANYTHING in the press releases and interviews about 20th century data being unreliable or “not robust”? No. That’s why this is a problem.
JohnB and Ferdberple
I’m predicting what is likely to happen not condoning such conduct.
No, I don’t play such games in my research (assuming that Steve is correct in assessments of this paper).
Steve,
I don’t know. It seems to me, as a sometimes journal reviewer, that reviewers can’t (as you note) verify everything. Fair enough. But they ought to review anything that is material to the paper’s principle reason for publication. In this case, that reason for publication would seem to be the ‘unprecedented’ rise at the end of the reconstruction. Science does not publish papers without either ‘unprecedented’ results or a refutation of unprecedented results. Somebody surely should have given the rapid rise a careful look.
With a little effort the authors could have made their paper easy to verify: they could have published a Virtual Machine (Mac, Linux or Windows) with
– all original source data, intermediate data and final results
– all source code and compiled programs used for the analysis
– all free third party software installed that would be needed to reproduce the results
– a list of non-free software that still needs to be installed (e.g. MS-Excel)
– a description of the manual operations that are applied to the data
– a console window with a complete history of all computational steps used to get the final results from the source data, with a clear indication where manual operations occurred
Journals should require this for any publication, if only to prevent new disasters.
Re: stevefitzpatrick (Mar 19 21:32),
@Andre van Delft
What you propose looks suspiciously like what the outside world calls ‘an audit trail’.
Expect hordes of ‘professional climatologists’ to have apoplexy at the mere suggestion that such an alien concept should apply to them as much as to any other professional person – like an engineer or an accountant or a physician or an IT guy or financial adviser or a whole host of other equally qualified people.
You must also remember that the core goal of academe is no longer to publish work that is correct. The act of publishing is now the key point. The correctness of the content is of only secondary or tertiary importance. And producing an audit trail will reduce the productivity (papers per climatologist per annum) considerably.
Your eminently sensible proposition will be fought tooth and nail. If concealed data, dodgy practice and personal feuds were good enough for Isaac Newton, then they’re good enough for today’s climatologists. Ned Ludd is alive and kicking!
Speaking of retractions, it seems that Science leads the pack in the number of papers retracted, but runs neck and neck with PNAS (see http://www.pnas.org/content/109/42/17028.short ). (Comment cross-posted on Climate, Etc.).
Has anyone asked Marcotte et al for their code yet? Has anyone received it? The Science policy is clearly spelled out in their instructions to authors.
Have you (Steve McIntyre) written this into a technical letter or comment to the Editor of Science?
Steve: No. I don’t understand why people are in such a hurry. Better to understand what’s going on.
Sorry. I didn’t mean to rush you, but you have already done lots of work. So it seemed natural.
Re: Matthew R Marler (Mar 19 13:06),
they were also supposed to release the code from Shakun et al (2012) along with this paper.
Jean S,
That is interesting. I have seen plausible speculation that the recent paper was submitted to Nature and was rejected. Maybe Mother Nature didn’t want to be fooled, again. No code, no publish. Looks like two papers that should be withdrawn.
Well, sometimes there is a time limit for comments on papers, after which they consider it not of interest to the reading audience. And since no comment was issued, the paper is then assumed to be correct for all time.
Steve:
Masterful as per usual. It would be interesting to see the original data and Marcott et al’s “refined” data in a tool similar to the one Nick Stokes put together.
One other point – you noted MD95-2011, used twice by Marcott et al (#8 and #13) – how exactly does that work? I noticed three duplications of labels in Nick’s listing for his tool. I thought they were typos since the profiles were clearly different. Was it different authors with different actual proxies using the same core?
Steve: yes.
The NSF press release regarding this paper includes photos of sediment and ice cores being analyzed. Quite ironic in view of Steve’s dissection of the actial methods used.
http://www.nsf.gov/news/news_images.jsp?cntn_id=127133&org=BIO
“Richard Telford mentioned that he thought that alkenone results for JM97-948-2A had been measured but not published”
I was probably mistaken. I have searched through the programme for the conference (EGU 2005) at which I though I heard these data presented. There is no talk on alkenones from the Vøring Plateau, but there is a presentation on alkenones from the Feni Drift, by the same scientist who worked on the MD95-2011 core. I do not know if these data are published.
————-
These dating issues are all very interesting, but their affect on the Holocene scale trends will be minimal. As such, they are largely irrelevant.
Richard Telford: “These dating issues are all very interesting, but their affect on the Holocene scale trends will be minimal. As such, they are largely irrelevant.”
If the reconstruction curve was precipitously heading down at the end of their reconstruction, it is doubtful their paper would have received any press. Furthermore, wrong is wrong, especially when it is this wrong. In addition, the individual series were shifted around a lot, which may have affected many of their analyses, not just the end few years.
I remember as a PhD student greatly admiring a paper by an ecologist called Craig Loehle. I no longer remember what it was about, or where it was published, I only remember that it was clever.
Now someone called Craig Loehle writes that “wrong is wrong”. I have no doubt that something in the paper I admired is wrong, for nothing is ever perfect, and if “wrong is wrong”, nothing in that clever paper is valid.
I would prefer a more nuanced view. That is is possible for some aspect in a paper to be horribly wrong, but yet the most important conclusions of the paper remain intact.
If you remove the end of the reconstruction, which remaining conclusion in your opinion is the most important, and why?
Here is a more nuanced view. If something in a paper is wrong but more than trivial (ie, not just a typo), a correction (corrigendum) is a good idea. In my opinion, the problems Steve has uncovered are more serious than this even if the early Holocene is unaffected (but since some series were moved up 1000 yrs and even their methods for generating the Monte Carlo results seem iffy, that remains to be seen). The recent period uptick was a key part of the novelty of the result and method. It is too easy for climate scientists to say “it doesn’t matter” every time errors are pointed out. And seemingly impossible for them to admit mistakes and issue corrections even though other fields know how to issue corrections. So you, Richard Telford, don’t think the errors “matter” to the Holocene reconstruction–have you redone the analysis to be certain? I’d love to see it.
The only part of the study that I heard about (through the New York Times, the Guardian and Time and CNN blogs) prior to looking at CA is the part that might be wrong, namely the last 100 years.
It’s also the part that Marcott spent most of his time, and his (literal) hand waving on in his videotaped interview for the New York Times.
So if that part is wrong, then yes, it would seem natural to issue a public correction and also to do a new interview with very different hand waving (hands waving back and forth horizontally or going down toward desk instead of up to ceiling).
If the other parts of the paper that were not so, shall we say, handwoven, turn out to be correct that’s great too.
Seanbrady,
Correction, that was not Marcott but his co-author Shakun in the hand-waving interview video with Andy Revkin of the Dot Earth/New York Times blog.
Doesn’t alter the point you are making about how the authors have hyped their claims about the 20th century…. Marcott has done it too.
Re: richard telford (Mar 19 14:27),
Shorter Richard Telford
‘OK, there really is an elephant in Marcott’s bathroom. But its only a baby one.
And anyway mammals in the bathroom aren’t unknown.
There might (or might not) have been a mouse in Craig Loehle’s ‘House of Office’ twenty years ago.
So what’s all the fuss about?’
‘it is possible for some aspect in a paper to be horribly wrong, but yet the most important conclusions of the paper remain intact’
You think that it is common for the Journal, Science, to recruit referees who are incapable of noting serious methodological problems?
So we have a range of purely amateur, pajama clad keyboard warriors who are able to very quickly notice many different major problem, each of which should be grounds for rejection, within days of perusal.
You see the thing is Richard, that I review papers in my area.
I cannot help but come to the conclusion that either
the Editorial staff who passed this paper to the crème de la crème of the ‘Climate Science’ field managed to pick an unrepresentative bunch of nincompoops who masquerade as learned professionals
OR
the whole field of climate reconstruction is filled by people who are less competent than self-taught amateurs who have no training in climatology (weathermen, mining assayers, ecologists, engineers, biochemists, truck drivers), basically members of the public some with only a High School level of education.
So Richard, what do you think it says about the state of ‘Climate Science’ when we find gifted amateurs are able to spot many, massive, flaws in a manuscript and the highly trained experts cannot?
“If the reconstruction curve was precipitously heading down at the end of their reconstruction, it is doubtful their paper would have received any press.”
Indeed. We don’t even need to speculate about this too much since if one were to correct the apparent errors in the Science paper, the result (to a fair approximation) appears to be the same as Dr. Marcott’s original thesis. I think any who claim a contemporaneous interest in that thesis must pay very close attention to the field.
I should have said “knowledge of” rather than “interest in” the thesis. No offense to Dr. Marcott was intended.
Any datum re-dated to 1950AD will be relevant indeed, because it is thus also assigned an age-uncertainty of zero — which is of deciding importance in the final processing, i.e., the perturbations.
Richard:
But what about their impact on the last 100 years since it is that period that has created the PR kerfuffle? Is it a case of Marcott et al encouraging the tail to wag the dog?
Steve,
can I collect on the bet we made about the response that folks will have?
1. the conclusions about the holocene still hold ( you know, the uninteresting part of the paper )
2. the misleading, headline grabbing, uptick will now be ignored since the bell can’t be unrung.
of course the lesson to young scientists will be hard to un-teach. Its perfectly acceptable to generate modern period upticks out of thin air by any means necessary especially if they generate headlines and interviews. In fact, as long as you get the holocene or the MWP “correct” you can just make stuff up for post 1800 data, in fact, you should manufacture
anything you damn well please for the modern era since its largely irrelevant.Since its largely irrelevant anything goes.
That’s what this position amounts to.
Steve: Huh? I’d be the last person to bet against Mann and company claiming that the errors didn’t “matter”.
Steven – a perfect analogy – an example of “science by Press release” at its best. As you well note it seems clear this terrible practice is increasing – we saw the same with Lewandowsky’s ridiculous “Moon Landing” debacle. Create a “scientific” paper which claim to show the point you wish to emphasize, regardless of the strength of the underlying support and data, which up a press release touting that which you want promoted, and feed it to the media.
Like Pavlov’s dog they immediately react – touting the sensationalized claims and generating headlines. It makes no matter of the claims are later proven weak, silly, or just plain false, as the media will never report those claims (other than perhaps some small note deeply buried.
As you note, they know full well once the media promotes and the story gets out to the public, that first impression is what will remain. The bell COULD be un-rung – but the media refuses to do so.
Mission Accomplished.
There must be some system of penalty imposed for this “Science by Press Release” … if you publish it and it is later proven unsupported or false there needs to be some type professional standard – some sanction that is applied.
It’s still too early to see if the new approaches used by Marcott-Shakun will stand up under web based water cooler evaluations. If the paper in question was a product, say with a CE mark, the firm would likely be written up for not having labeling “to warn of hazards that are not “open and obvious”.
http://jameskolka.typepad.com/international_regulatory_/2009/08/warnings-instructions-product-liability-lawsuits-1.html
Trying to het Steve interested in the policy debate, Mosh?
Others have tried and failed miserably.
No, Steve and I had a conversation about how people would react to this. So, I laid out the tactical response that has been perfected over the years. It is the same response over and over again so no one should be surprised. Here is the schema.
1. Produce a result making claim A and B in the paper.
2. Do a press release touting claim C which grabs headlines
and has no real support in the paper.
3. When the errors in claim C surface, argue that
a) the paper never made the claim you are destroying
b) C might be wrong, but it doesnt matter because claim
A and Claim B are the real meat of the paper.
4. Turn the tables on you and claim you’re mean ( attacking
a kid ), gadfly, quibbler, etc etc.
In rare cases a heavyweight may weigh in and say: ” I would do it differently, science is self correcting, C02 is still a problem, move along nothing here to see.”
You see there is no consequence for spinning for the cause, or heisting emails if that is your preference, or rather there are benefits to be had for shilling schlock science. Of course skeptics are no better.
More and more I think back to a comment Ravetz made long ago when we were talking in Lisbon: ‘we have no theory of error’
What’s that mean? Steve finds an error. how do we make sense of it? some people say the error doesnt matter. Some people say the error shows the carelessness of climate science. The error or mistake becomes an “icon” that people imbue with meaning or significance. Or they ignore it. Move along. The funny thing is that we know science is full of errors, yet in the philosophy of science we have no theory of error or theory of mistakes.
In engineering we fix the error and then we get to move along.
Oh, and somebody gets shot. anyone will do. screw theory we have a ritualistic sacrifice.
Mosh, you say that there is no “theory of error”.
However, one place where I try to find solid ground in appraising highly promotional communications to the public by climate science is in the regulation of communications to the public by mining promoters. As I repeatedly emphasize (and is just as quickly ignored), I do not regard mining promoters as “more honest” than climate scientists. However, I have not yet encountered a climate scientist who thinks that they should be able to adhere to lower standards than mining promoters. Thus standards for mining promotion can provide at least a minimum, and hopefully climate scientists would try to exceed these standards voluntarily.
Mining promoters are not allowed to make claims to the public in press releases, websites or statements to reporters that are not supported by their qualifying reports. Press releases have to be reviewed by an independent qualified person.
From time to time, securities commissions carry out reviews of the public disclosure of listed companies, reviews which include articles in trade press.
In the cases that you’re talking about – a press release containing claim C which is unsupported by the article itself – would be a breach of policies governing publicly reporting companies and would give rise to potential sanctions by the securities commission.
As I observed many years ago, communications to the public by publicly traded companies is not “free speech” but regulated speech. Scientists issuing press releases should voluntarily exceed these minimum standards.
In the case of the present article, I think that there are issues over and above the press releases and statements to reporters.
I think the FDA’s requirements for drug companies seeking to advertise would provide another source of minimum expectations for press releases at least.
For example:
“The purpose of this guidance is to describe an approach that FDA believes can fulfill the requirement for adequate provision in connection with consumer-directed broadcast advertisements for prescription drug and biological products. The approach presumes that such advertisements:
– Are not false or misleading in any respect. For a prescription drug, this would include communicating that the advertised product is available only by prescription and that only a prescribing healthcare professional can decide whether the product is appropriate for a patient.
– Present a fair balance between information about effectiveness and information about risk.
– Include a thorough major statement conveying all of the product’s most important risk
information in consumer-friendly language.
– Communicate all information relevant to the product’s indication (including limitations to use) in consumer-friendly language.
Click to access UCM070065.pdf
Of course, FDA requirements for actual drug trials are even more vigorous.
Mosh is right about one thing. Again and again climate “communicators” will insist on quibbling about A and B instead of coming clean about C. And note that in this area, what Ravetz neatly calls a theory or error, C is Steve’s emphasis on regulation of public communications by mining promoters and how it could easily be emulated in law in the climate case. With truly world-changing consequences, in my view.
They don’t want anyone considering this C. The fear of Steve McIntyre is not without reasonable foundation. This is another aspect of his critique of the climate scene that has to be buried at all costs.
Steven Mosher –
So, Claim C is the 20th century uptick, which made no sense from the start given the study’s resolution. [And seems to occur as a byproduct of dating issues and interpolation and/or proxy subset changes.] While Marcott may not make any concessions on this (beyond the rather weak “we hinted it wasn’t robust in the paper”, which is totally at odds with public statements), let’s move on to A&B.
Claim A would be that the study confirms Mann et al. 2008 and supports the claim that the technique responds fully to climate (that is, there’s no variance loss). The paper asserts this conclusion by observing that its reconstruction is statistically close to Mann’s. But this comparison is not powerful at all; it appears that if Marcott et al. doubled their reconstruction amplitude (keeping the same 1-sigma uncertainly of +/-0.2K), they could make the same claim. [Caveat – comparison performed by eye, not by computer.] I notice that the paper doesn’t say anything about not replicating the sharp drop in Mann’s reconstruction around 500 BP.
Claim B would seem to be that the temperature difference between the Holocene optimum and recent times is ~0.7 K. This is a reasonable type of claim for a paper of this sort (long proxies) to make. For my part, I can’t say whether they’ve demonstrated this (at least to their stated accuracy). The spaghetti diagram of all the proxies make me fear this is a hopeless task, but I’m willing to be convinced.
There is a theory of error, except it’s called measurement theory. The theory is based upon the independent magnitude of observables as opposed to the results of our observations (measurement of observables).
The mathematics of the theory is heavily based in statistics, but is grounded on the tested use of primary standards to calibrate instruments. Measurement theory distinguishes between accuracy and precision, for example, as classes of error.
For those who’d like to familiarize themselves with the theory of error, I can recommend Bevington and Robinson, “Data reduction and error analysis for the physical sciences“.
Ravetz was wrong. A theory of error exists. It’s called measurement theory. But like all theories in science, measurement theory is incomplete. That theory is, however, fully capable of assessing the viability of proxy temperature reconstructions.
The fact that so many practitioners in the field ignore and dismiss measurement theory and neglect an honest propagation of error has no bearing whatever on the existence and legitimate standing of the theory of error analysis.
snip – pls don’t follow offtopic
Re Steve’s comparison with mining codes, my greatest concern has been one of morality. In mining, when people are of adequate seniority to announce new discoveries (for example), such people know that they are in a group whose knowledge equals and often excels theirs. If a miner makes a blooper in an announcement or report, the chances are high that a peer will often pick up a phone and say “You know about your mistake, don’t you?”. One can become quite familiar with numbers to the stage that an anomalous comment or result shines like a beacon.
The morality part for climate work is shown in numerous cases in Climategate 1 & 2, where the phone call would more typically be “How are we going to devise a plausible way to work around this mistake so it can be best concealed from the public?”
I am not wishing to generalise this lack of morality to all climate workers, the bulk of whom have to be more honest. It would be good if those who know of the cover ups would put pen to paper and describe them. Start today, get it off your conscience. Many of who write here are finding mistakes the hard way. The easy way is honesty in retrospect by those who know but stay silent.
BTW, this work by Steve on the several Marcott threads is of exceptional quality. Ask yourself, would you attempt to mislead if you knew that an audit of this skill was to follow?
@Geoff Sherrington at 8:31: pearls of wisdom that the wayward who are not doing their duty to their profession should take to heart and use as a guide.
“The easy way is honesty in retrospect by those who know but stay silent.”
Exactly.
@Steve Mosher
A perfectly comprehensible, non-cryptic post 🙂
When you do this, your posts are interesting. I am able to learn from them
Please, please keep it up (I really mean that)
Ditto. I was thinking the exact same thing.
Indeed… ClimateProgress is running with the same sort of argument–
http://thinkprogress.org/climate/2013/03/18/1722601/must-have-high-resolution-charts-carbon-pollution-set-to-end-era-of-stable-climate/
As in, it doesn’t matter if these various reconstruction proxies end up being different than theh modern temperature record, because it’s the modern temperature record that is reality. Therefore, it doesn’t matter what these proxies show after 1850 or so– are you willing to “deny” the modern temperature record?
As long as they get the rest right, its mentally conceivable that all reconstructions can simply have the modern temperature record spliced onto the end for all. [insert here the one-off explanations including reduced proxy accuracy in the modern record due to sky-high CO2, etc.] But, how is it proven that the ‘rest is right’ if we set aside the only period in time for which we have actual thermometer data? It can’t be various period events (like volcanoes), because the resolution is ~300 years.
Remember, some folks have run away with the results of this study, talking about a “scythe” instead of a stick, nevermind that it’s only the non-robust part of the reconstruction that creates the up-tick. Why does this even become interesting if the study itself’s main publicized result is non-robust? It’s like the horse is left the barn and “what must appear” in future reconstruction studies is the Younger Dryas, a few ripples for the Roman Warmth and the MWP, and then the little Ice Age– all of which safely constrained below present values, and voila, “it validates Mann et al, and thus the body of work in this area”, regardless of it’s post 1850 (or 1950) material.
Posted Mar 19, 2013 at 1:51 PM | Permalink | Reply
Steve,
can I collect on the bet we made about the response that folks will have?
1. the conclusions about the holocene still hold ( you know, the uninteresting part of the paper )
2. the misleading, headline grabbing, uptick will now be ignored since the bell can’t be unrung.
—–
So what does it say about the quality and validity of the proxy reconstructions if redating, by as much as 1000 years, have no impact on your #1?
To me, if my date were so insensitive I’d question both the data and my methods.
It’s truly a stunning “defense” well, the errors/manipulation that cause the end to be crap don’t impact the main part so all is well.
That anyone calls this science is frightening.
Mosh,
there’s another stock response. They will try like hell to figure out some way of “getting” an uptick from the proxies using some other method and then proclaim that my criticism was “wrong” because they could still ‘get” an uptick using some weird methodology not contemplated in the original article.
After the media exposure and almost exclusive focus on the hockey stick shape – even from the authers themselves – I’m completely in awe of you last comment: “These dating issues are all very interesting, but their affect on the Holocene scale trends will be minimal. As such, they are largely irrelevant.”
Marcott described his study as “producing the same result” as Mann’s Hockey Stick and this characterization wsa widely accepted e.g.
I didn’t pick this particular issue merely to discomfit Marcott et al. They publicized this issue. As you observe, their article contains other points which do not necessarily stand or fall with the falseness of this point. The authors would obviously have been better off sticking with points that are correct.
I think that the erroneousness of the Stick portion of their paper is established beyond dispute and, at some point, surely it is the responsibility of the authors to admit this. I do not believe that any of the graphics that show a proxy-stick are ones that can be supported on their data and methodology. If some other points survive, then they are entitled to make them.
It’s also fair to argue that, whatever the validity of the rest of their work, for the junior authors to have been proclaiming from the treetops the most dubious (just a count of data points alone would render it questionable) of their conclusions must cast a cloud over the rest of their work, and should they want to salvage what’s still valid they’ll need to slough off any inclination toward the Mann-patent response and actually roll up their sleeves.
So in other words, ‘You can’t carve a hockey-stick out of a baseball-bat’.
michael hart wrote:
“So in other words, ‘You can’t carve a hockey-stick out of a baseball-bat’.”
But one can carve an hockey-stick out of a baseball-bat.
OK, arguably it will be a small one. More like a model of a hockey-stick.
With some glossing over the scale, one could pass it of as a real hockey-stick though. Until someone wants to use it in the real world, that is. However it will look magnificent, when printed in the papers.
(Steve, thanks for you continuing hard work digging in dirt, I mean sediments.)
I am not across the detail in this particular case, but I have read a lot of commentary on it so far.
No one seems to have mentioned that a possible reason that this uptick has occured – as per Steve’s analysis – is that the tail must be “seen” to follow the thermometer record. This is not saying that they used the instrumental record as data, only that this record would not be seen as valid if it did not match the instrumental record.
Folk have already said the paper would be unremarkable if they maintained a downward tick – but that is precisely the point. If it had a downward tick when the instrumental chart had an upward trend, then it would throw doubt on the value of the proxies as a whole.
That seems to be a conclusion studiously avoided by most – though I suspect it has a lot going for it.
Now I am not sure how close Mann has been to this paper, but there is little doubt that as methods were adjusted and an upward tick began to emerge there would have been a real excitement generated. Not only does it bolster “the same result as Mann’s Hockey Stick”, but it makes the proxy look quite sound as it now matches the instrumental record.
From where I sit, that would explain why they did what they did. They were exploring ways to manipulate the data so they would have confidence the results they obtained were ‘real’. The original thesis probably left them thinking that something was still wrong, and so they kept adjusting till it came right. In their minds this was the right way to handle the data, not unscientific at all. But from others’ point of view, it shows up as inconsistent and unreasonable – not the scientific method at all.
Remember the nature of Climate Science is a paradigm. They ‘know’ that CO2 will produce a temperature rise, therefore they ‘know’ that temperatures are going up in modern times and will ramp more steeply. Therefore proxies can only be a reliable record if they mimic that behaviour. A proxy that does not have that trend might get published from time to time, but it would be considered basically useless if not conterproductive in the current climate of science.
I suspect that with the support of those like Richard and Nick who like the papers ‘basic’ position and are untroubled with the “irrelevant” and non-robust recent uptick, together with the bulk of the Climate Science establishment applauding that very recent uptick, the authors felt pretty sure this paper would pass with flying colours.
Its all a very murky game in the end. Thanks again for making its operation a little more visible to us all Steve.
Re: Steve McIntyre (Mar 19 14:41),
“What’s striking,” said lead author Shaun Marcott of Oregon State University in an interview, “is that the records we use are completely independent, and produce the same result.”
=========
Of course the result is consistent. They invented data where none existed by shifting the end dates of the proxies to 1950, then voila, an uptick appears around 1950. How is this any different than using thermometer data to hide the decline in tree ring data? It is data invented to fit a preconceived idea. Fiddle the data and you too can create hockey sticks to match your beliefs.
If the mistake was accidental, then there is an argument for a correction. However, if the result was willful then it is a much more serious matter. The graph in the thesis paper suggest suggest something other than accident is at work and places a burden of proof on the authors to show otherwise.
Craig – The authors are aware that there are issues with their chronologies – I wrote to inform the lead author of a specific problem with a core I am familiar with and he replied that the error would be corrected.
This is perfectly proper material for a correction. Those here and elsewhere arguing for a retraction should read the COPE guidelines on retractions.
I have not seen comment on their Monte Carlo procedure. It seems reasonable to me, though one could always argue if the uncertainties in the raw data are sufficient. Nick Stokes has a simple emulation of Marcott et al. With a simple procedure he gets a good match to Marcott et al. I would be amazed in changing from the new chronology to the old chronology made any material difference except at the very top (I would check this, but have a comment to write on another paper – one with much more serious problems).
Re: richard telford (Mar 19 15:57),
You say
.
I tried to. All the references on the COPE website to ‘retraction’ that I found led to 404 errors – page not found.
Please can you provide a working link to the guidelines. Tx.
Re: Latimer Alder (Mar 19 16:55),
@Richard Telford
Or have they retracted their retraction guidelines already?
Click to access retraction%20guidelines.pdf
“Retraction is a mechanism for correcting the literature and alerting readers to publications that contain such
seriously flawed or erroneous data that their findings and conclusions cannot be relied upon.”
I have seen no evidence that the main conclusions of the paper are substantially in error. The media may have been excited by the fragile uptick at the end, but it is scarcely mentioned in the paper.
Richard, let’s go back one step.
Retraction is, in a sense, a nuclear option. But a policy paper linked from Sciencemag says http://www.councilscienceeditors.org/i4a/pages/index.cfm?pageid=3636#218: “Errors in published articles require a published correction or erratum.”
Even if you do not regard the Marcott et al errors as being sufficient to warrant retraction, surely you will agree that they are sufficient to warrant acknowledgement and correction and that they should, at a minimum, re-issue the graphics showing the uptick.
Even a correction is heavy lifting in this field. Mann, for example, to this day, has failed to issue a correction notice at PNAS for his use of contaminated data in Mann et al 2008. Thus his contaminated no-dendro reconstruction continues to be cited as valid, including ironically by the EPA as a supposed rebuttal to hide-the-decline – an amusing juxtaposition.
Distinct from any question about the fate of the paper itself, the “media” did not concoct a story about the Marcott paper and the uptick, they were led by the hand to write such stories by Marcott and his NSF grant manager in the official science-by-press-release:
http://www.eurekalert.org/pub_releases/2013-03/osu-roe030413.php
This may not bear on whether the paper needs correction or retraction, but it surely may influence what we say about the orchestration of the media stories… See also Shakun’s video interview with Revkin of Dot Earth/New York Times blog.
A correction sounds like the way to go, at least with the problems outlined so far. It seems clear that the reconstruction is less accurate (=”not robust”?) for the latest N centuries, where N may be 5. I’d like to see the paper explicitly indicate this, either by an expansion of the uncertainty window (as is present in Marcott’s thesis); by a graphical device such as a dashed line rather than a solid line; or by a statement in the text. [Even Mann08 conceded uncertainty of reconstructions pre-500 CE or so.] This would perhaps render the discussion about 20th c. issues due to dating errors, NaNs, and such, less critical, because the blade would melt away. However, it would also remove the basis for much breathless exaggeration based on the blade’s appearance.
Comments have been made about parts of the Monte Carlo, but since Steve had raised certain issues which he wished to discuss, it would have been OT to push further on these at the time. My referenced comment implied that the variability estimates used in the 1000 stack analysis were understated for certain types of proxies and that taking a 30% error on ice core anomalies meant that there was NO error attributed to a measurement of zero – an arbitrary value which was determined by the anomalizing process. In effect this tied the simulations down at all of these “zero” points. I think that such issues should be addressed.
There are other possible issues with the results. Try plotting the changes in the “Temperature Stacks” in the SI. In some of these, the “average” temperature does not vary by more than about .02C from one twenty year period to the next for many millenia until about 1500AD at which time this difference begins to oscillate to larger values. A remarkable stability in the temperatures! Or using reconstructions with methods similar to the ones you refer to by Nick Stokes, would it surprise you that the correlation of the proxies with these reconstructions (where that proxy is excluded) is negative for about 38% (28 /73) of the proxies?
I suspect that your overconfidence in this entire work may be due to the fact that much of the technical portions of the paper have not been examined in detail. But that may be grist for a different post.
Clearly assuming that the error is zero when the anomaly is zero would be crazy. I don’t believe they did that – it would not be the conservative assumption they claim to have made.
When I first read this, I just assumed they meant “range” rather than “anomaly”.
I would not be in the least surprised if many proxies had a negative correlation with the mean. Indeed I would be surprised if temperatures were in phase over the whole planet. That said, some of these proxies may not be ideal, but I am very happy that they didn’t include any dinocyst reconstructions – I don’t trust these very much.
I agree with you that it would be “crazy” although I would term it statistically naive. Here is the direct quote from the SI:
These temperature were out of phase over the thousands of years of their existence, not just over some short calibration period. A similar reconstruction using these proxies yields a reasonably straight increasing curve. When they are removed, the remaining proxies produce a reconstruction similar to the original (not surprising since they are positively correlated with it) but with reasonably greater amplitude.
I’m glad you raised this point Roman. I would like to see what the reconstruction would look like using a base period much closer to the actual length of the reconstruction. A few proxies would need to be excluded in order to accomplish that.
The graph that shows the uptick has to be removed, right? That graph is one of their conclusions.
telford is following Mosher’s script to the letter.
Niggling over A and B while the authors hype C.
It seems to me that the very large temporal resolution of the Holocene recon in this paper isn’t granular enough to tell us anything about whether modern temps are unprecedented in scope or rate of change. Smoothing it all out kind of takes away those possible indicators.
This paper doesn’t seem very useful for anything.
Re: Jeff Alberts (Mar 20 09:51),
‘This paper doesn’t seem very useful for anything’
There is one thing that paper is always useful for……
And I am not thinking about wrapping fish and chips. 🙂
richard telford commented:
” These dating issues are all very interesting, but their affect on the Holocene scale trends will be minimal. As such, they are largely irrelevant.”
I hope that this isn’t seen as piling on… I can understand Richard’s opinion about the broader scope of the Holocene, but it seems to me that understanding how these proxies respond in the very last century of the Holocene is very important because we have a temperature record to which we can compare the proxy measurements in order to test the hypothesis that what you are measuring actually represents temperatures.
Without the modern confirmation, aren’t you just guessing? Why should I or anyone else believe your best guess?
Jeff:
The proxies are not individually calibrated. The temperature signal is based on chemistry and calibration curves developed by others. The calibration errors are ad hoc for each proxy type (one is simply +/- 1.7C), which is why the error bands are constant throughout the reconstruction (except at the end where we are down to just a few proxies).
Howard,
Yes but the calibration is only a hypothesis. At some point it has to be tested against reality.
Any word from the original authors of the core studies about the re-dating? The notoriety of this research must have reached them by now.
I didn’t know the tune to The Junior Birdmen….
….Lady in Red
Richard Telford,
I agree that the core top dating issues have negligible impact on the Holocene scale trends. These are as expected, with low temporal resolution and in that context unremarkable. My feeling is that as such the paper would not have been considered by either Nature or Science.
The issue is with the re-assignment of core top dates. These play a very significant role in producing the uptick at the modern end of the plots. It is this uptick that has entertained the media and scientific colleagues and presumably the main reason why the paper was accepted by Science. It is an artefact and contains zero information regarding modern temperatures on a sub centennial scale, let alone a decadal scale.
I note that in the introductory paragraphs the authors draw attention to the fact that there is no data with which to compare the extent and rate of modern warming with that during the Holocene. I don’t believe they were not unaware, even bearing in mind caveats about robustness etc., that if they present a graph with a marked uptick that it will not be turned into an icon. After all the press releases etc. draw attention to it.
The data simply do not, and cannot in their present extent and form, answer the question “Is the current extent and rate of warming outside the range of natural climate variability in the Holocene?”. To begin to get a handle on this we need more, and better characterised high resolution proxies and natural archives.
Please don’t get me wrong. I think that it is a worthwhile exercise to try and map out centennial scale variations in regional and global temperature and Marcott et al is a valuable contribution to such attempts. It is not, cannot and must not be construed as a comparison or test of the modern climate variability against the Holocene variability. It is about time that professional colleagues start to ask serious questions of such studies.
Paul:
Very nicely said.
“To begin to get a handle on this we need more, and better characterised high resolution proxies and natural archives.”
Paul, there isn’t a physically based proxy that has better than (+/-)0.5 C resolution under the best of laboratory conditions. And statistical scaling to the instrumental record isn’t a physical basis. At the risk of Steve’s editorial displeasure, I add that there isn’t any science at all in Marcott-Shakun, Science.
Pat, I don’t disagree with you re proxy resolutions.
Paul, but you do disagree that substituting statistics for physics is a-scientific?
Pat, I aslo agree that statistical scaling to the instrument record is not an appropriate physical basis on which to reconstruct temperatures. I have and continue to spend a huge amount of effort and time trying to establish a rigorous proxy for mineral growth temperatures. Ones that have an a-priori physical basis that can be described by thermodynamics. This work is slow, painstaking and ranges from design and construction of new analytical instrumentation through to laboratory experiments, computational mineralogy etc. to determine the response of proxies.
All honor to you, Paul. A large part of the anger I feel about proxy thermometry is that so many have abandoned the hard gritty work of science and substituted facile methods that permit them grand sweeping proclamations. They’ve made a pseudo-science decorated with mathematics. They have dishonored your field in particular and the integrity of science in general.
Best wishes to you and all success.
That sounded like the blessing of St Patrick, only three days too late 🙂
Paul Dennis writes:
“I have and continue to spend a huge amount of effort and time trying to establish a rigorous proxy for mineral growth temperatures. Ones that have an a-priori physical basis that can be described by thermodynamics.”
A textbook setting forth your methods and standards just might save paleoclimatology from itself. The silence about physics among scientists using proxies for temperature is deafening.
Paul Dennis, FYI about you: http://www.realclimate.org/index.php/archives/2013/03/unforced-variations-march-2013/comment-page-5/#comment-325189
I have another comment awaiting moderation, and even made it to the borehole once…
Sue, I think the debate about me at Real Climate you pointed me too says everything that needs to be said about the paranoia, group think, and lazy, vacuous thinking demonstrated by many of the denizens there. I don’t think I need add anymore.
I figured you’d say that… 🙂
Typo here I think “On the hand, Paul Dennis..”
With respect to the second (lower) graph above of OCE326-GGC30, isn’t the blue dashed line (eliminated values) supposed to connect to the red line (Marcott) and not to the black line? (Or am I reading this graph all wrong?) And what does the blue tick mark at about a.d. 1390 signify? Also, on the first (upper) OCE326-GGC30 graph, the most recent retained Marcott date is said to be at 12.5cm, yet in the graph it looks more to be at 14cm. (I’m guessing that this last consideration is absolutely trivial, but you never know until you ask…)
Steve: the blue ticks are radiocarbon dates. I will provide proper captions to the graphic after i go for coffee. The blue values show what the result would be if the dates were interpolated to the last Sachs radiocarbon point. Maybe it would be more clearly illustrated as you suggest, but the point is there either way. The most recent Marcott value is from 14.5 cm. I’ll crosscheck my text a little later.
“I do not believe that a properly informed specialist would have signed off on this redating, let alone with no caveats.” I wonder if the specialists who dated these in the first place would care to comment? Some enterprising journalist might chase them down and get their positions.
Here is the original paper that first dated MD95-2043
(601 BP – radiocarbon 980 BP)
Too big a paranthesis there, Steve?
re “…reassigning the core top from AD943 to AD1950”
So they got rid of the Medieval Warm Period by moving it to the Modern Warm Period!!!!
“The sedimentation rate between the final two radiocarbon points of MD95-2043 was 26.7 cm/kyr”
“In contrast, Marcott et al 2013 dated the coretop to 0BP (1950 AD) and interpolated dates back to the radiocarbon date at 14 cm. In effect, Marcott et al presumed that the sedimentation had tripled from previously observed rates (“unprecedented”?)”
Steve, I think you made a typo in saying the sedimentation rate tripled – surely it is only a third of the prior rate as your first graphic shows?
Sorry to be pedantic, I love your analyse’s of the crap put out by the third rate academics who call themselves climate scientists, & I know you want your posts to be as accurate as possible.
Steve: thanks. fixed.
“…Marcott et al presumed that the sedimentation had tripled…”
Don’t you mean Marcott et al had assumed one third the sedimentation rate for the most recent period?
I guess that depends on whether you’re calculating as mm/years or years/mm 😉
JEM:
Since the graphs all have years as the X axis, the rate is measured in cm/year, hence Steve’s sentence is wrong. No big deal.
I know, just making noise…
Who would have thought that a paper from a newly minted phD (Marcott etal 2013) would completely overshadow the much anticipated Climatgate password release. Just when things climate seem to get repetitive and boring, the team drops another steamer on the fan. good to see Steve back in fighting form. I feel sorry for the young PhD’s Marcott and Shakun – perhaps lead to the slaughter be their elders who should have known better.
The two events are not unconnected…
“Marcott state in their archive – in my opinion, with unwarranted optimism – that there is zero uncertainty in the 0 BP dating of the core top”
*splutter*
“And when they make… the grand announcement,
That things are worse than they’ve ever been…”
Sounds ominous, Steve.
But I like it.
Who would have thought that a paper from a newly minted PhD (Marcott etal 2013) would completely overshadow the much anticipated Climategate password release. Just when things climate seem to get repetitive and boring, the team drops another steamer on the fan. good to see Steve back in fighting form. I feel sorry for the young PhD’s Marcott and Shakun – perhaps lead to the slaughter be their elders.
Reblogged this on Climate Daily.
Well I think you’re all being very hard on the children, Marcott and pals. This sort of fiddling about with numbers has been common ever since the Second World War of 1520 – 1890.
Thank you. After reading the comments on this thread and trying to understand the various points being made, I needed a good laugh.
Also on the issue of how the “media” read the moral of the Marcott paper, here is what Marcott’s NSF grant manager told media the study implies:
[emphasis added]
The paper was sold by its authors and sponsors as something it was not, something that they knew would maximize likelihood of publication and exposure.
that quote in bold is very damning.
And she really, really should have known better.
Perhaps this is the initial salvo of any potential FAQ regarding Marcott et al?
“grant manager”
LOL
Come to think of it, after 15 years of intense work and presumably good financing, the Team and their supporters have yet to produce a credible hockey stick.
So it would seem that despite all their efforts, what they have shown is that there simply is no data to support such a stick.
Because if there was, they should have found them by now.
yes but, we shouldn’t assume that it is easy, or even possible to reconstruct thousands of years of temperatures from different proxies to a decadal resolution.
To my layman’s eye this is a very hard, probably impossible problem given the resolution and quality of the proxies, not too mention geographic dispersion, contentiousness of the subject etc etc… uff da
The true skeptic will leave the door open. Just because it can’t be readily confirmed with current technologies doesn’t mean it isn’t so.
Re Robert Austin
“perhaps lead to the slaughter be their elders” I also have a great deal of sympathy for the two young Post-docs. It will be gut-wrenching for them to have thier magnum opus trashed so publically. In Shakun’s interview Revkin he came across as pretty genuine, so I place the entire blame on the senior authors who should have insisted on some more in-depth peer review. Shame on them and unfortunately a sharp lesson for the young guys.
Here’s Stoat, ‘taking science by the throat’.
“I’m not even bothering to read the WUWT / CA stuff, because its clearly just fiddling with unimportant details, and that’s even if they’re entirely correct, which is unlikely -W”
http://scienceblogs.com/stoat/2013/03/11/a-reconstruction-of-regional-and-global-temperature-for-the-past-11300-years/#comment-28657
Where a stoat fails, you need a North American Wolverine…
…but, without words, this is good:
http://scienceblogs.com/stoat/2013/03/19/man-slumped-after-hitting-wall/
…now is that science or a great self potrait? 😛
I have a sick respect for that ermine.
Steve,
Do you think it reasonable that these kinds of things should be picked up in peer review and not left for you to find?
Is there a documented standard for peer review in the journal this was published in?
If not, how is it decided that a paper has passed peer review?
Thanks
Steve
Steve discussed peer review in a post above:
Late to the party, but I just put together a “smear plot”, lumping together all published proxy ages and temperatures from the SI.
It helps me see how many proxy observations there are from recent times. I don’t know if it adds much to the discussion, but I like looking at data points to see how much extra- and interpolation might have happened.
The 6 data points beginning at 10BP and extending to 1BP provide a nice uptick. That must be what they mean by “robust”.
The plot is in degrees, not anomalies, and it uses published dates, not the dates assigned by the Marcott-Shakun Dating Service&tm;, so it cannot be used to deduce where the uptick comes from. But then, Steve has already demonstrated some key points.
I just wanted to see what they had to begin with.
To paraphrase a rather wonderful quote: “Marcott is both valid and confirms the hockey stick. Unfortunately the parts that are valid do not confirm the hockey stick and the parts that confirm the hockey stick are not valid.”
I just realized that, “They bent their core-tops in” fits the rhythm of, “The Hokey-Pokey.”
And it turns out to be so appropriate! 🙂
They bent their core-tops in
They bent their core-tops out
They bent their core-tops in
And they shook them all about
They did the climate science
And they’ve turned it all around
That’s what it’s all about!
Hilarious, Pat! Now imagine that instead of the link to a kindergarten version, try this one, comedian Jim Breuer channelling AC/DC in AC/DC as inspiration Maybe someone can do an AC/DC “Core-Tops Hokey-Pokey” for Youtube.
Skiphil, you certainly found a diametrical opposite of the terminal cuteness displayed by little girls singing the hokey pokey. AC-DC, indeed. 🙂
So with MD95-2043 they’re moving an MWP uptick to the CWP? How ironic!
As I’ve said already, it’s high time the Middle Ages pulled its weight in providing data to justify ongoing mitigation of unprecendented global warming catastrophe. You know it makes sense.
Steve’s analysis of the Marcott-Shakun “redating” is, as always, entirely convincing. Marcott-Shakun redating is clearly invalid and inappropriate; there is nothing to add.
A question remains, however: Why would anyone go to such ridiculous lengths, applying bad scientific methods that ultimately discredit the entire climate-science community? Are they really trying to defend a “hockey stick” that is itself fundamentally flawed?
A point that hasn’t been discussed yet: the SI to Marcott et al 2013 is very long and purports to show its robustness to a variety of sensitivities. But notably left out is the sensitivity to core re-dating: a sensitivity that we know that they had done, because it’s reported as a chapter in Marcott’s thesis ( a chapter which has the same coauthors as the Science article.)
In the Simonsohn critique of false psychology papers, Simonsohn was adamant that “failed” calculations needed to be disclosed. Marcott et al should clearly have disclosed the results without coretop redating both to reviewers and to readers.
It’s also an issue that has raised it’s head in drug testing in the pharmaceutical industry and for which new procedures are in place. It seems climate science is way behind the curve with respect to many different fields of research.
It has become rather obvious from the reaction to the Marcott paper that individuals will see what they want to see outside the confines of the paper proper. These reactions are in my opinion bolstered by discussing parts of the paper and not looking, at least as often as I would prefer, the entire picture the paper presents. The paper has 2 major technical limitations that I judge need attention and that by avoiding those discussions gives credibility were it is not deserved.
Beyond the technical limitations we have the issues that SteveM has been pointing out in these threads and that is the apparent sloppy and unexplained results that the Marcott authors committed in evidently forcing a reconstruction ending spike upward. These issues may eventually be answered to the satisfaction of most the participants in these discussions, but in the meantime what needs noting is the apparent lack of a first response by the authors and the seeming rush to minimize these problems by the defenders -both as laypersons and scientists. The problems pointed to here are those that give, or should give pause, to those who might otherwise regard the authors and their work as earnest and unbiased by advocacy. The slower the response by the authors to these findings the more doubt it places on the integrity of their entire enterprise. The more these problems are downplayed by climate scientists the more doubt that will be placed on the work coming out of the climate science community.
The primary technical limitation of the paper is combining individual proxy responses that are generally incoherent with one another and the lack of a discussion on how these proxy responses can be combined and averaged out to produce a realistic temperature response that has not been overwhelmed by other possibly random response effects. Before using these proxies in temperature reconstructions those questions must be answered or at least seriously discussed.
The second technical issue and limitation is one that the Marcott authors have documented in the paper and then somehow forgotten outside the confines of peer-review. I have excerpted the following from the Marcott before and do so again below. The authors clearly state that from their spectral analysis result there is no centennial variability in the reconstruction. That means in effect that a true reconstruction – if we assumed the proxy responses to temperature were meaningful – would have a graphed appearance with a data point every 2000 years. Now if we are looking to compare periods in historical temperature series with those in the modern warming period we would need a resolution of variability in the order of 50 to 100 years and even there the 100 year global modern warming anomaly would be on the order 0.3 to 0.4 degrees C. If we averaged the modern warming into a 2000 year period it would change the anomaly by 0.015 to 0.02 degrees assuming the remainder of that period was at 0 anomaly.
Given the resolution determined in the Marcott paper showing a reconstruction ending spike makes no sense, and, in fact, a reconstruction with a data point every 2000 years makes much more sense.
“Numerous factors work to smooth away variability in the temperature stack. These include temporal resolution, age model uncertainty, and proxy temperature uncertainty. We conducted a synthetic data experiment to provide a simple, first-order quantification of the reduction in signal amplitude due to these factors. We modeled each of the 73 proxy records as an identical annually-resolved white noise time series spanning the Holocene (i.e., the true signal), and then subsampled each synthetic record at 120-year resolution (the median of the proxy records) and perturbed it according to the temperature and age model uncertainties of the proxy record it represents in 100 Monte Carlo simulations. Power spectra of the resulting synthetic proxy stacks are red, as expected, indicating that signal amplitude reduction increases with frequency. Dividing the input white noise power spectrum by the output synthetic proxy stack spectrum yields a gain function that shows the fraction of variance preserved by frequency (Fig. S17a). The gain function is near 1 above ~2000-year periods, suggesting that multi-millennial variability in the Holocene stack may be almost fully recorded. Below ~300-year periods, in contrast, the gain is near-zero, implying proxy record uncertainties completely remove centennial variability in the stack. Between these two periods, the gain function exhibits a steady ramp and crosses 0.5 at a period of ~1000 years.”
Actually the 2000 year period of the Marcott reconstruction which ends in 1940 would miss the modern warming period entirely.
“The primary technical limitation of the paper is combining individual proxy responses that are generally incoherent with one another and the lack of a discussion on how these proxy responses can be combined and averaged out to produce a realistic temperature response that has not been overwhelmed by other possibly random response effects”
The actual line-shape is unimportant, what is important is the distribution of mean temperature over approximately 30 years in length. If we know how noisy the temperatures were in the past, then we can have an idea if the present is within these bounds.
Marcott el al., present a jack-knife 50% of Monte Carlo simulations, which is obviously a technique which has been independently validated many times since it was invented by Johannes Kepler
If I understand the analysis correctly, the blade that was absent in the thesis but appeared in the publication arises from two overlapping effects:
1. Truncation of negative or negatively trending time series
2. Redating of core tops that transferred data points from the MWP to the present
Understanding that there are still unresolved complexities, does the above capture the essence of it?
Shakun et al 2012 has Dr Marcott as a co-author. The primary finding of that paper depended on the dating of 80 proxies. Were the proxies put through the same blender as those in the paper under discussion here?
JF
Steve: it wasnt’ concerned with the past millennium.
Thanks. I find that paper’s results surpring, but I’m pleased that they didn’t rely on jiggery-pokery with the dating.
JF
I have linked in the three links below a Marcott standard reconstruction on a 1000 year and 500 year bases and the standard reconstruction as presented in Marcott et al minus the last point (1940) and with 2 sigma error bars.
I would suppose that someone on the opposite side of those hyping Marcott as the hockey stick on steroids could look at these graphs and hype the fact that AGW might be keeping us out of an impending mini ice age. Given my confidence in the validity of the proxies as thermometers I would judge both sides to be wrong.
Nice work but the key to understanding Marcott’s final output is that smoothing was not uniformly applied. Instead each datum was time-perturbed within the age-uncertainty of that datum. Since the 1940 data had uncertainty of zero, they were time-perturbed only along the vertical axis. Therefore the whole graph was smoothed, except for the 1940 data.
Steve, thanks for your work.
Have you calculated what the T vs time curve would look like if the proxies used their own dates as published (except perhaps for Marcott’s 14C standardization revisions)and the excluded 20th century data points were included? This recalculation would eliminate the major problems to which you have pointed. Does the resulting curve look a lot different over recent centuries?
This is being discussed as a side argument in a SkS thread (bashing Watts). As usual the angels are dancing on pinheads, though Tom C – obviously more aware of the the fatal flaw(s) – is trying to provide a more realistic perspective. Sphaerica insists that the paper has a different focus to the thesis and has dared to counter Tom’s bold proclamation with his own. It’s fun watching their own members confronted by their usual wall of obtuseness.
Here are a couple of places where Curtis fails to adhere to the concede-nothing deny-everything tactics of Mann and his associates. Curtis agreed that the submission to Nature (chapter 4 of the thesis) and the published article in Science had the same focus and methods, but that the results were remarkably different and questions deserved to be asked.
Curtis observed that the difference in closing value for the Standard method was 0.7 deg C and retained enough scientific integrity to expect that a difference of that magnitude warranted an explanation. Curtis speculated optimistically that the answer lay in “enhanced” proxy data through updated information or something similar.
Now that it’s become evident that there was no updated proxy data, but instead a fiasco, Curtis has gone silent.
He learned it was a fiasco, made crystal clear by McIntyre and Watts, ‘in bad faith’, and fell silent. I think it’s called cognitive dissonance.
Tom Curtis, for all his failings, does display an occasional glimmer of independent thinking (such as his criticism of Lewandowsky’s “moon landing” title). It will be most interesting to see whether he tries to think this through for himself, or simply remains silent now that the “party line” has made him inconvenient to the cause.
I didn’t last long there defending Anthiony and challneging Nutelli. 😉
I chose, and challenged a single one of Dana Nutelli’s specific listed attack points against Anthony – # 3 – which includes Marcott and Dana’s years long attack of Don Eastbrook over the BP age of his R. B. Alley 2000 graphic – Nutelli and others say BP is 1950, and there is some anecdotal evidence to support that – which I acknowledged. But there is almost no clear, definitive proof. Don Easterbrooks (and other) use a BP = 2000 date. Nutelli and other have been chasing, and attacking Don going back to at least 2010.
I had run into this exact issue and researched it in the past so I weighed in with a post about the problems identifying the correct answer, and that Nutelli has not provided definitive proof to support his claim and attack.
I looked for, but missed, the single sentence on Nutelli’s SKS page where he makes the claim the proper date is 1950, where he says he contacted Alley and Alley confirmed it was 1950. And when Nutelli went on an attack pointing out my omission I immediately acknowledged I had looked but missed it, but that my other points remained valid.
The moderators deleted my admission of omission – which also included some better evidence that Nutelli could use to actually support his claim, rather than rely on a 2nd hand discussion with Alley.
I reposted the acknowledgement that I was wrong noting it was highly unethical for the mods to delete a post that was in no way offensive – was actually an admission of error – and that deleting that post made me look bad, as if I had ignored the admonsihment I was wrong. While I was making that re-post someone posted exactly what I warned about – and attack that I had blown off Nutelli showing I was wrong.
In the interim – Nutelli continued the attack – actually being moderated/snipped at one point. Then his clearly apparent sock puppet showed up – WheelsOC – and pointed to his posts at WUWT attacking Don Easterbrook. A review of his post at WUWT shows among other rude and disrespectful comments, him relating in more detail the conversation with Alley. Turns out Alley did not definitively state BP=1950. He made several conditional comments. On the whole he said he thought “they” – meaning Cuffey and Clow 1997, whose work Alley 2000 is based on, used 1950, and he used whatever they did.
One the whole his comments pointed fairly strongly towards 1950, and not 2000 being the correct number – but again his statement was a long ways from definitive.
When I originally research I came to conclusion 1950 was probably correct – not 2000. But after reading Don’s replies to the attacks, and seeing the conditional case with Alley’s response – I came to feel less certain 1950 was correct.
I’m doing some addtl research and working on a story I’ll post when a finish.
After a detailed response to “WheelsOC” at SKS, I submitted a 3rd post about deleting posts in order to make a poster look bad. I fully admit I outright stated the mods might as well ban me – becasue this practice crosses so far over any bounds of ethics and honesty it was pretty inexcusable. I did so in a straightforward, civil fashion – pointing out the person who accused me of exactly what I noted would occur by their deleting my acknowledgement of Nutelli’s claim of error.
Not surprisingly – they deleted that post, and all evidence of it, including the post that accused me of ignoring Nutelli. Its one thing to exhibit a strong bias in moderation. Its another huge difference – grossly unethical and dishonest – to delete posts in a way that frames a poster in a purposely negative light – especially when the post would reflect the opposite.
I’m not whining – just making sure the actions are noted, and on the record. Its not a surprise to be treated badly there – it is a surprise that they have stooped so low as to actively attempting to smear those who share an opposing view in doing so. And please read my posts there or anywhere – I always respond civilly – even when attacked, denigrated and demeaned.
This seemingly new behavior – that they’ve crossed and awfully big line, I think deserves and needs to be publicized.
Steve – I agree about Tom … I think he has plenty of professionalism and ethics, and I commend him for speaking up and saying what he thinks is right – whether it upsets those plying the party line or not.
That said – its frustrating that he can’t also let go of the partisanship, as here. He admits the paper is flawed and there are legit questions, as long as you and Anthony aren’t asking the question. That sorely detracts from the positive he could do by being willing to at least bridge, if not cross, the divide and try to call things according to truth and not which side you’re on.
I tried to respectfully tell him that in an email the other day in response to one of his. I hope he would consider it constructive criticism and at least consider it – I truly think he has an ability to positively contribute in a collegial fashion if he would.
In reply to Steve McIntyre Posted Mar 20, 2013 at 8:38 PM:
Perhaps Nick Stokes could help Curtis prepare an argument for the defense. That was more wishful thinking then anything to do with science or statistics. He hangs his hat on a single point and says nothing about the authors comments that variability under 300 years is completely lost.
DaveA: You must have a different definition of fun than I do. It was positively painful to see so much avoidance in so short a period of time. Surely some of the more enlightened at SkSc will notice the essential reasonableness of TC’s tone and, how shall I say it, the petulance of Sphaerica et al. I will have to monitor SkSc to see if they actually dare address the Marcott et al Science paper.
You obviously read this, Sphaerica…
A tortured way of saying if the purpose is different the focus is necessarily different. Wrong.
Paul Dennis writes:
“I have and continue to spend a huge amount of effort and time trying to establish a rigorous proxy for mineral growth temperatures. Ones that have an a-priori physical basis that can be described by thermodynamics.”
Paul, you are the man. Good to hear.
Two points:
1) I thank you for your service sir. Your pursuit of truth and dedication to science has done us unestimable good.
2) I feel sorry for Marcott – who had a great PhD, and was likely taken advantage of by zealots. While his Advisors are trying to craft a way out of the mess of lies they created – it is HIS name that has been sullied. One only has a single reputation while were here, and his has been hijacked to someone else’s purpose. If I were he (PhD in hand) – I would use the occaision to expose the chicanery and let the world know what is going on here.
They knew, full damn and well what they were doing. And why. And they traded on his name. Shame, shame, shame.
Steve said
“Marcott state in their archive – in my opinion, with unwarranted optimism – that there is zero uncertainty in the 0 BP dating of the core top.”
There is zero uncertainty about that.
Marcott clearly stated in interviews that:
“we can be dead certain [the shells] are recording the temperature we think they’re recording”
So it’s only a mater of matching the dates with the temperatures, which they did.
Steve: Marcott et al were likely 1000 years off in their dating of the core top of ND95-2043. It’s a little cheeky to then say that there was zero uncertainty. If there is core loss, then there is always uncertainty in the dating of the core top.
Steve,
Thanks. Apart from the certainty issue – suppose we take him at his word – I would think he might have said “We’re dead certain we are interpreting what the shells are doing, correctly”
Whereas the way he said it was that the shells are recording what he thinks.
I think it’s strange wording.
On these Marcott related postings, I have been checking Real Climate regularly, for a response or comment on the Marcott el al paper.
Nothing yet.
But I wonder how much of an uptick in traffic you have caused there?
Except for the 20th century uptick, Marcott et al 2013 appears as an otherwise unremarkable paper in the literature on Holocene Spanning Paleoproxy Temperature. In response to the Steve McIntyre led critique / audit, if the paper’s authors decide to formally disclaim the meaningfulness and correctness of their adjustment of the proxy data’s dates they used for the 20th century, and also they disclaim their methodology focused on the 20th century, then there is no AR5 significance to their paper.
The MSM PR blitz that accompanied the announcement of the paper’s publication cannot be significantly undone, OK. But AR5 staff cannot act like the MSM in regards to the paper. I think they will need more than is shown in the published paper to accept its conclusions as significant or they will look superficial in the eyes of the broader paleo-proxy community.
A spotlight is on AR5 staff to credibly assess Marcott et al 2013.
John
The Wikipedia Hockey Stick Controversy page has been quick to note this ‘extension and confirmation of the hockey stick graph.’
http://en.wikipedia.org/wiki/Hockey_stick_controversy
The citation is the NYT article, however the Science paper is listed in the references.
I cant see any edits recorded on the ‘history’ tab since late January
Funny how in the old days it would take years for new research to impact in encyclopedias, and so there was no problem with ensuring that it had been well scrutinised. Now the controversy and the encyclopedia interact in real time.
Probably old mate Connolly’s work … he’s well known for this type of thing.
berniel:
Further valuable evidence of how early the books were cooked and to what extent. Despite this pathology the small latency of Wikipedia is mostly good. But it can be terribly misused. A sterling example.
I edited my first Wiki page this morning. I’m wondering how long before my addendum is removed:
http://en.wikipedia.org/wiki/Shubenacadie_Sam
It concerns Punxsutawney Phil’s indictment for “Misrepresentation of Early Spring”. My bet is that if it lasts a day, it’s probably good for almost a year.
Hmm, those changes take us deep into the ethics of Wikipedia. I’m outta here 🙂
berniel –
Odd that you don’t see it in the history tab. It shows to me as a March 10 edit by “Dave souza”.
Thanks, Harold – I should have checked, not taken the word of a third party for it. This difference between revisions shows all Souza’s additions on 10th March.
Shockingly, the Hockey Stick Controversy Wiki page has no mention of Andrew Montford or The Hockey Stick Illusion. After all the book has its own Wiki page and you would think the Wiki editors could find that connection; must just be an oversight. But, hope still remains! After all, in Wikipedia’s own words “over time quality is anticipated to improve in a form of group learning as editors reach consensus”.
Once again, consensus will lead us to a brighter tomorrow!
From Shakun 2012 (co-authored by Marcott):
and
So what changed to make them decide to use 0BP for core-tops?
Many thanks to Rud Istvan for his post at Climate Etc for laying all this out in a simple and very clear fashion. As done here a bit at a time and in detail it was a fascinating story but a bit hard to follow, but Rud’s piece is a nice and not too technical synopsis.
Thanks, but I am a mere lawyerly scribe for a true giant, Steve M, whose blog we are all privileged to read.
What motivated my second post over at Judith’s was the simple embarrassing fact that Steve (correctly) said I was half wrong. I don’t hate that, I love it. Truth advances, and I learned a lesson that will not soon be forgotten.
Just in case you haven’t run across this, Steve, Tamino has a post about Marcott:
You’ll find the March 22, 2013 at 3:16 am question and Tamino’s answer interesting:
Generous isn’t he?
Re: Bob Tisdale (Mar 22 05:14),
oh, Tamino is now up to the task. Is that what the authors have been waiting for? Another one who does not understand that you can not glue the instrumental record to the end of the reconstruction unless you assume that the mean of “MWP” in Mann’s EIV-CRU is accurate. Another one who is happy to join the reconstruction curve in resolution of hundreds of years with a curve nearly in an annual resolution. Had the latter thing done over WUWT, he’d gone nuts.
Steve’s first chart in his “Marcott-Shakun Dating Service” shows us how sensitive the end section is to dating – from about 1700 onward it’s a crap shoot. Tamino himself presents 3 different versions: Marcott 2013, Calib and RegEM, which all have quite different endings. Yet still Tamino has no qualms about picking one of them, RegEM, for his overlap exercise which relied on the last 80 or so years. Apparently simply being the more modest one of the bunch made it sufficiently robust for that.
Tamino’s three variations all use Marcott core dating.
No one has ever suggested that the Holocene Optimum was 3-5 deg C warmer than the 20th century. If doubling of CO2 results in a 3-5 deg C temperature increase, then the world temperature will be substantially warmer than the Holocene Optimum (or the Medieval Warm Period). This observation is hardly original to Marcott et al. Nor is it a point that Hubert Lamb or Richard Lindzen would dispute.
Marcott was originally presented as a sort-of confirmation of Mann’s Hockey Stick claim that he could “skilfully” reconstruct past temperatures, with the reconstruction “skill” particularly including the reconstruction of the 1850-1980 period, where his RE statistics were calculated. (There are obviously many issues with his claims, but Mann’s supposed reconstruction of the modern temperature increase using proxies is clearly integral.)
Marcott came out of the blocks as also supposedly reconstructing the modern temperature increase using proxies – thus providing a sort of confirmation to Mann’s program. However, this aspect of the Marcott analysis proved to be totally bogus.
As has been observed, the dating errors of the modern portion of the Marcott reconstruction do not appear to materially impact the Holocene portion, which accordingly need to be evaluated on their own terms. I think that there are important issues relating to the Holocene portion, which also need to be analysed. However, thus far, Marcott et al, following the Mann playbook, have conceded nothing, not even the obvious and grotesque redating errors now known to many.
Tamino’s position seems to be that Marcott et al should be evaluated only as a sort-of activist sermon. And that pointing out even grotesque errors in an activist sermon is allying oneself with forces of heresy.
However, if, as I believe, Marcott et al is to be evaluated as a scientific article in a leading journal, then I think that it is both reasonable and appropriate to expect competence in data analysis and that errors be promptly acknowledged and corrected – including re-issue of all impacted graphics. My estimate is that re-issued graphics would have a materially different appearance than the published ones. Regardless, if the article is a scientific article and not a sermon, the errors should be addressed and corrected without a whole lot of whining.
Re Steve McIntyre, March 22, 10:42: I don’t know, of course, how draining it may be for Mr. McIntyre to keep going over points such as “Regardless, if the article is a scientific article and not a sermon, the errors should be addressed and corrected without a whole lot of whining,”, but I am grateful that he keeps it up. Richard Feynman somewhere nods his head in agreement. Ditto for SM’s continuing to replay Simonsohn’s remarks about publishing “failed” calculations as well. If we care about science itself we should all make ourselves “disciples” of Feynman and McIntyre in this regard–this much is obvious.
It’s interesting, Richard Telford does fly bys here, never really engages for a discussion or debate when challenged and on Tamino’s gives a following comment:
“…These errors in re-dating will not have had a material affect on the rest of the reconstruction, as such re-dating is an irrelevant diversion, a mud-throwing exercise.”
Sven:
That is not quite fair: RT’s full statement is
We need to know more about the nature and scope of the redating. Since Steve’s focus has been largely on the modern spike then RT’s assessment of it not being material maybe valid. For the three proxies I looked at I could see no material redating. His gratuitous comment at the end is unreasonable but it may be the price of having his more material point get through Tamino’s moderation.
I agree, it might have been unfair, but I’ve never seen him using this kind of language here on CA. Or is it the surroundings that one has to accommodate himself to (as, in a way, you also suggest)?
If I recall correctly, Tamino’s moderating policies are considerably more relaxed than those of RealClimate and others of that ilk. Of course, that may have changed.
Has anyone tried to respond to the points in Tamino’s post?
Telford’s remarks, however, do take the attention away from the fact that the Marcott authors show that the variability in their reconstruction over a period of 300 years is zero and that the reconstruction ends in 1940 by his placing it instead on the uptick. He should have made perfectly clear that uptick or not going back in time with that limited resolution makes comparison on a 40 year warming period starting after 1940 with a temperature series that would not even show a 300 year change in average temperature.
I personally judge that Telford’s shrugging here says more about Telford than the Marcott authors. Minimizing and playing down sloppy work does not help the reputation of his profession either.
It might be that his moderation policies are more relaxed… I left a following message there that never saw the light of the day
“[Response: Mainly, that he decides what he wants the result to be first, then tortures the data until it “says” what he wants.]
You mean Marcott, right?”
I do agree that it did not add anything substantial to the debate, but this “projection” of intent (that fits so much better to the Open mind (sic!), RC, Romm, Marcott, The Team) was really funny to see.
I think it is always good when folks of differing opinions participate, even if they do not do so exactly as one might wish. A good policy IMO is to respond to the content – as presented – and ignore the rest. Challenge is good as well – but should be respectful, even if you disagree, or feel there was a lack of respect from the other person. The goal should be to engage, to the extent possible – and not to make it unpleasant and drive folks away, even if you feel they may deserve it.
Sven (Mar 22 07:57),
What I don’t get (and neither does Steve Mc, AFAIK) is exactly what in the “rest” of the reconstruction is important if the recent uptick is eliminated? Besides, I haven’t seen anything from the Marcott supporters which talks about the problems in the re-dating. Several people here have agreed that several of the re-datings are grossly improbable. Admittedly these errors might not affect the reconstruction greatly, but neither do they enhance it and the only reason they weren’t caught seems to be that, whether consciously or not, the authors liked the uptick that was a result.
daved46 (Mar 22 10:44),
BTW, I’ll give you a real-life example of what I mean. I was doing a job which involved scanning in numbers. As a check we’d add up the numbers in each batch and compare that to what the scan showed. If they didn’t match we had to go through the scanned data compared that to amount on the papers being scanned. It was the end of a month and management had offered a free lunch reward if we reached a million that month. We were a bit short staffed so there was pressure to get throughput. I volunteered to use a scanner I hadn’t used before on receipts I hadn’t scanned before so I found one of the first batches didn’t balance. I started comparing the data and found some errors from the scanner which made things balance, so I quit. A couple of weeks later they got complaints from a couple of donors (it’s a charity) that they were credited with the wrong amount. Going back and looking there were additional errors which I hadn’t found because I quit too soon under the pressure to get done. Ended up costing me that job, which was not a big loss, but still an “ouch” for me for quitting too soon.
Doug | March 22, 2013 at 3:16 am | Great explanation Tamino. I understood and it and I am not that o fey with this stuff, so what’s McInt’s problem?
[Response: Mainly, that he decides what he wants the result to be first, then tortures the data until it “says” what he wants.]
And you are implying what exactly?
This is OT, but I think it should become widely known. Steve has plenty on his plate and may not want to spend time looking at this paper, but hopefully some other interested parties might be inclined to spend time on it. I don’t have the mathematical/statistical chops to do it.
Giss has added a new wrinkle to their temperature data processing. Virtual temperatures. It is only being done at one station for now, but I can visualize a worldwide expansion coming if they can get it to be considered acceptable. What a rats nest that would be to examine.
In the Antarctic at Byrd Station they are using ERA-40 and ERA-Interim reanalysis models to do wholesale infilling of temperatures in order to come up with a nice tidy complete record from 1957 to present. Previously there were two separate records. Byrd Station which had almost complete data from 1957-1970 and the automatic weather station(AWS) installed in 1980 with considerable missing data from 1980 to present. They have now filled in virtually the entire decade of the 1970s, except for a few stray months where they actually had observations. From 1980 on several entire years have been filled in along with many other missing months.
They say they are making use of data from other stations, but a quick check shows most of those didn’t start until the 1990s at several hundred km distant, and for most of the 1970s only Amundsen more than 1100 km away is available. I’m not the sharpest tack in the box, but as the distance increases so does my skepticism about validity of any temperature relationship between locations, and I sure don’t have much confidence in models.
All this new data(?) comes from a paper published in December 2012 by Bromwich et al titled “Central West Antarctica among the most rapidly warming regions on Earth”. They compare their reconstruction to several others and say their record shows stronger warming than all the other reconstructions.
New improved Byrd data(?) can be found here along with links to the paywalled paper and free supplementary information.
http://polarmet.osu.edu/Byrd_recon/
Free paper can be found here.
Click to access 20130224004616_0.pdf
Tedswart,
Yes it would be nice to see a rebuttal in one of the more ‘respected’ journals. But it would be nicer by far to see the takedown featured somewhere in the MSM. I can not imagine that any unbiased observer with any sort of science or math background that has taken more than a passing interest in the topic is even slightly confused as to the validity of the posterchild paleo reconstructions, including the people who authored them.
As you have noted:
“The process of pulling the wool over peoples eyes has gone on far too long and the sooner that it is brought to a halt in a definitive manner the better for all of us.”
I would say that of the all the papers artfully deconstructed by SM, this one is by far the easiest for the non-specialist to understand and as such makes for the most appealing target.
Just showing a spreadsheet where the rows are dates, the columns are proxy, and the cell values are temps, and showing the before and after effect of sliding the proxies up and down the columns is very easy to present and very easy for anyone with a high school diploma to understand. Mann, Steig, etc. require more understanding on the reader’s part as the mathematical subterfuge is more ‘clever’ and only accessable to the non lay audience.
Though perhaps from a purely ‘tactical’ perspective, one might wish that this particular bit of ‘research’ becomes canonized in AR5, before attending to its denouement.
I don’t grasp the “theory of error” talk. Why would a general one be needed?
Errors have many causes, including psychological. Techniques to estimate them are in use, have long been but perhaps more sophisticated today.
(David Harriman’s book on scientific discovery, “The Logical Leap” has at least one example of a person’s religious beliefs probably contributing to a fundamental mis-direction in his scientific exploration. Today the Marxist faith is full of that, covered in pedantic detail in the book “Higher Superstition: the academic left’s quarrel with science” and the later “post-normal science” scam, which appears to be based on emotions as a scientific method. (Emotions coming from sub-concious processing of stimuli against stored beliefs.))
An applied example of a psychological cause may be what pilots call the “gethomeitus” cause of errors. Focus on getting to the destination leads to failure to grasp the complete picture, thus recognize clues to hazards and properly evaluate level of risk. (Often pressing on into deteriorating weather – perhaps a failure to recognize slow deterioration below a risk level and/or a shift in acceptable risk level.)
Perhaps there’s a parallel in some of Marcott et al’s recent errors, though many people aren’t so benevolent about their work.
Me, I’m still trying to respond properly to “inklings” – the feeling I am forgetting something. Such as (a simple example), having picked up my bag and jacket I have an inkling I am forgetting something – can’t think of anything on the fly so I proceed to my residence. Then remember the groceries in the back of my vehicle. (Hey! no smart remarks about aging memory. 😉 That’s one reason I adopted a policy for engineering work of sleeping on a decision.
“I don’t grasp the “theory of error” talk. Why would a general one be needed?”
It’s pretty simple. In the absence of a theory or methodology for handling mistakes, you can find yourself in a world where anything goes in terms of explaining mistakes.
As it stands we have mere heuristics, like Hanlon’s razor but no real methodology for understanding mistakes. What it means, especially in a post normal situation, is that
people tend to interpret all mistakes or errors as intentional. In short, it a call for being more scientific about the interpretation or understanding of errors or mistakes. Ironically, we demand that folks follow the scientific “method”– eg try to find the error, but there is no clear cut method for understanding how errors are made in the first place. Put another way, we have theories of knowledge but no theory of stupidity.
http://en.wikipedia.org/wiki/Hanlon's_razor
Measure twice, cut once is a theory of error. My own personal theory of error is that we are not really human. Rather we are moronic proto-humans who just think we are human. It’s a form of the Dunning-Kruger effect that applies to experts and punters alike. I first developed this theory when raising my kids during the height of the self-esteem movement. Basically, it’s very easy to be cocky about one’s skilz in data collection, analysis, interpretation and resulting actions. The social pressure to function like a human causes people to deny or cover up mistakes rather than own and learn from them. As work becomes more detached from the physical world, people experience fewer painful reminders of errors and have better and better tools to hide errors.
In my moron theory, however, how errors are made are less important than having a procedure for exposing errors. To do that, it is critically important to accept that we are all morons and we will all make mistakes, therefore, there is no shame in admitting mistakes. This is hard to overcome because of the social pressure to appear human and our vanity. The sin of pride is our major malfunction that must be battled every moment of every hour so that we can see our shortcomings.
In the early eighties I studied Mathematics in Leiden; I also took practical training in Physics. One day my class mate and I had to observe and count Newton’s rings though a microscope, which took a couple of hours. At home we analyzed our measurements and computed the wavelength of the light. This turned out to be a negative value.
Trouble. We did not feel like going back to the -historic- Kamerlingh Onnes Laboratory to redo the experiment; we were a bit too lazy. We had heard vague (possibly false) rumors that some students “recomputed measurements”, but we did not consider this option (due to our integrity of course, but also due to our laziness again). So we submitted our report including the negative wavelength.
After a next week the teaching assistant had checked our work, and he gave us a fairly good grade, to our surprise. He was even enthusiastic because we had experienced that the experimental method (involving subtractions in the analysis) was error prone. This was a very good lesson for us not to be ashamed in admitting mistakes.
Howard,
Then I guess Murphy’s Law is a theory of error too. =-O
Andre: That’s a nice story, it sounds like we might be about the same age. One of my other theories is that laziness is the mother of invention. I like to think that sometimes doing nothing is the best action! Of course, my wife does not share this view.
Jeff: Murphy is still around, but his law can be a dangerous pride trap as well. In aviation safety and weather, one old pilot-writer claimed an inverse Murphy’s Law: If something can go wrong, most times, it won’t. This allows bumbling along, oblivious to mistakes we make all the time and nothing bad happens, rather, things go very well. “Man, I’m good.” This false positive confirmation bias can result in a future fatal accident.
I am with Keith here. I have difficulty understanding how a “Theory of Error,” could be phrased, much less put into practice. Mistakes and errors, in the first place,cannot by most definitions be styled as “intentional.” That is if something is done intentionally then it is something other than a mistake or an error. In the case at hand, we are waiting to see if the paper’s authors have an explanation for what they did. If they deliberately fudged the data then that was an intentional action on their part. If, on the other hand, they did not understand or misunderstood the appropriate way in which the data/dates should be utilized, then that would be an error or a mistake. And that, it seems to me, is all the “theory” you need to have in order to deal with this situation.
Mosher,
It’s interesting that you should report a “theory of error” Friend on faculty of med school found himself teaching a course on error handling. the motivation for the course was that their students arrived at med school following educational careers almost without error – you don’t get to med school by making mistakes.
The school believed that once turned loose in medicine they would make mistakes and needed to develop some comfort with them, and a small array of constructive reactions.
Astonishingly, students who claimed not to make mistakes regularly appeared in his class – which was required by the school.
My thesis advisor many years ago was Chris Argyris spent his entire career as a social psychologist addressing the issue of how individuals and organizations handle errors and learn. His Harvard Business Review article Teaching Smart People How to Learn is an excellent illustration of his approach and his findings.
Bernie,
thanks for the article. I discovered during my career that in hiring engineers it was productive to ask them what the worst mistake they’d ever made since going to work, how it was discovered, and what they did about it. I have a couple of really wonderful stories heard in response to this question.
I did this because i found that people who thought they never made mistakes were often those whose mistakes had not been discovered, or worse, had been concealed.
After happening upon asking this question, I never hired anyone who didn’t have a story.
j ferguson:
What you instinctively did was what is termed “Critical Incident Interviewing” originally developed by John Flanagan in order to determine the reasons for differential casualty rates among bomber crews during WWII. It was refined by, among others, David McClelland, a Harvard Professor and another of my mentors. Originally the interviewers just kept notes but we refined the process to use tape recorders and systematic coding schemas. It is amazing what people will say once they become fully involved in retelling their stories and how memorable some of those stories are. It is also amazing how bad most interviewers are, whether they are managers interviewing job candidates, tv journalists interviewing politicians or members of boards of inquiry interviewing witnesses.
Bernie,
As you surmised, I had no management training. I ran operations where mistakes could be very costly, even deadly. I read Clausewitz at one point and found his suggestion that a general should expect a steady diet of bad news. If he wasn’t getting it, it was being kept from him and he should make every effort to discover the reasons – most likely in his own behavior.
So I started to encourage the flow of bad news. I had found that many of our most costly mistakes had been discovered while the cost might better have been contained but were not revealed at the time of discovery because their authors thought they would either look like idiots, or look like idiots and be fired.
I found that relating some of my more shocking errors improved the flow.
Steve’s approach to a kind of open lab notebook on the web should be studied closely and compared to other recent developments in correction of error via more “open” science. The worship of peer review by one journal, one time needs to be displaced by more continuous forms of critical review over time. AND, when scientists have embraced publicity as in the Marcott et al. case it is highly appropriate to expect rapid public discussions and feedback from various angles. Compare to the still unfolding NASA study’s “arsenic life” saga in which the study authors conducted a blaze of publicity, then tried to hide behind a “peer review” wall to forestall public questions and criticisms:
http://www.nature.com/news/2011/090811/full/news.2011.469.html
Bernie,
One other thing: On reflection, it appears that my most astonishing mistakes (at least the ones I’m aware of) were made in areas of my greatest strengths. It seems, to me at least, that I seldom screwed anything up in an area i was struggling with.
Errors are a fact of life, they happen, at the time of awareness they provide a highly charged opportunity for learning and when willingly shared can drive a whole society forward.
However if the resultant energy is directed toward denial and the preservation self esteem errors can become a very destructive force.
I remember one of my inroganic chemistry practicals involving an electrochemical synthesis. At the end of a very trying day I just reported my results: a 0.1% yield of the desired product, with an estimated purity (by the method given) of 140%. What could they do except pass me?
I was about 5 minutes from finishing a long and boring titration experiment when the 1965 North American power blackout hit. After waiting a little while, we realized that this was not going to get fixed in a few minutes. It turned out that the blackout covered all of eastern North America though news was not instantaneous as now. I didn’t like chemistry lab much in the first place.
This area seems to be the part of the discussion devoted to people who don’t know how to click on “Reply”.
I did press “Reply” but it ended up down here anyway.
Stephen refers to types of coring tools.
A quick search included these general articles
https://en.wikipedia.org/wiki/Scientific_drilling
Woods oceanography institute has a list of what tools they have and some info on each, try starting at http://www.whoi.edu/corelab/hardware/index.html. Note claim that some tools preserve the top of the core while others are more suitable for 3 to 15 meters into the sediment.
“bomb spike” I take to be the large increase in amount of the carbon-14 isotope resulting from several nuclear weapons tests circa 1950s, that released into the atmosphere.
Carbon-14 is commonly used for dating, as it is absorbed by living entitities and decays at a known rate to Nitrogen-14. (Yes, there is debate about decay rate.)
Note that atmospheric testing was done over a range of 9 years.
As was briefly noted, coring in soft material is difficult to do well. Some coring tools are complex to reduce loss of soft material, some methods include a diver. (I suspect people tend to thing of ice – though not losing CO2 is a concern – and rock – though apparently BreX fell into the trap of a chain-of-custody gap that facilitated salting the core.)
Steve: The “bomb spike” for core dating is different: it is the tritium spike associated with the H-bomb tests of the early 1960s. It is regularly observed in ice cores and used as a dating control. Its presence in an ocean core shows that the top portion of the core includes material from the 1960s.
Agreement with Mann08 on the uptick
I wonder, could someone clear up a matter that has been bugging me…
There has been little discussion among folks-in-the-know about the Marcott et al uptick being out of phase with the Mann08uptick. Their trending seem alarmingly out of phase with relatively enormous temp differences in the years around the early 19 Century. The two lines are actually diverging. Yet the Science paper says:
Indeed, Mann08 is just within Marcott’s enormous uncertainty in the early 19th Century. But then the Marcott uptick breaks out of Mann’s uncertainty range. And, anyway, can they have it both ways? Can they argue for the uptick in the first half of the 19 Cent while at the same time say that it agrees with the not-yet upticking Mann?
It is interesting to compare the corresponding passage in the Thesis where the uptick is absent. While a dip in Mann08 below Marcott in the last 500 years is noted, this difference is within their (large) and Mann’s (smaller) uncertainties, and the Mann uptick emerges neatly out the end of the (non-upticking) Marcott graph at 1950. The Thesis commentary matches this observation well:
The thesis comments on ‘the difference between our two methods of reconstructing the temperature’ that is ‘most apparent for the last 500 years’ (i.e up to BP 0). But yet the Science paper does not comment at all on a much more alarming difference in the early 19 Cent. And this difference is considered significant. Leave aside the spin in the press and recall this claim from the penultimate paragraph of the paper:
Can they have it both ways? It seems to me that there is self-contradiction in the paper itself that would be apparent to a reviewer without so much as a glance at the Supplementary Info.
My understanding is that what they refer to as Mann08 is the EIV part of CRU+EIV, and finishes in 1850. From there on it’s CRUTEM.
Steve: it is very odd, to say the least, that Mann08 spliced instrumental temperatures with proxy reconstructions, given Mann’s previous strident denial that any climate scientist had ever done such a thing, a deed so perfidious that even the accusation suggested instigation by fossil fuel disinformation. Nor is it a necessity of the technique as it is entirely possible (as in my implementation of EIV) to extract the estimate in the calibration period as well.
Re: Nick Stokes (Mar 26 05:55),
yes, you are right although to nitpick the post 1850 is not exactly CRUTEMP3 but a slightly mannipulated version of it. Mann has (to his credit) taken care of never actually splicing the EIV-recontructions with the instrumental part in the same graph, and, although he’s giving the numbers combined in the same sphredsheet, he’s explicitly warning that post 1850-numbers are instrumental record. Apparently Marcott et al didn’t realize that and joined the reconstruction (green in Mann’s graph) together with the instrumental (red in the graph) into a single “reconstruction”.
You are also right that it is possible to extract the reconstruction also from the calibration period although it is not done in any of Mann’s publications. Is your implementation available somewhere?
Edit: the last paragraph refers to Steve’s (originally non-bolded) last paragraph, which I thought was a part of Nick’s comment.
Thank you everyone for your answers.
There is some progress here, but I am still confused…
How can Mann08 refer only to the proxy results in the Mann et al PNAS article? In that article the CRU instrimental uptick always appears in the charts giving the proxy results.
One explanation is that, because the novelty of the PNAS article is the new proxy results, therefore it is clear to those-in-the-know that that is what it is referred to when the Marcott et al text talks of ‘the Mann et al [2008] reconstruction’. Is that right? (I think Jean S and SM are saying that is not so clear.)
Let’s say that Mann08 does indeed only refer to the new proxy recon in PNAS. Then the claims in the text of Marcott et al about their results being indistinguishable from Mann08 are only referring to the new proxy results introduced into the Mann et al 2008 PNAS article — which clearly end at 1850.
If so, then my more specific question is about their Fig.1: Why would they include in the comparison chart (1.A) the instriment data with the post-1950 blade? Not only does the extension confuse and distract from their claim in the text, but it presents a clear visual contradiction to AGW — of the late-industrial age forcing.
I have a number of thoughts about this…
1. Perhaps it was a rush job. In the Marcott thesis, the hockey stick blade poking out the end looks neat. Then they re-jigged the data to produce their uptick, but they did not bother to go back and remove the CRU blade in the comparison.
2. Perhaps reviewers insisted on the blade appearing.
But these explanations seem to be a stretch, especially because I don’t recall seeing the Mann proxy reconstructions published sans intrimental blade, not in PNAS, not anywhere. If it were published without the blade then it would look too ordinary; it would look too much like these charts by Jones and Briffa also born in 1998 but now forgotten:
And so that brings me back to it being a reasonable presumption of the reader of the text of Marcott et al that ‘Mann08’ refers to what is depicted in comparison in Fig 1A, which is the entire hockey stick (Mann et al.’s global CRUEIV composite mean temperature).
And thus, to my original question above…How could Marcott et al be thinking they could have it both ways? How can they argue for the uptick in the first half of the 19 Cent while at the same time claim that it agrees with the not-yet upticking Mann? Is this as plainly contradictory to an expert as it appears to me?
Berniel,
“If so, then my more specific question is about their Fig.1: Why would they include in the comparison chart (1.A) the instrument data with the post-1950 blade?”
Yes, Fig 1A is a mess, and it would have been better and clearer if they had graphed only the pre 1850 parts of their reconstructions along with Mann EIV alone.
However, it’s true that the CRU/EIV combination plays a special role here. They want to align their recon with instrumental temps but can’t do so directly because of the mismatch in resolution. So they use CRU/EIV as an intermediate. The EIV is long enough for their 5×5 stack to match, and is made up of proxies which do have enough resolution to align with instrumental, and this has already been done in Mann’08. So in that indirect way they achieve the alignment with instrumental, and maybe that is what they wanted to show.
Incidentally that may be the reason for using CRUTEM. It doesn’t seem the best choice for their substantially marine proxy set, but Mann’08 had better reasons for using it.
On your later question, it’s true that in Mann 08 Fig 3 the EIV reconstruction is shown with the CRU series, but it is clearly marked as a separate curve, terminating in 1850.
Thanks Nick.
I am now of the view that aside from what SM has found in his audit, there is prima facie in the actual text of Marcott et al a clear contradiction of the conclusion that Our results indicate…Global temperature…has risen from near the coldest to the warmest levels of the Holocene within the past century… This conclusion is contradicted by their clear statements about the low resolution in the proxies and the uncertainties.
Perhaps I am rather late to that assessment! But what is also now clear concerns the comparison with the Mann08 and how it impacts on this conclusion.
Let me first clear up something. In Marcott et al the comparison with Mann08 is always intended as a comparison with the entire composite graph in the 2008 PNAS paper, including the CRUtemp hockey stick ‘blade.’ Despite what Nick says above, I can find no reason to interpret the paper otherwise.
And this takes me to my original concern. Why is it there? Far from supporting this most celebrated conclusion, Mann08 draws it further into question. Even if the low resolution could be overcome to permit the rapid uptick to 1950 as a valid result (as I guess they somehow try to establish with their normal distributions in Fig.3), then this is challenged by Mann’s higher resolution proxies in the last 500 years BP (showing consistently greater cooling), and then entirely contradicted by the CRU super-high-res instrument data — which gives no sign of an uptick around 1950, instead, holding it off a few decades. In short, the authoritative CRUtemp part of Mann08 suggests there is something wrong with any suggestion that the low-res proxy-based Marcott uptick is anything more than a blip, noise or faulty analysis.
All together, this leads me to believe that there is a contradiction prima facie in the article sui generis — on its own terms — a problem that should have raised concerns in the peer review.
But, again, why is the shadowy Mann08 there in the chart?
I can only say that a comparison with Ch 4 of the Marcott Thesis suggests that the uptick conclusion was at some stage hastily inserted into the narrative with the minimum of modification…
In the thesis, Marcott’s connects his proxy data with the proxy part of Mann08 and then leaves it to Mann08 to make the connection with the more accurate, more-trustworthy high-resolution instrumental data. Were the blade happens. And this worked well. Marcott has done is bit, just as the thesis explains in confirming the Holocene background. But there is no glory to Marcott in repeating the familiar Holocene curve, and no chance of high-end publication as he may have discovered with a rejection from Nature. Then, two years later, we find the Science article with the uptick at the very end of the low-res proxy curve, but yet with not so much as a discussion of its contradiction of the more authoritatively high-res CRUtemp uptick! A desperate grab for glory? Something (vanity? ambition? desperation?) seems to have blinded all to the awkwardness of the result — an awkwardness that was immediately apparent to this novice when he first set eyes on that two-horned beast.
berniel:
I would write and ask Marcott and/or Shokun directly.
Since, according to Gavin, Mann’s best reconstruction can’t be validated prior to 1500 CE, the “last 1500 years” statement has no scientific basis.
Mann himself said that after doing a sensitivity test to remove the tree rings and the upside down proxies the reconstruction was no longer valid. “This additional test reveals that with the resulting
extremely sparse proxy network in earlier centuries, a skillful reconstruction is no longer
possible prior to AD 1500”.
>>”They will try like hell to figure out some way of “getting” an uptick from the proxies using some other method and then proclaim that my criticism was “wrong” because they could still ‘get” an uptick using some weird methodology not contemplated in the original article.”<<
In order to demonstrate the game that's being played here, it might be interesting to apply some weird methodologies to the same data to produce downticks. Make up two weird methodologies, and now you have "independent" confirmation of a downtick.
Interesting posting by Clive Best (clivebest.com/blog/?p=4790) from 23 March arguing that the uptick is principally the result of using 20 year interpolations, and that the re-dating compounds the problem but is not the only cause. This also has been reblogged on Tallbloke’s Talkshop. Worth a look.
“I therefore suspect that Marcott’s result is most likely an artefact due to their interpolation of the measurement data to a fixed 20 year timebase, which is then accentuated by a re-dating of the measurements.”
Steve McIntyre
Re: “dating errors”
You may be interested in: M. Mudelsee et al. 2012 Effects of dating errors on nonparametric trend analyses of speleothem time series Clim. Past, 8, 1637–1648, 2012 doi:10.5194/cp-8-1637-2012
After citing Shakun et al. 2012 (though not Marcott et al.) they aim:
Best
I can see how a somewhat tortured argument can be made for how the redating came to pass – blindly follow the reset-to-1950 default and don’t question the result.
More worrying from a reputational standpoint, the “NA” present in recent uncooperative proxy measurements.
How and why?
Re: “low resolution” — some people are referring to the data as low resolution because it may only be every 100 years at a site, but it can be low resolution because the data integrates across time or space. For example, a minimal thickness sample in a core with a low deposition rate might represent 100 or 200 years of time, with the data for that sample being the mean value of temperature over that interval, not a point sample in time. Pollen samples in lakes represent a large area from which pollen is blown and washed in, not a point in space. Having closer “dating” may not fix this problem.
Over the years I have found reading Nick Stokes so frustrating. He clearly has a grasp of statistics, even to the point of brilliance. But he refuses to evaluate the issues he does not want to see: several times in the comments above he insists on comparing an unsmoothed current instrumental temperature series to a proxy “temperature” series with 300 year smoothing!
Clearly, if we smoothed the instrumental data with a 300 year filter, the 1975 – 1998 “blip” (as it would be on that time scale) would have minimal effect on the instrumental temperatures.
I would love to hear from someone who can help me understand. It is simply philosophical blindness? He can’t allow himself to see what is right in front of his nose?
For me, the cognitive dissonance would drive out what little sanity I still retain! Can Nick just ignore the dissonance by some method of compartmentalization?
Re: David Jay (Mar 27 10:11),
Nick Stokes at Climate Audit is a bit sui generis. Nick-the-scientist’s comments can be very perceptive, and when inspired, he creates useful and elegant tools that promote informed discussion.
One has to be wary of a phase change that arrives quite abruptly, to Nick-the-advocate. That commenter’s remarks have to be read for their amusement value. On a previous Climate Audit thread, you can experience the Advocate’s spirited defense of Mann08’s upside-down use of the uncalibratable Tiljander proxies, with a tip of the hat to Laurel & Hardy’s “Who’s on First?” routine. Here is the point in that Tiljander thread where I drew a comparison between Nick-the-advocate and famed criminal-defense lawyer Racehorse Haynes.
That said, it’s a pleasure when Nick-the-scientist appears; I urge him to hurry back.
Any response from the new team players?
Will you be forced to use Anthony’s “Crickets el al” response video?
I admit some amusement& bemusement at Shakun & Marcott, even if the press releases were purely opportunistic, surely they would have anticipated the obvious weaknesses in this paper and had cover and confusion responses ready to roll?
Their silence is damning.
What has happened to the sequencing of comments on this site?
Marcott’s reconstruction can say nothing (assuming that the proxies are reasonable thermometers which I do not judge has been shown to be the case) about any warming period of the length of the one we have experienced recently by the paper’s own admission. The advocate and advocate/scientist have to use double talk and some rather unscientific assumptions to make the comments they do. The paper is the science that we can all evalute on our own terms. The Shakun comments to the media have nothing to do with the science and more to do with the idea of marketing an advocacy point of view. His efforts do not help his standing as a scientist.
His vague references to some kind of averaging process making the proxies better thermometers also does little to help his professional reputation.
“We just experienced 4,000 years of global warming in two decades ”
http://www.vancouverobserver.com/blogs/climatesnapshot/we-just-experienced-4000-years-global-warming-two-decades
You guys are smart, what’s the most effective counter argument to this for a layperson?
An unreliable and hostile witness, I’d say.
re: Aldous: The Marcott reconstruction, as admitted by the authors, is a low-resolution reconstruction, with data for individual series often more than 100 years apart. If you took one measurement for the 20th Century you wouldn’t know much about the recent rise, would you? The noise in the records plus the way they resampled the data (Monte Carlo) further smoothed out the result, meaning that any fluctuations that lasted less than 100+ years and less than an unknown magnitude are all smoothed out in their recon. Simply can’t compare this to the recent uptick which is on an annual basis. And they should know better.
Aldous, I have previouslyexcerpted from Marcott et al their comments on a spectral analysis they did of their reconstruction whereby they state that nothing can be said in their reconstruction variablity for periods less than 300 years and for years in between the period variability captured by the reconstruction goes from 0 at 300 years up to 1 at 2000 years. I will not show that excerpt here as anyone can find and look at the SI of the paper and read it for themselves.
The best place to look for refutation of the advocate/scientist is most often their own works. Think of the advocate/scientist in advocate mode more or less like you would a politician arguing his case. He might be a little loose and fast with the facts of the matter.
Thanks for taking the time to reply, gentlemen. This contrast between their advocacy and what the paper actually says/does reminds me of a joke I heard today:
A man was stopped by a game warden in Northern Minnesota recently with two buckets of fish leaving a lake well known for its fishing. The game warden asked the man, “Do you have a license to catch those fish?” The man replied to the game warden, “No, sir. These are my pet fish.” “Pet fish?!” the warden replied. “Yes, sir. Every night I take these fish down to the lake and let them swim around for a while. I whistle and they jump back into their buckets, and I take em home.” “That’s a bunch of hooey! Fish can’t do that!” The man looked at the game warden for a moment, and then said, “Here, I’ll show you. It really works.” “O.K. I’ve GOT to see this!” the game warden replied. The man poured the fish in to the water and stood and waited. After several minutes, the game warden turned to the man and said, “Well?” “Well, what?” the man asked. “When are you going to call them back?” the game warden prompted. “Call who back?” the man asked. “The FISH.” “What fish?” the man asked.
As we saw with tree rings, there may be a drop in Alkenone production with increasing temperature, as well as with lowered temperature. Once the living organisms are out of there “linear” response zone their behaviour can be chaotic. In reading up on Alkenone production, it seems to be dependent on many variables such as water depth, latitude,
distance from the coast, sunlight, nutrient levels, etc. The sediments can also undergo mixing so that there is not a perfect stratification of the sediments. It is entirely possible that the SST could increase for a considerable time, and the sediment signal may not track that if it is in saturation. My take is that, at least in this class of proxies, you are hoping to see very broad response to the climate over large periods of time, and that the tool is being mis-used to measure any rapid changes taking place in a few years to a decade timescale. The core end date redating also seems to be the most puzzling thing I have seen. You have experts such as Fuchs and Mix and others who should be the experts in dating giving well thought out dates, only to have thousands of the end dates re-done.
I think that guy is so far out to lunch, it is best to ignore him as he is not likely to listen to reason.
I could not open the comments on the few comments at the end, so cannot tell what happened to the people who disagreed.
macumazen has his ducks in a row.
Thanks for the background on this old joke. Sadly there does not appear to be any background on the jokes Nick Stokes is telling.
Jim Bouldin Says:
March 25, 2013 at 15:44
It is **not possible** to confidently state anything about long term climatic trend estimates, either their central tendency or their confidence limits, using tree ring size, with the existing set of available methods and data. This **invalidates** essentially all large scale reconstructions. Yes all of them, they are not trustworthy. It’s serious, very very serious. And until people start to actually take it seriously, I’m going to keep ramping up the publicity on it.
And on top of that…even if someone would try to wiggle around that issue, they are immediately confronted with the very serious set of issues presented by non-linear biological responses generally, and described most clearly w.r.t. tree rings and climate by Loehle (2009).
John:
You should add a link to Bouldin’s piece. The entire string of exchanges is a beautiful thing to read. He takes no prisoners among the pot bangers.
Here is a treemometer study that finds … GASP … the Little Ice Age.
http://www.google.com/url?sa=t&rct=j&q=measure%20temperature%20using%20isotopes%20in%20trees&source=web&cd=1&ved=0CC8QFjAA&url=http%3A%2F%2Fwww.pnas.org%2Fcontent%2F71%2F6%2F2482.full.pdf&ei=hv1UUcKqKoW4qgGU_4DgDg&usg=AFQjCNGa2y_0hiB3l4_VskysQQ1Q0ZUrvA&bvm=bv.44442042,d.aWM
Michale Mann has just tweeted that a “Response by Marcott et al.” is up at RealClimate
http://www.realclimate.org/index.php/archives/2013/03/response-by-marcott-et-al/
Response by Marcott et al. is up at RealClimate.
Revkin also has a post.
Their FAQ does not seem to provide any real answers to the hard questions.
No acknowledgment of how misleading their graph and dating are for recent temperatures, just repeating the ‘not robust’ statement.
[sorry for initially commenting on the wrong thread; feel free to move]
The FAQ is up…
“Marcott et al Response”
http://www.realclimate.org/index.php/archives/2013/03/response-by-marcott-et-al/
9 Trackbacks
[…] […]
[…] the “Marcott curve” which puts more of the circus in jeopardy. In addition to a new post on CA detailing changes in the core top record, there is this very significant comment on a prior thread which deserves some serious […]
[…] It’s a Baron von Richthofen flying circus of mish-mashed paleoproxy data (with creatively re-engineered core top dates), Hadley ‘adjusted’ instrumental data and climate model output for the next 90 years. […]
[…] https://climateaudit.org/2013/03/19/bent-their-core-tops-in/#more-17592 […]
[…] and Marcott radiocarbon dates." You're saying I made that up? Why then does it appear on this page in Steve McIntyre's blog? Originally Posted by Windigo Yes you did. You made a bad calculation that had the […]
[…] another paper came out with even dodgier mathematical shenanigans. The ‘scientists’ moved data around by 100′s of years, so measurements taken […]
[…] did not discuss or explain why they deleted modern values from the Md01-2421 splice at CA here and here. Or the deletion of modern values from OCE326-GGC300 as asked […]
[…] not discuss or explain why they deleted modern values from the Md01-2421 splice at CA here and here. Or the deletion of modern values from OCE326-GGC300 as […]
[…] or explain why they deleted modern values from the Md01-2421 splice at CA here and here. Or the deletion of modern values from OCE326-GGC300 as […]