Marcott et al 2013 has received lots of publicity, mainly because of its supposed vindication of the Stick. A number of commenters have observed that they are unable to figure out how Marcott got the Stick portion of his graph from his data set. Add me to that group.
The uptick occurs in the final plot-point of his graphic (1940) and is a singleton. I wrote to Marcott asking him for further details of how he actually obtained the uptick, noting that the enormous 1920-to-1940 uptick is not characteristic of the underlying data. Marcott’s response was unhelpful: instead of explaining how he got the result, Marcott stated that they had “clearly” stated that the 1890-on portion of their reconstruction was “not robust”. I agree that the 20th century portion of their reconstruction is “not robust”, but do not feel that merely describing the recent portion as “not robust” does full justice to the issues. Nor does it provide an explanation.
The uptick problems are even more pronounced in the zonal temperature reconstructions (NH and SH extratropics on which I will be posting) and in the reconstructions from individual proxies (alkenone, Mg/Ca). In today’s post, I’ll illustrate the uptick problem from the alkenone temperature stack on the premise that there are fewer moving parts in the alkenone reconstruction and therefore this will facilitate diagnosis of the uptick mystery.
The first figure below shows the Marcott alkenone reconstruction. Alkenones are the largest single class of Marcott proxies (31 of 73). According to the alkenone reconstruction, temperatures in 1920 were at their lowest value in 11,300 years (Marcott’s selection of 11,300 years begs the question of what happened just before the left frame of the graphic – an interesting issue that I’ll return to on another occasion.)
Between 1920 and 1940, Marcott’s alkenone reconstruction increased by a remarkable 1.4 deg C, returning to values of the start of the reconstruction as shown. Marcott’s 1940 value (0.39 deg C reference 1961-90) was considerably above the 1961-90 reference zero and higher than the 1990-2010 average, shown as red “+” for reference. Interesting as this figure may be, I don’t wish to dwell at present on what it might or might not show about temperature history (a topic that I’ll return to on another day.)
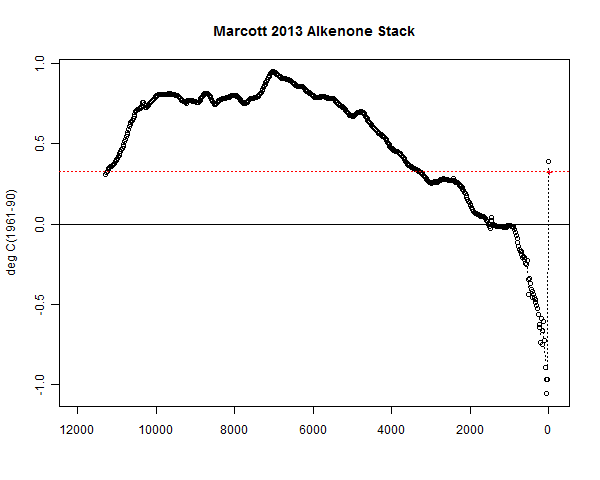
Figure 1. Marcott 2013 Alkenone reconstruction. (From SI spreadsheet sheet 2). Red “+” point denotes 1990-2010 average HadCRU temperature. Dotted line is at final value for reference.
Today’s post is merely about the mysterious uptick from 1920 to 1940, an uptick that is not observed in any of the actual alkenone data.
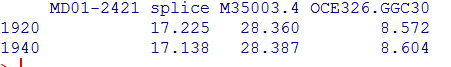
Despite the recent popularity of alkenone series over the Holocene, there are vanishingly few high-resolution alkenone series over the last two millenia for comparison. I keep my eye out for such series and their absence is very frustrating. Only one of Marcott’s 31 alkenone series (MD01-2421; KR02-06 St.A GC; KR02-06 St.A MC’s 31 series) has a published date after 1950. Two others have published end dates of “0 BP”. This conventional date can be problematic, but again this is a story for another day. There is negligible change in any of three series: overall, there is an average decrease of one-hundredth of a degree, with none of the individual series changing as much as a tenth. In alkenone series with published values in both 1920 and 1940, nothing happens to yield Marcott’s 1.4 deg C uptick.
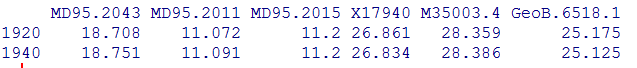
Marcott (in my opinion, unwisely) re-dated the modern portion of many cores, including numerous alkenone series. (I will write a separate post on this small and unwise adventure.) I don’t believe that this re-dating is at the root of today’s mystery (but neither can I completely exclude it.) As re-dated by Marcott, there are now five cores with alkenone measurements in both 1920 and 1940, again with negligible change between periods. On average, there is a decline of 0.002 deg C. (Interestingly, only one core is in common between the two cases.)
In small samples with inconsistent proxies, the dropping out of a highly negative or highly positive proxy can produce seeming changes to a mean. To consider this possibility, here are the values for proxies (after mid-Holocene centering) with “Marcott” values in either 1920 or 1940. Marcott redated the MD01-2421 series (which is strongly negative in the 20th century); after redating, it drops out between 1920 and 1940, thereby producing an increase in the mean of available proxies. Whereas the average of the five proxies with values in both periods has no change, the average of available values for the seven proxies shown below increases by 0.36 deg C – a (spurious) increase that is still far short of Marcott’s 1.4 deg C.

I don’t believe that the baffling uptick has anything to do with splicing of instrumental or Mannian series, as speculated elsewhere. (One of the reasons for working on the alkenone version was to minimize this moving part.) However, I am at present totally baffled. I’m disappointed that Marcott refused to explain the phenomenon when asked politely. It is clear that the uptick is, at a minimum, “not robust”. My own surmise is that the situation is worse than that: that the uptick in the alkenone (and other reconstructions) is an artifact, but of what I don’t know.
As alluded to in this post, many other things about this article concern me. I’ll try to cover them in future posts.


106 Comments
Marcott’s response is most troubling. I sincerely wish that some researchers could appreciate the value of clearly explaining their work. The fact that Marcott does not continues a long line of misguided hubris. When will the often documented “correction signal” register with climate “scientists”?
What’s most troubling is that one of the primary findings is “not robust”, but the paper was published in Science.
Good start. That was rapid-response stonewall by Marcott. My recollection is that once upon a time they started off pretending to be helpful.
Has he turned it upside-down?
Isn’t “Just before the left frame of the graphic” the Younger Dryus event? I wounder what the construction would make of that?
I hope its not something as silly as ‘missing’ data with zero values for both Time and Temperature!
Ah, thank you kind sir in getting back to the salient issues
Picking my jaw up from the floor…. a new technique in CliSci-TM stonewalling?? All you need say is that a crucial aspect of your study is “not robust” and there is no longer any obligation to explain or justify it?? Even while the media disseminators are wildly declaiming about the “not robust” data…. we’ve already been told repeatedly that this is the most important hockey stick graph ever and that indeed “it’s worse than we thought”….
Here was my inquiry:
Here is his response:
As I noted in my post, his assertion that the recent portion of the reconstructions (the stick) weren’t robust, while an interesting statement in light of much recent commentary, but is unresponsive to my request for clarification.
Nor, despite marcott’s claims, does the article actually say anywhere that the recent portion of the reconstruction is not robust, let alone “clearly” say it. In the paragraph that Marcott referred to, he says that he got different results with and without infilling, but instead of saying that the reconstruction is not robust, said that the “difference [between reconstructions] is not robust” – which detracted from a “clear” statement. Of the various possible versions of the post-1890 period, Marcott picked the most aggressive for his illustration.
I will comment on the SHX and NHX reconstructions
This is very odd considering the “scientific” explanation Shakun gave about this part of the paper to Revkin,
“…when you tack on where we are headed in the 21st century …and BOOM! we’re just outside the [reaching really high], outside the elevator you know, its up and out [reaching high again] so I think that is the kind of interesting perspective you get …a super hockey stick” – Postdoc Shakun
http://dotearth.blogs.nytimes.com/2013/03/07/scientists-find-an-abrupt-warm-jog-after-a-very-long-cooling/
Steve: comparing projected temperatures to Holocene Optimum estimates is a reasonable enterprise though not easy to do. This effort isn’t helped much when the 20th century results are “not robust” (or worse)
I agree with populartechnology, especially when you consider the 400 year binning. A 1°C increase smeared over 400 years becomes nothing more than a bump. A 4°C plus increase a?v?e?r?a?g?e?d over 400 years starts to look a lot like a 0.8°C blade.
Sure, “comparing projected temperatures to Holocene Optimum estimates is a reasonable”, but including it in your reconstructon without saying you did so is like legally not telling the truth on purpose.
BTW, someone else noted that the 8.2 ka event has vanished in the Hydra13 reconstruction.
And, cutting off the recovery from the Younger Dryas hides the incline which would not be conducive to their story line.
Where’s the code? It is quite difficult (to me) to figure out how the uncertainties were calculated. RegEM uncertainty shows some ‘non-robustness’ :
something that is not in the RegEM 5×5:
so in this case it seems that 5×5 grid weighting robustifies the reconstruction.
Steve: UC, as always, it is a pleasure reading your comments. I wonder if the Marcott-Shakun uncertainty calculation will be as enduring a mystery as MBH99 confidence intervals.
Well at least he’s a Client Scientist and can only ruin the world economy, god forbid he should get a job in automotive QA and be responsible for the critical components in the vehicle you drive…. “Don’t worry about the brakes, if anything happens the control chart wasn’t robust”
I’m amazed that you can wade through this stuff and not be rude about it…..
Fred Singer posited that the article was likely derived from Marcott’s PhD thesis (http://www.americanthinker.com/2013/03/another_hockey_stick.html). This supposition is borne out by the abstract to his thesis (see: MARCOTT, Shaun A., PhD, Late Pleistocene and Holocene Glacier and Climate Change, (Major Professor: Peter Clark, Committee members: Edward Brook, Steven Hostetler, Joseph Stoner, 259 pages, 3 appendices, 58 figures, 10 tables) at: http://ceoas.oregonstate.edu/research/graduate/geology/).
In the chapter itself, it suggests that the article was originally intended to be submitted to Nature.
The conclusions about recent warming are far more circumspect (though it will be necessary to determine how much further research/analysis was conducted to arrive at the current conclusions and breathless press releases). From the abstract to the relevant chapter in the thesis:
“The resolution of our reconstruction limits our ability to determine if the recent warming of the past few decades has reached maximum interglacial values; however, from model-based projections of 21st-century climate we infer that the mean global temperature will rise well above the warmest levels of the current interglaciation by 2100.”
The thesis may also provide clearer understanding of the methodologies involved.
Have fun!
Cheers,
Ian.
Re: Ian (Mar 14 13:09),
holy cow … look at Figure 4.2 (p. 46 in the thesis) … it is “remarkably similar” (TM, climate science) to the Figure 1 (a..d) of the paper … except the mystery uptick is completely missing! The same thing with Figure C8 (p. 204) and Figure S3 (SI, p. 10)! This is getting truly weird…
Also see the proxies on pp. 200-203. Anyone with a half of an eye could see that there is some kind of end problem. Now comparing the endings in the figures C8 and S3 suggests to me that somehow most of those weird endings of the individual proxies are pointing upwards in the new reconstruction … maybe they added some type of correlation (to instrumental) sign matching step?
Jean S, I’ve got an idea on the weird upticks. I did a run from scratch using non-redated proxies in which I got a closing NH uptick almost exactly matching the last value of their NHX reconstruction. The value arose from a singleton value of Lake 850 after being re-centered twice. (Lake 850 was the only proxy with values in the step.) Ironically, Lake 850 had a negative value relative to the Holocene centering interval, but it was less negative than the proxies dropping out. In the experiment, the result was for Lake 850 in 1980 step, but Marcott-Shakun redated most 20th century proxies.
My present guess is that the closing upticks will result from singleton or near-singleton values. More on this to come.
Jean S:
Someone should take a look at Shakun’s OSU thesis as well since it covers ostensibly the same set of proxies – in fact more.
Jean S: That’s exactly the thesis I’m talking about above. It seems to have the same set of proxies and the same “Monte Carlo procedure”. On the surface (I haven’t read it carefully yet) it seems to me that the only difference is the last part of the procedure (in the thesis it seems to be the simple average).
Jean S (15/3): I’m sorry I misread you (Skakun, Shaun). Anyhow, I quickly checked Shakun’s thesis also, but it seems not to be helpful here. It appears to me that the Shakun et al Nature paper is more helpful. It appears that the possible methodological changes between Marcott’s thesis version and the actual Science paper were implemented in Shakun et al.
I’m wondering if it’s significant that in the thesis version of the article, when the authors wanted to align their temperature anomaly zero (original baseline 5500-4500 BP) to modern times (1961-1990), they did not use the most recent values of their reconstruction. This suggests that they did not consider their reconstructed temperatures after 490 BP to be robust. The caption to figure 4.2 in the thesis reads (in part), “Mean temperature values for the globally stacked temperature records have been mean shifted by +0.3°C to match Mann et al. (2008) for a common period of overlap (490-1450 yr BP).”
The data reported in the Marcott SI for Lake Njulla also does not seem to correspond with Laroque’s data as reported here – ftp://ftp.ncdc.noaa.gov/pub/data/paleo/insecta/chironomidae/europe/sweden/abisko2004.txt
The data for Lake 850 is identical.
Lake 850 and Lake Njulla are within a few minutes Longitude from each other in N. Sweden.
HaroldW,
The paper does something very similar:
“To compare our Standard5×5 reconstruction with modern climatology, we aligned the stack’s mean for the interval 510 to 1450 yr B.P. (where yr B.P. is years before 1950 CE) with the same interval’s mean of the global Climate Research Unit error-in-variables (CRU-EIV) composite temperature record (2), which is, in turn, referenced to the 1961–1990 CE instrumental mean (Fig. 1A).”
Wow. JeanS nails it again. Read chapter 4 of Marcott’s thesis.
Thanks Nick, I missed that bit. Any idea why Marcott wouldn’t have chosen to use the entire period of overlap?
HaroldW,
I presume they are trying to maximize data overlap. After 1450 Mann’s numbers decrease, and before 510 (thinking backwards) some Marcott proxies would not have data.
Nick,
“After 1450 [BP] Mann’s numbers decrease, and before 510 (thinking backwards) some Marcott proxies would not have data.”
Yes, that’s just what I was thinking. The early end of the overlap period is 1450 BP (=500 AD) due to Mann; Figure 2C shows a falloff in RE earlier than that (due to reduction of proxies, IIRC). On the recent end, it can’t be Mann’s reconstruction, which runs to 100 BP with plenty of proxies, so it would seem to be due to some perceived limitation of the Marcott reconstruction later than 510 BP [or 490 BP in the thesis]. Figure 4.3g of the thesis version shows an unexplained dotted line at #proxies=40, which is crossed around 500 BP. Perhaps they should have drawn the reconstruction with a dashed line after that. To me, that’s just another reason to ignore the uptick, which seems to be “not robust” for other reasons.
A more important point in the paper is the difference between the early optimum and recent temperatures. So far I haven’t seen criticism of this point.
If the data from 1890 on are not robust, how can they make any claims about 20th century temperatures??
Am I wrong to be gobsmacked by Marcott’s response? I thought it was bad enough when he was quoted as saying that the rate of current warming is unprecedented. He knows that the “handle” of his hockey stick doesn’t have the temporal resolution necessary to know what earlier warming rates were. Now he says that the “blade” isn’t robust? Did he at least get his name right?
By coincidence, Science Editor-in-Chief Bruce Alberts was in Washington recently testifying before a House Committee on the importance Science places on authors sharing all their data, being highly suspicious of their own results, and releasing data and/or code as necessary to permit others replicate their results.
Since it’s a House Committee (rather than Senate) there’s a Republican chair. As in, who gets to issue follow-up questions to witnesses. Just sayin’.
Steve: good spotting. It looks like Science’s policy will get tested if Marcott fails to clarify the matter.
Re: Ross McKitrick (Mar 13 21:25),
These 3 may bear some follow-up from the Commitee or from any interested (online) bystanders who can pose the right questions (they all seem to have strong interest in issues of research transparency and replicability):
Victoria is a heroine in open data and code.
Mosher, why no cheerleading of Marcott et al. here like at WUWT?
“Personally, I’m with Robert [Rhodes BEST] on this ( as we discussed it earlier this week ) Its broadly consistent with other work and they had an interesting approach to handling the loss of high frequency signals with proxies that have resolutions varying between 20 and 500 years.”
Huh.
you have weird idea of cheerleading.
Their approach to handling the loss of high frequency is interesting. Note what that says and what it doesnt say.
And the result is broadly consistent with other work.
Note what that says and what that doesnt say.
of course you read it as cheerleading. That shows how you resolve ambiguity.
here is what cheerleading from me would look like:
“Their work confirms what we already know. Their method of handling loss of high frequency resolves all the issues.”
Oh, my apologies, I was clearly mistaken as there is obviously nothing to the tone of your comments at WUWT,
“They just concluded that as much as 20-30% of the holocene may have been warmer than today and every savant here attacks a study they didnt read.” – Mosher, WUWT
And how does an attack on people who didnt read the study become cheerleading again?
I’ve instructed you in what cheerleading looks like. WRT my 20-30% comment.. Opps you stepped on it there as well.
Lets see: Who wrote this days later after my observation….
“So why did the editors of Science give the OSU paper the ‘special’ treatment, sending out press releases, arranging interviews, etc? Perhaps they were captured by the authors’ claim “that the planet today is warmer than it has been during 70 to 80 percent of the time over the past 11,300 years. But as British climate expert David Whitehouse points out: “Of course, another way to put this is that current temperatures are colder than 28% of the Holocene. According to this research, the temperatures seen in the 20th century were about average for the Holocene.”
Funny, When I point out this aspect, I’m a cheerleader? Huh. Singer makes the same point as I did using Whitehouse.
Go attack them savant.
Interesting McIntyre deleted my last comment…
Steve: I discourage food fights.
Astonishing work in such a short period of time. It is hard to credit that all the authors are really willing to sign on to this once they see that the data does not bear their bold assertions. Does it make sense to send to send this analysis directly to all three and directly ask for comments? Again you may meet with exactly the same lack of helpfulness but we will know that they are going to “hang together”.
Were I King for a Day, I’d ban all further use of “robust” except in the context of red wines and red spaghetti sauces.
I thought “robust” should only be used in reference to bodily odors….
Here’s a brief three minutes on alkenones
Note the sparseness of data involved
We have fats now as fossils, no “algae bones”
And new puzzles yet to be solved
Did they change with time over centuries?
From this distance, it’s quite hard to tell
But folks measure to small fractions of degrees
In the hopes that they’ll add to the “sell”
===|==============/ Keith DeHavelle
Thanks, Keith — the video is a very informative introduction for people like me who had never heard of this proxy before.
agree with Hu,
thanks for the ref Keith, but the music did my head in :-0 (still learned something tho)
Some unsaturated ketones readily undergo addition-elimination reactions with nucleophiles such as thiols and amines to regenerate the starting materials or compounds where the double bond isomerizes or shifts position along the chain. In the cell these processes are likely enzyme controlled, but I wouldn’t be surprised to see these compounds as substrates for biochemical processes external to the organism that produced them (as well as being sensitive to sunlight, oxygen, pH and temperature. I certainly wouldn’t describe them as robust molecules. There are a lot of unanswered questions about sample handling and their use as temperature proxies, in my opinion.
There is a wealth of literature about alkenones as paleotemperature proxies (see http://www.ldeo.columbia.edu/~peter/Resources/Seminar/readings/Herbert_AlkReview_Treatise'01.pdf) that demonstrates the veracity of the method. The characteristics of these alkenone structures (Primarily C37 and C38 molecules with E configured unsaturation at 7 carbon spacing) do not exhibit the chemical behavior you describe and they have been reported in sediments as old as early Aptian (120 Ma), which surely qualifies them as robust.
Informative enough video, though I agree with DFhunter, the music WAS rather painful.
Dr. D’Andrea also doesn’t seemed to have learned from some of his colleagues that conflating the term “proxy” into “thermometer” can rile some viewers. Dr. D’Andrea uses the word “thermometer” in place of ‘proxy’ four times in the video and three times on his “Ice Stories” page, he uses the word ‘proxy’ zero times and “reconstruct” only once. I won’t call it disingenuous, but I will say its annoying.
The video’s a bit old 2008, so presumably he’s gotten further in calibrating his critters since, but here is a comment from Billy D’Andrea on July 31st, 2008 that adds some context to the video:
1. We’d like to calibrate against algae cultures grown at different temperatures. That is why this field season was aimed at capturing the algae fom [sic] the lakes and keeping them alive. We’ll grow them at different temperatures and measure the degree of alkenone saturation they produce at different temps.
In the meantime, I’ve calibrated the degree of saturation to temperature using the thermocline of the lake. Since the water temperature gets colder with depth in these lakes, we filtered alkenones from different depths and measured the water temperature and alkenone saturation at these depths.
2. Only a handful of organisms on the planet make alkenones, and they are all members of the class of algae called Haptophyta.
3. People assumed they were cell wall compounds for a long time – and they are found there – but recent work has shown alkenones to be present all throughout the cell.
4. We evaluate the degree of saturation with a flame ionozation [sic] detector (FID) after the gas chromatograph. An FID is much more quantitative than a mass spectrometer for measuring absolute concentrations.
Seems to me we need to know an awful lot more about these creatures before we start packaging them as thermometers. D’Andrea is just down the street from me, maybe I will pay him a visit.
W^3
“We are heading for somewhere that is far off from anything we have seen in the past 10,000 years – it’s through the roof. In my mind, we are heading for a different planet to the one that we have been used to,” said Jeremy Shakun of Harvard University, a co-author of the study.
http://www.independent.co.uk/environment/climate-change/the-world-is-hottest-it-has-been-since-the-end-of-the-ice-age–and-the-temperatures-still-rising-8525089.html
Marcott admitted he was apprehensive about charging into the fully-mobilized troll army, but said he was grateful scientists like Mann had “gone through hell” before him to build a support network for harassed climate scientists….
Mann himself, who literally wrote the book on attacks on climate scientists, said in an email to Climate Desk that he was “certain that professional climate change deniers will attack the study and the authors, in an effort to discredit this important work,” especially given the close ties between the two scientists’ research.
http://www.theatlantic.com/technology/archive/2013/03/were-screwed-11-000-years-worth-of-climate-data-prove-it/273870/
Does the lack of “Robustness” warrant the word “Unprecedented?” I could live with “Possible,” but apparently Mr. Revkin couldn’t!
So if Science has strengthened its rules regarding access to the code, would now be a good time to test that by asking Dr. Marcott for the code? Might clear up the “Mystery” faster than reverse engineering…
This is a fun proxy type, an armchair explanation of which is that cold-blooded animals and smaller critters suffer overly stiff cell membranes in cold water so they add more double bonds to their long-chain fatty acid membrane units to reduce crystallinity simply by being a different shape than usual. Cholesterol acts in this arena too as a literal reinforcement beam.
Re: NikFromNYC (Mar 14 00:50),
Apparently you can find the same effect in reindeers’ legs: “There was a similar gradient in composition of [unsaturated] triacylglycerol fatty acids in the fatty bone marrow from shoulder or hip to hooves, making it clear that the hooves are normally … much cooler” The Fats of Life, Pond, 1998, p92
The authors “infill” missing data using a computer algorithm and state that without the infill “data”, there would be 0.6C less warming “over the past ~60 years before the present (1890-1950),” the effect of which would be to completely disappear their hockey stick blade.
http://hockeyschtick.blogspot.com/2013/03/author-admits-blade-of-new-hockey-stick.html
Steve: infilling is one issue but you’ve got it backwards. With infilled data, the blade is eliminated. there’s something to complain about here, but it’s not as simple as you claim.
I thought that the meaning of ‘robust’ is ‘insensitive to departures from theoretical assumptions’, applying at some statistical procedure. In his response letter the author uses ‘not robust’ as applying at a result. A result is not a procedure. This gives me the impression of cargo cult wording for ‘due to observational/sampling/procedural/soft-ware error’. Steve, I wish you a lot of success but sooner than later the whole study should be replicated and published.
Steve: paleoclimate has developed a sort-of pidgin version of statistical language. Their use of “robust” is an example.
Steve,
From going through the actual underlying data I noted that basically there are only two time series that show an early 20th century upswing: LAW DOME C (Antarctic) and Agassiz-Renland (Canadian Arctic). See also figure 2 J & K, where the 30-90 N/S stacks show a similar fast rise in temperature close to 0 BP. Both also are one of the few to – apparently – provide information at a time step of 20 years. This appears relevant, as the supplementary information (figure S10) shows that only the reconstruction with a 20 year time step has this upswing, not in the 100 and 200 year time step reconstruction.
Steve: Yup. But neither ought to be contributing to the alkenone reconstruction. I’ve spent lots of time in the past on both Agassiz and Law Dome and will comment on each separately.
Re: Jos (Mar 14 02:49),
Jos
The EPICA DOME C data ends at BP+38 – or 1912. It does show a sharp rise, but that was from 1877 to 1886, increasing 3.46 deg C (2.69 deg C 1886-1895 alone). It then fell nearly as sharply from 1895 to 1912, dropping 2.16 deg C.
The “hockey stick” in the Marcott graph appears to begin at approx. 1900, with temps shown as falling the prior approx. 100 years.
During the period 1895 to the last reading in 1912 for DOME C – which is the period of DOME C that would fall within the “blade” – the temp at DOME C dropped 2.16 deg C.
By all appearances that decline would more than offset the Agassiz-Renland increase, 1.54 deg C from 1880 to 1940, which the authors admit was the primary cause of the blade.
Something is still quite fishy it would seem.
Additionally I would note the DOME C data is highly irregular. I copied last couple hundred years below and you can see large excursions in short time frames – both up and down. Which would seem to make it largely useless for any type short term assumptions?
http://wattsupwiththat.files.wordpress.com/2013/03/marcott-a-10001.jpg?w=640&h=430
EPICA DOME C
Publish age — Actual —– Published Temperature
(yr BP) ———– Year ——- (deg C)
38 ————— 1912 ———- 0.8800
47 ————— 1903 ———- 1.8400
55 ————— 1895 ———- 3.0400
64 ————— 1886 ———- 0.3500
73 ————— 1877 ———- -0.4200
82 ————— 1868 ———- 0.0500
91 ————— 1859 ———- 0.0500
100 ————- 1850 ———- -0.5200
110 ————- 1840 ———- 0.7900
119 ————- 1831 ———- -0.5500
129 ————- 1821 ———- -1.1100
140 ————- 1810 ———- 0.3800
150 ————- 1800 ———- -0.4000
161 ————- 1789 ———- 1.0500
171 ————- 1779 ———- 0.2800
181 ————- 1769 ———- -0.7200
191 ————- 1759 ———- -1.2300
202 ————- 1748 ———- 0.5100
212 ————- 1738 ———- -2.4400
Check Fig S10d. That’s just Antarctic, and qualitatively seems to follow that behaviour, though on a diminished scale.
Nick,
I know the commentators at CA like to poke fun at you, but you are obviously a smart guy and I always think it is valuable to hear the other perspective. I am genuinely curious – how do you think Marcott was able to achieve the uptick? Do you think the authors should have better disclosed their methodology and that they could have been more responsive in their reply to Steve’s email?
nevilb,
I don’t know. I originally thought it must have incorporated the Mann 2008 composite, but now I don’t. I suspect that as Marcott seems to be saying, that it comes from big fluctuations in a few proxies with data in the period.
The “non-robust” spike probably would have been better not shown, because it distracts from the logic of this kind of analysis. Paleo is paleo, and we find out about it as best we can by proxies. Recent is much better covered by thermometers, and proxy data (especially from the few recent proxies) is too uncertain to add information to that.
I think their Fig 3 (it’s not in the SI) makes this logic clearer. They show instrumental data from 1900-1909 and 2000-2009 against the distribution of proxy data. The difference is considerable on that scale. Then they show how modelled projections go way beyond this range.
“I don’t know. I originally thought it must have incorporated the Mann 2008 composite, but now I don’t. I suspect that as Marcott seems to be saying, that it comes from big fluctuations in a few proxies with data in the period.”
That was my impression as well and the impression of some other folks knowledgeable in the field who I consulted, so you’re not alone in that. FWIW
Steve: Marcott did not “say” this in the article, but sort-of admitted it when confronted with a question in my email. Nor is this exactly right. There are no big fluctuations in the relevant proxies. The reason for the uptick is a little different.
For the life of me, I cannot see how anyone reached that conclusion.
Brandon,
I cannot see how anyone reached that conclusion using just the paleo data referenced in the paper.
“not robust” short for I knew that to please the IPCC do get this into AR5and to get ‘the Team ‘ on board what this ‘research’ needed to show ‘the stick ‘, and so that is what I did .
Well with ‘cleverly ‘ use of data you can just about prove anything .
I am vaguely reminded of a controversy in the field of education dating back to 1968. Rosenthal and Jacobson identified the “Pygmalion Effect”. In their study, teachers were given false data on individual students’ prior attainment. They found in particular that (previously) weaker students performed better (on tests of IQ) if the teacher had higher expectations (i.e. deliberately heightened expectations) during the teaching period. The study was flawed in many ways, as detailed by Elashoff and Snow (1970); but, presumably because it showed what everyone wanted to believe about children’s potential, “Pygmalion in the Classroom” continued to be cited as an authority – and still is. Elashoff and Snow used a scattergun approach, pointing out many flaws, but the one which I always thought was the clincher is this: the only group of students whose performance increased on the standardised test were students for whom there were no norms on the test. I just googled “Pymalion Effect” and I see (according to Wikipedia) that it is alive and kicking. When there is a great moral crusade, any outlier will do.
In construction if a structure is not robust then it is likely to fail?
“… the reconstruction over the past 60 yrs before present (the years 1890 − 1950 CE) is probably not robust …”
We are not even sure it is not robust, only probably!
It matters not a jot that the 1920-to-1940 uptick is “not robust”, or an artifact.
The paper has achieved its primary purposes- Headline news and to raise the “Hockey Stick” from the grave just in time for AR5.
The duplicity of these guys is beyond belief.
You got it in one , its actual scientific validity is not the important point , that is its political usefulness to ‘the cause ‘
We have been here many times before the original ‘scare ‘ gets big coverage but the following taking to bits of its claims and so the death of the ‘scare ‘, gets little or nothing .
There are all kinds of things wrong with this paper. Besides the fact that “calibration” prior to averaging doesn’t help variance loss issues, how do you get a high frequency spike at the end of a reconstruction comprised entirely of very low frequency series? Why weren’t the authors concerned about that?
It’s a total mystery. 🙂
Jeff, I agree that they should have been concerned about the closing spike. If the spike had had gone the other way, we know that the authors and reviewers would have been on it like a dog on a bone.
Some portion of the spike (as I mentioned) is an artifact of high-negative series dropping out and no allowance being made for this in the Grid5x5 series. But there’s something else that’s bizarre and could be almost anything.
In Briffa’s original Tornetrask reconstruction, he had a singleton spike in the closing value of his reconstruction which was regression using density from the year and the next year. Instead of showing NA for the final reconstruction year, he inadvertently used cycled the data, using the value from the first year of core nearly 2000 years earlier. The 1940 alkenone reconstruction is very close to the opening alkenone reconstruction value in the early Holocene. Checking their code for inadvertent cycling is something that i’d check if I get access to it. Not saying that this is an explanation. I have no idea right now. Could be almost anything. Could be something obvious that I’m overlooking, as well.
Hmm, 2000 years ago is worse than we thought.
Re: Steve McIntyre (Mar 14 09:07),
A bizarre thing is the way they “perturbed” (SI, l. 81–82) most of their Mg/Ca -proxies: as far as I understand their procedure it seems that they added Gaussian (symmetric) noise to both coefficients (A and B) in the exponential model (SI, l. 47). That should have an effect of increasing the temperature value on average. It does not explain the mystery, but it may well explain why the Mg/Ca-“stack” has an even more profound blade than the Alkenone “stack”. I have a gut feeling that the key to the mystery lies in the (implementatioon of) step 3 of their “Monte Carlo procedure” (SI, l. 85–88).
Jean is absolutely right. The Mg/Ca eqn is exponential in the temperature calibration:
MgCaRatio = (B±b)*exp((A±a)*T). You don’t assume a normal distribution for the exponent parameter, you would need to test for this. Yikes! But also, this means that since you actually measure the Mg/Ca ratio, your estimate of temperature is
T=Log[MgCaRatio/A]/B
So in 2 places you are adding random noise to a parameter that you divide by, in one case inside the Log expression. Simulation shows that this will lead to inflated T (temperature) values on average when you do Monte Carlo sampling.
The problem goes deeper than just that. The process does not take into account the random error term in the equation when it is generating the new “random observations” since all of these will be exactly on the perturbed regression curve. This understates the variability of the actual observations which in turn would result in an underestimate of the error bounds on the reconstruction.
Did you notice the statement:
±30% of an anomaly? How much is 30% of 0?
Re: Jean S (Mar 14 10:44),
I can’t assess this except to say that when Jean S and Craig L agree something is important then that is an excellent sign that there is smoke and then something more…. good spot for auditors to keep probing!
RomanM:
“would result in an underestimate of the error bounds on the reconstruction”
They have invented something new instead of using well-known statistical calibration methods? And the result is underestimation of error bounds? Tonight on ‘It’s the Mind’, we examine the phenomenon of deja vu.
Why weren’t the reviewers?
snip – this type of piling on over-editorializing is against blog policy.
I wonder if Mann was the main reviewer. The infilling with Mann09 could well have been his idea. It’s not something that most folk would even consider.
Infilling an uptick at the end of a downturning dataset is an unscientific assumption-led conclusion and in the hard sciences this would not get through the peer review process, you’d hope.
Steve: there’s no evidence that they infilled with Mann09. I, for one, don’t believe that they did (though I don’t know what they did). At this site, please do not present things that are merely unfounded speculations as facts.
Mervyn, they probably had advice from Mr Mann.
Just in case others are puzzled about exactly which stack Steve is plotting, it’s column AJ of the Temperature Stacks, labelled standard Uk’37. Matlab code:
ds=xlsread(‘Marcott.SM.database.S1.xlsx’,3);
plot(ds(:,27),ds(:,34),’o’ )
set(gca,’XDir’,’reverse’);
Steve,
Please accept my most sincere thanks for taking on this Sisyphusian(*) task. Imagine if you will, some fifteen years ago after the MBH’s first started making the rounds, people all over the world sitting in the dark waiting for someone to start asking their questions. Someone with enough vision, stamina and a voice of authority to see through the hand waving, to break through the stone walling. There were years of sitting in the dark until you came along. You have brought sunshine back to this particular part of the world. Shine On You Crazy Diamond (since everyone else seems to be doing it)
(*) Though I’m now thinking more along the lines of the stygian stables… stygian darkness… what had to be cleaned up…
Sisyphean task… Augean stables… Swcharzneggerian taking out of trash….
Thomaswfuller the 2nd,
LOL
I find my memory is a less than satisfactory proxy for Greek mythology (and other topics).
But a quick (almost instantaneous) review of the interweb lead me to believe my results were robust.
Side note: as shown in A. Scott’s comment (Mar 14, 2013 at 5:05 AM), the earth sciences’ convention for “BP” — “before present” — is to consider “the present” to be 1950 (Wikipedia cite).
Do you know the sources of these alkenone series? Do they represent SSTs or inland seas?
They are also plotted in the SI.
Re Detecting Outliers vis Figure 1. Marcott 2013 Alkenone reconstruction.
Considering Marcott’s 2013 reconstruction appears to cover the major portion of the warm part of the current interglacial period, a simple model would be the positive portion near the peak of a sinusoid.
By eyeball, the standard deviation from such a sinusoid may be of the order of 0.2 deg. The last point of Marcott’s Alkenone Stack appears to be about 1.4 deg above the previous one. i.e. about six to seven standard deviations. Are there statistically reliable methods to detect “outliers” and “robustly” differentiate them from a hockey stick blade in paleoclimatology? The probability of six to seven standard deviations from a simple hypothesis seems to be a bit remote!
From Shaun Marcott’s homepage (*)
Not always, it seems!
* http://proglacial.com/Proglacial/Home.html
David Middleton shows the consequence of 140 year resolution filtering vs 1 or 21 year resolution. This Alkanone series does not appear to have the resolution to even detect such transitions, emphasizing how strong an outlier is the last point.
Furthermore, Don Easterbrook observes:
Such 1 C/decade rates should be detectable with current measurement!
Hockey stick? This new one looks more like an ice pick.
It is worth noticing curious Figure 1H, which corresponds to 1B, the hockey stick that agrees with Mann 2008 discussed over on Climate Etc.
Figure 1H says it shows the number of proxies used over time, compare to Mann 2008 (among other things). It runs about all 73 for the majority of the reconstruction, but begins to drop 2000 years ago. by 1500 it is down to about 50, and by about 1800 is down to about 50. It falls off rapidly thereafter, as would be expected from the paper’s own observation that the mean resolution is 180 years, and the median resolution is 120.
The curious thing is that it goes to zero either for 1920 or 1940. It is very, very difficult to plot a substantial observed uptick by 1940 or so using exactly zero proxy observations, unless….
Marcott wrote:
“the Agassiz-Renland reconstruction does in fact contribute the majority of the apparent increase. The reason is that the small age uncertainties for the layer-counted ice core chronology relative to larger uncertainties for the other lake/ocean records. The Monte Carlo analysis lets the chronology and analytical precision of each data series vary randomly based on their stated uncertainties in 1000 realizations. In this analysis method, the chronologically well constrained Agassiz-Renland dataset remains in the 1920 − 1940 interval in all the realizations, while the lake/ocean datasets do not (and thus receive less weight in the ensemble).”
Isn’t this Hockey Stick circularity? If I am following correctly, the MC simulations let the tenuously dated series vary much more than the Agassiz-Renland series, and then the methodology rejects those series that deviate too far. While the methodology is different, isn’t that process functionally the same as having a few spiking bristlecone series among a bunch of noise series, “calibrating” out everything that doesn’t follow the spiking temperature, and then presenting the surviving bristlecone series as an ensemble mean?
Matt Skaggs, this paper doesn’t reject any series, and they aren’t weighted by correlation to anything. That makes it fairly different. That said, if you take a “well-dated” series and combine it with many poorly dated series using Marcott et al’s methodology, you will basically get back the well-dated series. In that regard, Marcott et al are doing the same thing. The only question is how much of an effect it has (which depends partially on how much discrepancy there is in dating uncertainty of the various series). A bit of rambling to think through this process:
We know time-shifting series by varying amounts reduces any signal in resulting averages of them. We know the size of the reduction is dependent on the extent of the shifting. Taken to its extreme, we could take a series with no dating uncertainty and combine it with ones that have a lot. The result? Poorly dated data would average out to white noise, and the well-dated series would come through as the entire signal.
Moreover, this effect is different at the endpoints. Dating uncertainty can shift data in either direction, and that will change where series end. Say ten series extend to 1920. In some Monte Carlo runs, all ten will cover 1920. In other runs, series will shift “left” and leave fewer than ten series covering 1920. That means well-dated series have a stronger effect at the endpoints as they are more likely to stay “in place.”
Or at least, I think that’s right. This paper makes my head swim.
Has anyone asked for the code? If not, shouldn’t someone? Alberts’ comment about Science mag strengthening their efforts on making code available suggests that Science mag might support such a request. I’ve suggested this to Steven Mosher and our host but have yet to see whether anyone has done so.
I posted this over at WUWT …
Steve McIntyre reports:
Marcott is overstating his case when he says that. Here is the one use of “robust” in either the artilcle or the supplementary information.
The way I parse that is as follows:
• They used their “Standard 5×5” averaging method, and got one answer.
• Then they used a method to “in-fill” (make up) data, averaged the mix of real data and made-up data, and got a second answer.
The DIFFERENCE between the two was judged to be “probably not robust”.
This is very different from what Steve reports. I’ll cross-post this on his blog as well.
w.
Steve: I read it the same way as you. If the difference is “not robust”, that indicates to me that they believe that the difference between the version used in their presentations and the alternatively-calculated version is an artifact (hence they are justified in using the preferred version) and not that the preferred version itself might be an artifact. But you can see the Nick Stokes-Gavin Schmidt wordsmithing defence developing.
Wow. Here I am sitting typing away at a paper for a high impact journal. The petty politics you have to deal with are demotivating enough, but when you see something like that, one wonders why you bother. What kind of peer review is this? Why is it still possible in 2013 to get anything published at all, without complete disclosure of code? By which I mean well documented code that reads like a book, and that a reviewer is supposed to send you back to square one for if it doesnt meet minimum sanitary standards and comprehensibility. The reproducibility of this work is simply nill. They cant explain the magic appearance of an uptick like that from some kind of hocus pocus black box method they barely even conceptually explain? Why don’t you come back to me with an article when you can, is what an editor in a sane world would say. Their split-tongue approach between how they phrase their article and how they approach the press is also nothing short of appalling.
It really is all about having the right friends and having the right message, is it not? If you got that covered, any absurdity can be published anywhere. Should I even want to mix my hard work with journals such as these? That’s what my career is telling me, but id feel a lot less dirty just putting things on my personal website.
Well said.
A minor curiosity–when I graph the 100-year and 200-year time step global temperature series (in the Temperature Stacks sheet of the Excel file in Supplementary Information)I see that the 200-year series has several peak values higher than the corresponding 100-year times. Not possible, I think. Checking the mean values, which should be identical or nearly so, one sees that the 200-year series is about 10% higher than the 100-year series.
Graphs available on updated file in Dropbox:
https://dl.dropbox.com/u/75831381/Marcott.SM.database.S1–law.xlsx
Steve, a point of clarification please. When they do these types of reconstructions, do they calibrate the average of proxies to global temperature (assuming tele-connection etc…), while skipping the step of evaluating/calibrating individual proxies to local temperatiure at the proxy site?
A quick skim shows at least some of the proxies are calibrated to local temperature.
Craig, in terms of proxy calibration, the closest analogue to Marcott-Shakun is …. Loehle/Loehle and McCulloch 2008. I have a post 60% written on this theme.
Why would Marcott et all be helpful to you with data/code/explanations, etc.
…”if all you’re going to do is find something wrong with it.”
Am I reading the spreadsheet correctly as it appears to me that the first value of MD95-2043 series was re-dated total of 1008 years (1007.60 BP –> 0 BP) ?!?
Steve: Yup. The re-dating of the cores is the trick that changes the thesis results to a highly promoted paper in Science. More on this.
Do you mean that they re-re-dated the cores? Marcott already re-dated them in the thesis, see p. 197. The only difference in the methodology prior the averaging appears to be the change is the “jitter” value as observed by sue, but I don’t think that produces the trick.
Steve: Good point. But yes. If you look at the thesis plot of the MD95-2043 (Cacho2043 on page 200), it ends about 1000BP. But its coretop is redated to “0 BP” in the SI. The resolution for core MD01-2421(Isono on page 201) – a critical core – is hard to tell but the redating seems to be post-thesis.
These are phytoplankton proxies for lake water temperature which in turn are then used as a proxy for air temperature. I’m interested in the fact that these proxies seem to be considered just as reliable whether they are above/below the Arctic/Antartic circles where the surface of the lakes are frozen for 6 months a year compared to lakes at more temperate climes.
Good catch, Ryan!!! As Lake/Sea-Surface temperatures figure heavily in the CO2 analysis of alkenone proxies, the difference you mention is substantial and contributes to the lack of “robustness.”
Can I make a suggestion? As far as I can find, this is the first Climate Audit post on “Marcott et al 2013”, and it doesn’t say what “Marcott et al 2013” is. It should say who he or she is, where they published it, and in a few words, what the paper claims about climate.
Reblogged this on Climate Daily.
17 Trackbacks
[…] Oh. McIntyre has already begun unpacking Marcotte. I hope Marcotte is not as think-skinned as Mann. (Will there ever be an actor in the climate wars […]
[…] https://climateaudit.org/2013/03/13/marcott-mystery-1/ […]
[…] Marcott Mystery #1 […]
[…] Marcott Mystery #1 […]
[…] All you Believers can certainly attack Dr. Easterbrook personally, but the data is the data. But, but, but, Easterbrook is a “denier”!!!! What about Warmist Steve McIntyre? […]
[…] I den nya Scienceartikeln menar visserligen författarna att deras resultat kan tolkas så att 1900-talets uppvärmning, som kopplas till människan, var ovanligt snabb. Det är detta som gett så stor uppmärksamhet i media, till exempel av Karin Bojs i DN (se referenslistan längst ner), och på bloggar. Men andra forskare och på klimatskeptiska bloggar har man ifrågasatt om sådana slutsatser verkligen kan dras, se till exempel här, här, här, här och här. […]
[…] more and more people become aware of the data manipulation used by so called Climate Scientists to falsely blame Co2 for Catastrophic Climate Change, the Politicians that are promoting this scam will eventually be outed. Outed and held to account […]
[…] Forse sì, cosa volete che vi dica, del resto questo genere di ricostruzioni non sono davvero il mio campo, né lo sono le tecniche statistiche impiegate. Fa un po’ impressione però vedere che anche chi queste cose le conosce bene non sembra troppo convinto. […]
[…] Marcott Mystery #1 […]
[…] posts op WUWT over deze studie is bijvoorbeeld niet meer bij te houden en de statistische wonderboy McIntyre blogt er eveneens vrolijk op los. De toeschouwer zou anders zomaar eens kunnen denken dat de mens het […]
[…] the meantime, Steve McIntyre has been conducting the due diligence that obviously was not done by Revkin (nor, evidently, by […]
[…] to keep track of the number of posts WUWT dedicated to this study, and the statistical wonderboy McIntyre is also energetically producing blog posts. Otherwise the general public might get the impression […]
[…] example, here is McIntyre’s plot of the Marcott data points from the actual […]
[…] Stephen McIntyre of Climate Audit looked into the research and found the study’s authors had redated some of the samples used to determine the findings. Without the redating, the research would have shown no upswing in temperatures in the 20th century. […]
[…] Stephen McIntyre of Climate Audit looked into the research and found the study’s authors had re-dated some of the samples used to determine the findings. Without the re-dating, the research would have shown no upswing in temperatures in the 20th century. […]
[…] utilisées ainsi que les démarches des calculs, les conclusions etc. (h/t Skyfall) Marcott Mystery #1 le 13/03/2013 (Le Mystère Marcott) No Uptick in Marcott Thesis le 14/03/2013 (Pas de […]
[…] Marcott Mystery #1 […]