One of the hidden assumptions of proxy reconstructions, as carried out by IPCC authors, is that each “proxy” has a linear relationship to temperature plus relatively low-order red noise. Under such circumstances, the noise will cancel out in a linear combination of proxies (reconstruction) and a “signal” will emerge. However, I’ve never seen any author discuss the validity of this assumption, let alone establish the validity.
In today’s post, I’m going to look at low-latitude South American d18O isotope series mainly from Peru, including three proxies from Neukom. Tropical ice core d18O series (especially Quelccaya, but also Huascaran and Sajama) have been a staple of temperature reconstructions. During the past few years, d18O series have also been obtained from speleothems and lake sediments.
In my opinion, before one can begin thinking about temperature reconstructions using many different types of proxies, some of which are singletons, it makes sense to see if one can make sense of something as simple as d18O series within one relatively circumscribed region.
Holocene Scale
I am increasingly looking at proxies on a Holocene scale prior to considering them on a medieval scale. By showing values from the LGM through the Holocene Optimum to the present, one can see which way is up – a proxy property that Mann, Neukom and others all too often neglect.
All but one of the proxies in the figure below is from the Peru area: the top panel shows a speleothem (Tigre Perdido); the second panel shows the Pumacocha lake sediment series (used in Neukom 2014); the third panel shows Lonnie Thompson’s Huascaran series (slightly to the north of Quelccaya); the bottom panel shows two tropical ocean d18O series: Galapagos and Guinea. I’ve shown a series from Guinea because the Atlantic is the source of Andean precipitation, because it is high resolution (and I was unable to locate a comparable high resolution series from the South American side of the Atlantic).
I find it somewhat reassuring that the three land d18O series all have “major” features in common, at least on a Milankovitch scale. In a general sense, the Huascaran, Pumacocha and Tigre Perdido series all show increasing d18O values going from the LGM to the Holocene, with a gradual decrease through the Holocene. The LIA in the Pumacocha series is rather pronounced.
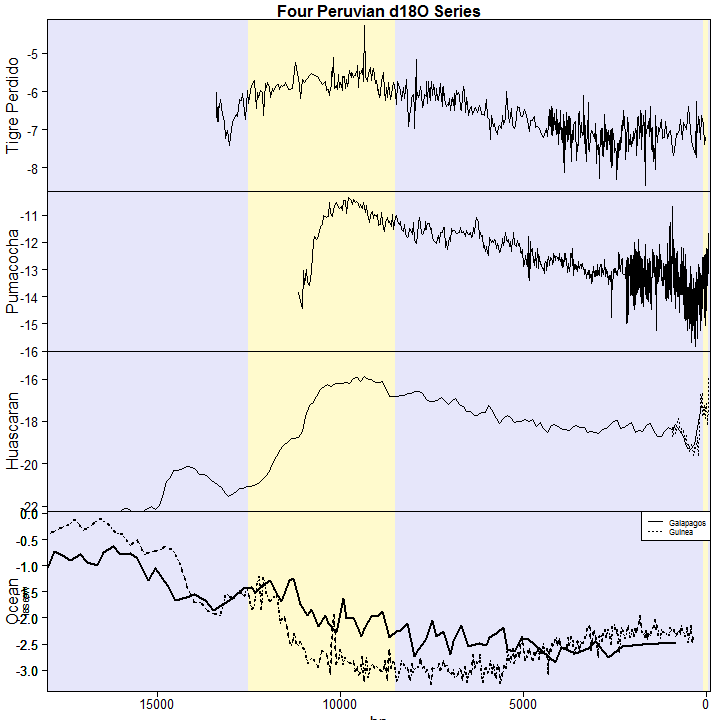
A first obvious observation, but worth keeping in mind: d18O isotope values go in opposite directions between tropical oceans and tropical land. Land d18O values go up between the LGM and the Holocene (more sharply at higher altitudes), while maring d18O values become increasingly depleted. The increasing depletion of marine d18O values from the LGM moving towards the Holocene presumably reflects the melting of continental ice sheets: the ice sheets trapped precipitation with very depleted isotopes and the melting of the ice sheets returned them to the oceans.
Precipitation in the Andes comes from the Atlantic and, like the Himalayas, is governed by monsoons: more depleted precipitation comes in the summer from rainout. The vast majority of specialists (all except Lonnie Thompson) interpret d18O as an “amount” effect: lower d18O values mean more precipitation.
In a general sense, 20th century d18O values are in between LGM and Holocene Optimum values – readers will recall that Marcott et al had reported that 20th century values were exceptional: that Elvis was leaving the building, so to speak. If there was an overall pattern of 20th century exceptionalism, then one would expect the proxy results to be swamping Milankowitch patterns, but that does not seem to be the case in this region at least. (I’ve examined many other regions with similar results.)
Medieval Scale
Neukom et al included three Peru-area d18O series in their network (plotted below from original data). The top panel shows a speleothem series (Cascayunga); the middle is the Pumacocha lake sediment once again; bottom – Quelccaya ice core. These are plotted in absolute data, not the anomalies that too often remove interesting information. Cascayunga and Quelccaya are both higher resolution than Tigre Perdido and Huascaran, though the latter are much longer. One of the three proxies is screened out of the Neukom reconstruction: readers are invited to ponder which one – I’ll tell below.
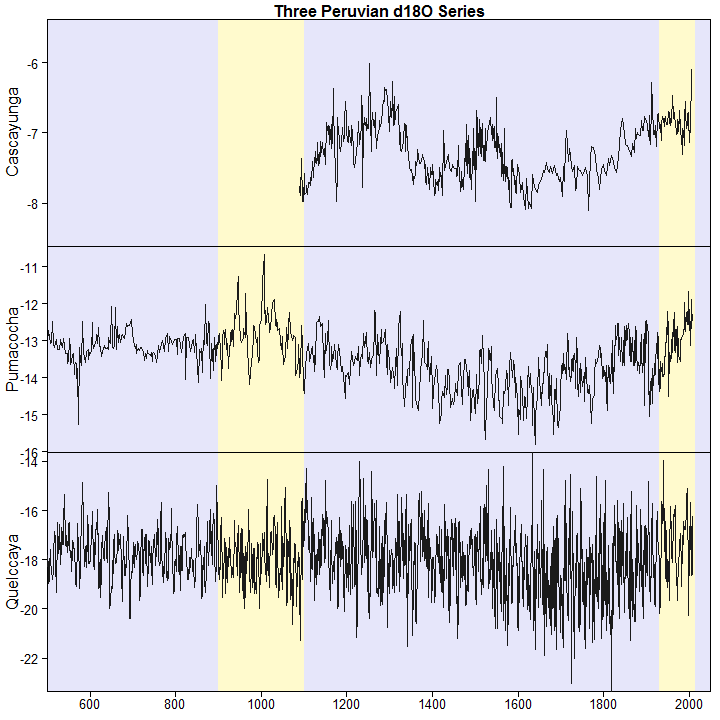
Figure 2. d18O: top – Cascayunga speleothem; middle – Pumacocha lake sediment; bottom – Quelccaya ice core.
On this scale, there is much greater high-frequency variability in the high-altitude Quelccaya ice core series than in the lower-altitude speleothem (note however that the scales are different).
In each of the three series, one can perceive d18O values increasing from the LIA to the modern period. However, the precise timing of changes do not reconcile all that well. When similar comparisons are made between proxies on a regional scales, IPCC authors (e.g. Mann, Crowley) have routinely interpret such inconsistency as evidence that the LIA and/or MWP do not reflect globally organized events, but are regional to the North Atlantic. However, here, the three d18O series are in very close proximity.
On the other hand, there is some reassurance that all three series show depleted d18O values in the LIA. In specialist (non-multiproxy articles), the depleted d18O values at Quelccaya during the LIA have been compared to Ti values at Cariaco, leading to a hypothesis that the changing precipitation patterns are due to the ITCZ moving north and south. In past CA posts, I’ve suggested that N-S movements of the ITCZ is an alternative and simpler explanation for Kim Cobb’s Palymyra coral (which joins YAD061 on the pantheon, her medieval coral is the “most influential” coral in the world) than the Mannian hypothesis of a cool medieval Pacific.
One would be hard-pressed to develop a theory under which climate change at Pumacocha and Quelccaya proceeded on radically different schedules. It seems far more plausible to me that (1) the proxies integrate d18O values from precipitation in different and complicated ways; (2) the dating of the proxies is not consistent and the errors are cumulative, not gaussian.
If one reflects back on the reconstruction project, consider trying to derive (forward model) each of these three d18O series from a “true” regional O18 series (not even trying to get to temperature just yet). It takes only a moment of reflection to realize that the residuals will be highly correlated to each of the proxy series themselves and will not be low-order red noise.
PS – Neukom screening excluded the Cascayunga series.


30 Comments
There is a hilarious Cliamtegate email in which one of Mann’s pen friends describes how his son performed a high school experiment which falsified the use of tree rings as temperature proxies.
http://www.ecowho.com/foia.php?file=0682.txt
“… stationarity is the key. Let me tell you a story. A few years back, my son Eirik did a tree ring science fair project using trees behind NCAR. He found that widths correlated with both temp and precip. However, temp and precip also correlate. There is much other evidence that it is precip that is the driver, and that the temp/width correlation arises via the temp/precip correlation. Interestingly, the temp correlations are much more ephemeral, so the complexities conspire to make this linkage non stationary. …”
Even Mann’s friends were telling him there were problems with his proxies.
Briffa provides Mike with somewhat more practical advice, about defending the veracity of the proxies, in this quote from the same email:-
“… The job , as you state , is to place on record the statement of disagreement with the “science(!)” and spin. … “
Typo below first graphs: maring = marine
Typo: “have routinely interpret such” -> “have routinely interpreted such”
You’ve got “maring” for marine, but we’ll figure it out
And Neukom on Cascayunga: Screen and shout
===|==============/ Keith DeHavelle
Why red noise?
An objective procedure to see which way is up? Isn’t that a bit restrictive on more creative types and how they might wish to use the same proxies?
Joking apart, what an important and reasonable emphasis. It will be fascinating to see where it leads, consistently applied.
Should probably be: In specialist, (non-multiproxy) articles
Better would be: In specialist articles (non-multiproxy),
So, if I get it right, different proxy types for d180 isotope analysis indicate variable contamination of d180, possibly from rainfall effects and melting ice. Tropical marine and ice core d180 isotopes seem less reliable proxies, as it is suggested they are more easily contaminated by localised rainfall or melting continental ice, whereas speleotherms and lake sediments do not suffer from this problem.
Sounds pretty reasonable.
I’d add that the differences in ‘precise timing of changes’ in the proxies you mention might reflect lags in a particular proxy response.
(Assuming Quellcaya is glacial ice). Glaciers might advance or retreat at lower levels only some years after a change in precipitation in their source regions, as it takes some years for the snow to accumulate in the source region and change the pattern of advance or retreat on the glacier lower down, which is not so much based on temperature lower down as it is with rate of precipitation and accumulation of ice higher up at the source. This sort of thing might have bearing on the patterns within d180 in ice core; there is a lag in the ice core proxy data at Quellcaya after the LIA, compared to the speleotherm and lake sediment data in figure 2.
I’m not sure how the ice core data is collected and collated, but ice on glaciers is not only affected by changes in rate of precipitation, but the ice also physically moves, this might have effects that need to be integrated in the analysis.
” Tropical marine and ice core d180 isotopes seem less reliable proxies, as it is suggested they are more easily contaminated by localised rainfall or melting continental ice, whereas speleotherms and lake sediments do not suffer from this problem.”
Unfortunately not true, at least not for speleothems. The origin of the oxygen in a speleothem is complex. It may be from rainwater (local or not), but also from dissolved limestone, or soil organics, or “old” water from e. g. glaciers that is passing through the cave system.
Furthermore cave deposits are very complex, and often not at all continuously deposited. Speleothem formation may only take place during part of the year (usually the wet season), or during unusually wet years (El Niño!), and it may be interrupted for very long periods (even whole glacial cycles) when the climate is too dry, or the ground above the cave is permanently frozen. Also the flow regime in caves very often changes over time, sometimes gradually, sometimes abruptly, as the cave system evolves or the environment around the cave changes.
If a speleothem record is to be used as a temperature proxy, the history of the cave would have to be very carefully studied and the speleothem very well dated indeed.
Your comments on speleothem proxies might have relevance as to why the MWP in the speleothem case above is late-around 1300AD, compared to other data. The cave system might be to blame.
The variability in timing of the maximum warmth of the MWP worries me, it seems to crop up often, anywhere from ~950 to ~1350AD. I find it unlikely that this is real, it is more likely that something is wrong with the data, in the particular response of the proxy or in the dating or sampling etc. Another possibility is multiple peaks of warmth, but this should also show up at individual sites, which it generally doesn’t. I suspect that as you go back in time the quality of preservation might ? be effected, it is possible that some proxy records degrade over time, the same sort of problem with isotopic leakage in rocks subjected to pressure and heat, but I note that the longer speleothem record in Tigre Perdido above looks consistent with other records.
From my uni days I recall that lake sediments were considered reasonably useful at recording and preserving information. We studied Lake George data in Australia, which shows records of bushfire history, arrival of firestick farming with aborigines, and other things. I’m surprised that not much Australian data has cropped up in proxy research, there is plenty of pretty placid lakes, caves and other things.
That had surprised me too, but maybe the thing is:
1) such core field research is extremely expensive of both time and capital. It may be more cost-effective to dragnet existing databases repeatedly ?
2) since no-one actually knows what such basic field research may really show, it may be more prudent not to find out ?
“each “proxy” has a linear relationship to temperature”
I remember from school chemistry that the speed of many chemical reactions doubles for each 10 deg rise in temperature. So not very linear in such cases.
Steve, about the validity of isotopes as proxy for temperature, maybe have a look at this:
Click to access non-calor-sed-umor.pdf
Good link for those of us looking to increase our understanding, thanks Andre. I did not notice an HTM in the GISP2 Greenland ice core d180 data in this paper.
leftturnandre,
Thank you for the link. It is another demonstration of a modern approach to climate science whereby advanced interpretations (wrongly) precede fundamental research indicated as desirable for scientific probity.
Movement of the ITCZ was also postulated as being primary factor in the depise of the Mayans. Drought followed behind it’s move north, crops failed and the Mayans die out or dispersed.
I don’t understand this comment, Stephen. The Mayans were south of the great desert belts at ~ 30°n/s … so if the ITCZ moved north, I’d expect the Mayans to get more rain, not less … what am I missing?
w.
http://www.redorbit.com/news/science/1112728583/maya-climate-change-politics-war-index-110912/
google
Thanks, Steven, looks like I was right about the direction of the ITCZ. From your citation:
w.
I would more inclined to say that ITCZ movements as an explanation are non-Team or at least non-core Team. Many specialists support the idea of the north ITCZ position as associated with MWP and south with LIA: this would also be a Willie Soon position. Mann and close associates e.g. Kim Cobb interpret related data as evidence for a “cool” medieval Pacific.
The issue affects interpretation of Kim Cobb’s medieval Palmyra coral – the “most influential” coral in the world. Kim Cobb, Michael Mann and many others interpret the d18O values of this coral as evidence of a cool medieval Pacific and thus against a global MWP.
However, there is a very sharp d18O gradient north and south along the ITCZ – desert islands in the doldrums and tropical jungle in the ITCZ. Palmyra’s d18O values would change with N-S movements of this gradient. Julian Sachs has argued for N-S movements.
Curiously, Julian Sachs and Kim Cobb were the first two people that I met at AGU (back in 2004). Kim Cobb told me at AGU a couple of years ago that either she was right or Julian Sachs was right, but they could not both be right.
A prime example of speculative science. The whole drought scenario is based on specimens from one cave, as I read the report. Talk about assumptions! It also ignores the fact that the slash and burn agriculture of that area yields very short-lived productivity before the soil becomes sterile, drought or no. Repeat this over several generations and the polity wastes away from declining fertility. If one wishes to examine movement of rainfall belts, one should look to north Africa, where there is undisputable evidence of ample rainfall, where the Sahara now is, during the Climatic Optimum.
stephan you misremembered
The climate changes were driven by El Nino events and the shifting position of the Intertropical Convergence Zone (ITCZ), which is a belt of rainfall encircling the Earth. The team hypothesizes that during the Maya Collapse, the ITCZ didn’t reach far enough north, which resulted in a catastrophic drought.
Made more fragile by lack of groundwater.
===========
Do we have any solidity – actual mechanism between the two – to the tie-in between El Niño and the ITCZ wanderings, or is it still at the level of “reasonable conjecture”?
“One of the hidden assumptions of proxy reconstructions, as carried out by IPCC authors, is that each “proxy” has a linear relationship to temperature plus relatively low-order red noise. Under such circumstances, the noise will cancel out in a linear combination of proxies (reconstruction) and a “signal” will emerge. However, I’ve never seen any author discuss the validity of this assumption, let alone establish the validity.”
Cancelling out would require not selecting proxies for reconstruction use after the fact, but would require using a prior selection criteria and then using all those selected proxies. A selection process that is biased can never cancel out the noise and reveal a true signal. Further in using cancellation, even with a proper selection process, requires that the noise be entirely random over time. I have never seen an author of temperature reconstructions bother with these details either. And why should they when they can publish flawed work that is basically biased towards the answer that confirms their predispositions.
Kenneth: You mean we should: “try to give all of the information to
help others to judge the value of your contribution; not just the
information that leads to judgment in one particular direction or
another.”? Richard Feynman 1974
Do not understand why Cascayunga was screened-out. Maybe not long enough?
EdeF I am reminded of your post of December 17 referencing the following:
Click to access Pape-2010-Isotope-Variability.pdf
Based on my limited knowledge and understanding, it seems indicative of the difficulty in validating the relationship between speleothem isotope content and temperature, and certainly the difficulty of validating it to temperature within 10ths of a degree Celsius. Could this be the reason for screening out the Cascayunga yunga series?
Close proximity suggests to me, too, Steve, that the signal is there. But I also think there is actually something that can be done to verify it.
Long ago (~2005 or so?) in a spaghetti graph (anomalies, I am sure) on CT or WUWT it seemed clear to me that this “precise timing” thing existed. Quite a few individual lines dipped or peaked near each other but not exactly at the same time.
I recall suggesting that efforts at “rectifying” these (especially instead of homogenizing them together) by shifting the graphs a bit back and forth until they all merged as well as possible would allow for a much clearer signal. My suggestion at the time was that there was not only uncertainty in the values of each data point, but also an uncertainty in the age. All of them being proxies, their starting points in the near present are all rather vague, anyway. I think it is a fundamental error to believe that present day = 0 is the same in all proxies. That zero date should be seen as a fundamental uncertainty.
WHY? Because if the climate was really going up and down (which of course it was), then the signals SHOULD BE in-phase. The question is, then: Why aren’t they? I propose that it was not the climate that was out of phase in different nearby regions (or even globally) but that the reconstructions themselves have within them artifacts that are misleading. And that artifact is the TIMING.
Which is what you, Steve, are addressing here. But take it to the next level!
It seems overly innocent to think that the only uncertainty is in the Y-axis.
I still suggest that this would be a useful exercise. If the proxies can be found to be in-phase more or less, then I think it would show not only a strengthening of the argument for the validity of the proxy claim in the first place, but also to reinforce the entire effort in climatology reconstructions. If this doesn’t show such matching phases, then I am wrong and the idea can be thrown out.
I don’t have the stat expertise whatsoever to do this, but my very decent spatial visualization tells ne that there is something in this that exploration would be worthwhile for those who do.
One Trackback
[…] https://climateaudit.org/2014/04/01/sh-proxies-peru-d18o/#more-19095 […]