Mann has recently provided some inaccurate information on his treatment of bristlecone pines.
Here (see comment #3) is the first discussion:
What is your position on the Bristlecone Pines? (I’m referring to MM’s suggestion that they are in some way anomalous)
[Response: Thanks for the question. Much has been written on the potential influence of non-climatic factors in recent centuries (potentially associated with co2 effects) on the growth pattern of certain high elevation drought stressed trees such as the Bristlecone Pines you refer to. In Mann et al (1999) [Mann, M.E., Bradley, R.S. and Hughes, M.K., Northern Hemisphere Temperatures During the Past Millennium: Inferences, Uncertainties, and Limitations, Geophysical Research Letters, 26, 759-762, 1999], an attempt was made to remove these potential non-climatic influences. This was done by subtracting the anomalous pattern of growth that emerges over the past couple centuries in these chronologies relative to other tree-ring chronologies that otherwise exhibit very similar patterns of growth back in time, but which are unlikely to be influenced by the same non-climatic factors. More discussion of these issues (and references to relevant past work) can be found in the paper. -Mike]
This either states or suggests that 15th century values were "adjusted" for bristlecone pine problems. However, MBH99 did NOT make any adjustment to the 15th century period. This can be readily seen by comparing MBH98 values archived here (see column 1) with post-1400 MBH99 values archived here — they are identical. In passing, if Mann et al. identified a problem with the bristlecones between MBH98 and MBH99, shouldn’t they have corrected MBH98 results and issued a Corrigendum at Nature?
The second discussion is here – see comment 68:
First, the Dummies’ guide (DG) argues (in point 7) that the MM critique is not really about statistical methodology but about what source data should be included, and argues for inclusion of the "bristlecone pine" dataset on the grounds that improves the fit over the 19th century validation period. The DG does not appear to address the MM argument, however, that the hockey-stick shaped result is highly sensitive to the inclusion or exclusion of this one dataset. Is it? In other words, using correct PC methodology, how much does the large-scale hockey-stick shape change if the bristlecone pine data are excluded?
[Response: The issue of the sensitivity of the reconstructions to particular data was addressed in some detail by MBH98. See e.g. the original supplementary table here. The skill (that is, the estimated reliability of) the reconstructions was found to be relatively insensitive to the precise mix of data used over the past several centuries. Further back in time, the potential for a statistically skillful reconstruction becomes more sensitive to the availability of certain key data, including several of the long western North American tree-ring data. This finding is hardly new, however–it was discussed in considerable detail by Mann et al in followup paper to MBH98 published in Geophysical Research Letters in 1999. ….–mike] see #68
This realclimate response does not answer the question — a simple yes or no would have sufficed.
“Experiments” 14 and 15 in the original SI are for steps from 1820 on and 1750 on respectively. It is the 15th century that is in dispute not the 19th century. By the way, why didn’t they report the AD1400 "experiment" excluding bristlecones, evidence of which is at ftp://holocene.evsc.virginia.edu/pub/MBH98/TREE/ITRDB/NOAMER/BACKTO_1400-CENSORED? This would have been obligatory disclosure under Sorbanes-Oxley.
Second, a “statistically skilful” reconstruction obviously has both RE and R2 significance. In our GRL article, we estimated that the MBH98 reconstruction in the 15th century has an (unreported) R2 of 0.0 (!). Mann et al. have not rebutted this estimate, but instead have criticized the R2 statistic in Rutherford et al. [2005], a criticism inconsistent with prior writings of the various co-authors.
Third, the non-robustness to bristlecone pines is not explicitly stated in MBH99, as shown below. In fact, MBH99 distinguishes the pre-1400 period from the post-1400 period, giving no hint of non-robustness in the 15th century.
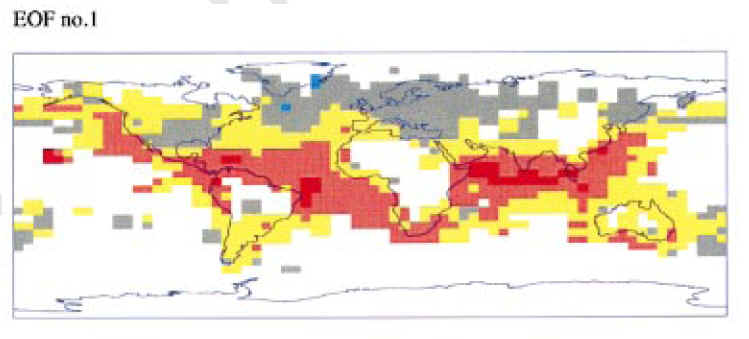
In using the sparser dataset available over the entire millennium (Table 1), only a relatively small number of indicators are available in regions (e.g., western North America) where the primary pattern of hemispheric mean temperature variation has significant amplitude (see Fig. 2 in MBH98), and where regional variations appear to be closely tied to global-scale temperature variations in model-based experiments [Bradley, 1996]. These few indicators thus take on a particularly important role (in fact, as discussed below, one such indicator { PC #1 of the ITRDB data } is found to be essential), in contrast with the post AD 1400 reconstructions of MBH98 for which indicators are available in several key regions [e.g., the North American northern treeline ("NT") dendroclimatic chronologies of Jacoby and D’Arrigo, 1989].
In passing, Figure 2 of MBH98 does not show that the EOF1 has “significant amplitude” in western North America, as shown below. The western US in bristlecone pine areas is mostly shaded grey (slightly negative) .
Mann’s comments have misled some recent posters (e.g. John C. at Ukweatherworld):
However MBH do not need to assume that it [the anomalous bristlecone pine growth] is CO2 related. All they note is that it is not climate related and remove it. … #202756
So they do not know what causes it but they just remove it. #207050
In fact, as noted above, there is NO adjustment in the period which we discuss.
So for anyone who feels like persisting with this, it’s worth taking another try at realclimate, asking once again (1) whether they did any post-1400 "adjustments"; (2) whether they can get a hockeystick inclusive of the 15th century without the bristlecones,


34 Comments
Who posted this article?
I wish there were a “People” list in the bar on the right (as I recall seeing in realclimate) by which I could view the bios of posters. I’ve grown curious over the months.
Re: #1
It wasn’t me. Therefore it was Steve McIntyre using the "Admin" account. Sorry for the confusion.
To clairify, are articles posted here either by ‘John A’ or Steve McIntyre only?
Ahh, fame and fortune at last. Well, at least the fame – the fortune will come when Steve mails me my royalties cheque.
However I will note that your comments imply that I was basing what I said on Mann’s comments in RealClimate and just for the record I was basing them on my reading of MBH 99. Steve presents a different point of view and I will consider it in my copious spare time but for now I do not feel that I have been misled.
John, I think that you’ll change your mind once you’ve had a chance to look in more detail. why don’t you try re-submitting the above questions to realclimate? Steve
Where’s your about
good site!
Steve McIntyre wrote:
“This either states or suggests that 15th century values were “adjusted” for bristlecone pine problems.”
The full story as far as I can tell is that when MBH98 and MBH99 were produced, the non-climatic factor was removed from noamer PC1 before calibration and reconstruction. However, in their later paper, Mann et al argue that not bothering to remove this non-climatic factor makes very little difference to the long term trend in the reconstruction. They illustrate this by comparing the reconstruction obtainable using tree-rings with the reconstruction obtainable without using any tree-rings back to 1760. If the tree-ring reconstruction is going to have a 20th century versus earlier long-term bias because of non-climatic factors then it will show up in this graph.
SM:
“In passing, if Mann et al. identified a problem with the bristlecones between MBH98 and MBH99, shouldn’t they have corrected MBH98 results and issued a Corrigendum at Nature?”
I’d say they probably applied the non-climatic correction to the proxies in MBH98 but judged that it wasn’t important enough to write about it in that paper and decided to leave describing it until MBH99 where it obviously became a much more important issue because the bristlecones were now (i.e. before 1404) more important than any other proxy.
SM:
“Third, the non-robustness to bristlecone pines (for the 1400 step) is not explicitly stated in MBH99, as shown below. In fact, MBH99 distinguishes the pre-1400 period from the post-1400 period, giving no hint of non-robustness in the 15th century.”
MBH99 freely admits the non-robustness to bristlecone pines for the reconstruction from 1000 to 1400. If they fail to notice that a less obvious non-robustness extends up to 1450 then they’re not really avoiding the main issue. (BTW, I’d expect that the non-robustness actually only has to extend up to 1428, because this is the first year that northern treeline 6 becomes available and it takes over from the bristlecones as the second most important proxy (northern treeline 11 is the most important from 1404). Wahl and Ammann showed that the “1450” proxy network that includes treeline 11 and treeline 6 is robust to removal of bristlecones).
So MBH99 is really just failing to notice that MBH98 is non-robust to bristlecone pines for a 1400 to 1427 step while freely admitting to being non-robust to bristlecone pines for its 1000 to 1400 step. Forgive me for being presumptuous but I really think they are clearly putting the main issue front and centre.
Chris, you state:
Why on earth would you say that the “non-climatic” factor was removed in MBH98? Where’s the evidence for this?
As you are such an expert on this issue, please replicate the MBH99 removal of the “non-climatic” factor.
BTW, how do you detect “non-climatic” factors? What one is suppose to use to test if a treering index contains a “non-climatic” signal, or if all factors are of “climatic” origin.
BS! MBH9x does not have steps 1404 or 1428. And NOAMER “PC1” is still by far the most dominating proxy in AD1450. In AD1500 step treeline 11 and “PC1” are about the same level but clearly front of treeline 6.
Also Chris, have you noticed that the Australian treering “PC1” is one of the most dominating proxies after AD1600. Isn’t it wonderful that SH has something important to contribute to a NH reconstruction!
Don’t forget that “treeline #11” is the Gaspe cedar series, which is another can of worms. Cedar specialists at the University of Guelph – who have studied cedars intensively for about 20 years, told us categorically that cedars do not respond linearly to increased temperatures – they like cool and moist summers.
Last year I posted up this update of the Gaspe series:
D’Arrigo and Jacoby refused to archive the updated information on the grounds that the old data showed NH temperature increases better. Look at my correspondence with Jacoby. Jacoby’s done lots of good field collecting but the correspondence is repugnant. Then both he and Cook refused to identify provide a map of the location where the samples were taken, when I said that I wanted to re-sample the sites.
Chris, there are 2 problems with accepting the claim that MBH removed the contamination in the bcp series. First, the treatment for bcp contamination was only proposed in the 1999 paper, and was not used in the 1998 paper. But if you compare the post-1400 portion of the MBH99 reconstruction with the MBH98 recontruction, they are identical. In other words they could not have not applied any treatment to their post-1400 data even in the 1999 results. We showed this slide to the NAS panel, and I hoped that it would merit a mention in their report, but no luck. Anyway, if you think the method removed the contamination from the post-1400 data, what kind of filtering method leaves the data unchanged?
Second, the treatment they do describe only involves reducing the proxy values up to about 1900, then they say the contamination effect is saturated. I suspect most readers think that a treatment for a false CO2 signal would involve something like regressing the series on the CO2 data up to 1980 and using the residuals. At one point Steve and I looked at that and of course the hockey stick disappears from the final result. But that’s not what MBH did. The actual procedure is described somewhere on CA, I think, but it’s not what one would intuitively assume for the problem. And, like I say, whatever the method, it is zeroed out after 1400.
Ross, I don’t think that I’ve posted up the “adjustment” procedure. Jean S and I have recently exchanged some correspondence on this adjustment. We’re able to exactly emulate the MBH99 step, but there’s some still undisclsode fiddle in the AD1400 step – Jean S believes that Mann didn’t use the proxy set that’s presently archived for this step and I see no other explanation.
It looks as though the MBH99 reconstruction using the “unfixed” PC1 fails the RE step. It overshoots in the 19th century – something that Crowley mentions. By shaving the PC1 (“fixing”), Mann coerces the 19th century mean enough to get a positive RE. So Mann’s motives for “fixing” the PC1 seem pretty inglorious.
There’s a very curious logical issue as well. Since Mann’s “unfixed” method fails his own RE test, his RE “skill” stands or falls on the existence of 19th century fertilization in the exact quantum of the shaving but no 20th century fertilization. If you translate this to CO2 ppm, the entire argument is absurd, as we’ve discussed.
Ross McKitrick said:
“Chris, there are 2 problems with accepting the claim that MBH removed the contamination in the bcp series. First, the treatment for bcp contamination was only proposed in the 1999 paper, and was not used in the 1998 paper. But if you compare the post-1400 portion of the MBH99 reconstruction with the MBH98 recontruction, they are identical.”
I can accept this on the basis that MBH in MBH99 could have believed that not applying the non-climatic correction to the post-1400 part of the reconstruction would not make a significant difference because of the presence of treeline 11. But I did make an argument for my hypothesis in the second point because MBH would most likely have been aware of the non-climatic factor when they produced MBH98.
RM:
“Second, the treatment they do describe only involves reducing the proxy values up to about 1900,”
I think that should be “increasing”, BTW, or alternatively reducing the proxy values from around 1800 on.
But treatment method is not the important point. The important point is that Mann et al argue in a later paper that not bothering to remove this non-climatic factor makes very little difference to the long term trend in the reconstruction. They illustrate this by comparing the reconstruction obtainable using tree-rings with the reconstruction obtainable without using any tree-rings back to 1760. If the tree-ring reconstruction is going to have a 20th century versus earlier long-term bias because of non-climatic factors then it will show up in this graph. This bias would also have shown up in Wahl and Ammann’s Scenario 6c (1450 Network) where excluding the 15 most weighted noamer PC1 proxies removes only about 0.06 degrees C average of hockeystick bias from the reconstruction in the 1450-1799 period.
Re #14
And you agree with this argument?
Re #14
First, that’s not a “later paper”, it’s an electronic document with content circa 1998. Second, I could not find the argument you are referring to. I tried searching on “bristlecone” and “non-climatic factor” and found nothing. As the document is several dozen pages long, could you point out to me where exactly they argue that that “not bothering to remove this non-climatic factor makes very little difference to the long term trend in the reconstruction”? It’s probably there, but in differnt language.
Thanks, bender.
The most recent reference in that online document is dated to AD2000. That puts it at circa 2001. That paper therefore predates everything on this blog.
1. Partial apology – I did not see that “argue” had a link attached to it. I only caught the 2nd link to “later paper”. [Please, can we fix this, John A?]
2. In the “argue” link – http://www.ncdc.noaa.gov/paleo/ei/ei_nodendro.html – the comparison with and without tree-rings spans 1750-1980 and the uptick there is 1920-1945. This is not a long enough time-horizon to show the HS recon blade, which has a 1980-1998 uptick. Therefore this figure does not do what you say it does. It doesn’t prove anything about how the blade or handle would be changed by correcting the bcps for a “non-climatic” effect.
3. Whether your argument is correct or not depends on what you mean by “removing” this “non-climatic” factor. Do not forget that nonlinear and/or synergistic interactions among factors are a climatic effect that, AFAIK, no one removes. How many times must I say: it’s not just about CO2. It’s about everything nonlinear-synergistic that is not captured in a linear-additive model.
4. If chronologies differ between MWP megadroughted victims and survivors then this is a “climatic factor” whose influence could be very strong, yet impossible to estimate and remove.
Re #18
Bender you might be able to fix the problem of ‘invisible’ links without getting John A involved – by setting an option in your browser…
Click on ‘Tools’
Select ‘Internet Options’
Click on the ‘Advanced” tab
Scroll down until you see ‘Underline Links’ on the ‘Browser section
Click on the ‘Always’ option
Click on the ‘Apply’ button
(If you’re not using IE these instructions will need to be modified somewhat, but similar functionality exists in Firefox, etc.)
Chris O’Neill, the problem with the claims in the 2000 paper is that they are false and Mann et al had reason to know that they were false.
The 2000 paper said:
When Mann made these claims, he knew from the CENSORED directory that the AD1400 reconstructions without bristlecones were not “quite similar”, but were very different. Ammann and Wahl, and even Juckes, admit this deep in their text. If Mann wanted to argue that this didn’t “matter”, that option was open to him. But that’s not what they did.
Thank you, #19. (Twice I’ve embarrassed myself after not seeing an important link someone had included.)
Steve McIntyre wrote:
“When Mann made these claims, he knew from the CENSORED directory that the AD1400 reconstructions without bristlecones were not “quite similar”, but were very different. Ammann and Wahl, and even Juckes, admit this deep in their text. If Mann wanted to argue that this didn’t “matter”, that option was open to him.”
That’s not the same issue. The 1400 step is dependent on the inclusion of the bristlecone proxies. Being dependent on a proxy doesn’t necessarily mean that that proxy causes a bias. (Although in the case of the bristlecones they do cause a bias of about 0.08 degrees C in one of my reconstruction tests*.) Being dependent on a proxy can mean the signal/noise ratio is too low without it. To show bias you need to compare reconstructions which each have a satisfactory signal/noise ratio. This is normally done during periods when there are a large enough number of proxies to get a satisfactory S/N ratio when proxies are left out. In Wahl and Ammann’s tests, this was the 1450 step.
* I did a test that calibrated the 1400 Network against the reconstructed PC1 produced by the 1600 Network. The calibration period was 1600-1799. This calibration period avoids the vast majority of the non-climatic bias in the bristlecone proxies. The resulting reconstruction has a correlation with the normal reconstruction from the 1400 Network of 0.76 over the 1400-1599 period and an average difference over the same period of 0.08 degrees C (the normal reconstruction is lower). So on that basis the biasing effect is 0.08 degrees C.
Re #22 Chris O’Neill, thanks for your post. Has this work of yours been published, or are you working toward publishing it? It would be interesting to see your full results.
Chris,
Good to see you trying your hand at statistics and auditing. Keep up the good work!
I wouldn’t mind a few clarifications though. It is a long time since I read W&A so I may be a bit rusty on some topics:
Could do with a little more detail here. What measure are you testing with? Obviously the samples contain common noise components, how have you checked to ensure the signal correlation (what we are looking for) is not swamped by the noise correlation?
Re #24
I originally cross-posted this with post #23, and have since thought of several other questions to ask. But it makes no sense to try to reverse-engineer what was done in #22 by asking questions; bender’s suggestion is a good one, Chris, write up what you’ve done in a paper. It would be more efficient, remove ambiguity and reduce the chance for misunderstanding.
Chris, you’re welcome to post a thread here with a little more details on what you’ve done. Email your note to me and I’ll post it up. I’m pretty sure that I will disagree with what you’re saying though.
Spence_UK wrote:
“Obviously the samples contain common noise components, how have you checked to ensure the signal correlation (what we are looking for) is not swamped by the noise correlation?”
At this stage I just want to point out that I don’t have much knowledge of statistical validation of reconstructions which I appreciate is quite complex because of the very low unfiltered signal to noise ratios involved. My interest in this thread is determining if the particular factors affecting bristlecone proxies make it impossible to use them to make reconstructions as good as using other proxies (regardless of whether there are problems with using proxies in general).
Chris,
I would also encourage you to have Steve M open up a thread to show what you have done. Unlike one unrelated climate related blog, the people here welcome opposing views.
Yeah, we always like to have fresh mea… er fresh views!
Dave, I can’t get back to the Monckton articles, but I found this great article on black body radiation and explanation for why CO2 (despite not having an overall dipole) and H2O radiate while O2 and N2 don’t (unless they get so hot they become a plasma, I imagine) and so forth:
Black Body Radiation
re: #30 Loki,
I didn’t see in your link any reference to gases and black body radiation per se. I believe I’ve explained before that though gases like O2 and N2 can’t radiate by themselves, they can radiate during collisions. And because collisions will be both more common and more energetic the warmer a gas is, they’ll radiate more often and at shorter wavelengths. But there’s no doubt that GHGs will radiate more.
I was working from the basis that H2O and CO2 have slight charge differentials between the atom in the middle and those on the ends, thus creating moving charges …
When you say that O2 and N2 can radiate during collisions, what do you mean? I imagine you are not referring to momentum transfers between the molecules duing a collision.
re: #32 Loki,
Correct. I just thought from your wording that there was something explicitly talking about how gases emitted on the page.
If you have two molecules interacting there will be a short period of time when you have essentially four atoms (usually) forming one larger molecule. Assuming the interaction time is long enough for some vibrating or bending or whatever to occur energy may be emitted. I wish I had the skill to calculate the odds of such a emission but I keep throwing this out and hoping that someone with advanced training in Quantum Mechanics will come along and make it clear.
I recently watched a Finnish documentary the link to the transcript did not seem to work. At one point it stated that bristlecone pines were no longer used as a proxy, is that true?
Steve: Absolutely not.
2 Trackbacks
[…] them not to hide adverse results in a folder marked “BACKTO_1400-CENSORED“. Tell them not to make stupid mathematical mistakes and then refuse to show their work. Tell […]
[…] them not to hide adverse results in a folder marked “BACKTO_1400-CENSORED“. Tell them not to make stupid mathematical mistakes and then refuse to show their work. Tell […]