The Yang version of Guliya goes back to “AD200” and is dated younger than Thompson et al 2004 (although a younger dating may also be in Thompson et al PNAS 2006). I did a quick comparison of the unarchived visual plot in Thompson et al (Science 1997) and compared it to the Yang version, yielding still more problems.
First, here’s the dO18 plot from Thompson et al 1997.
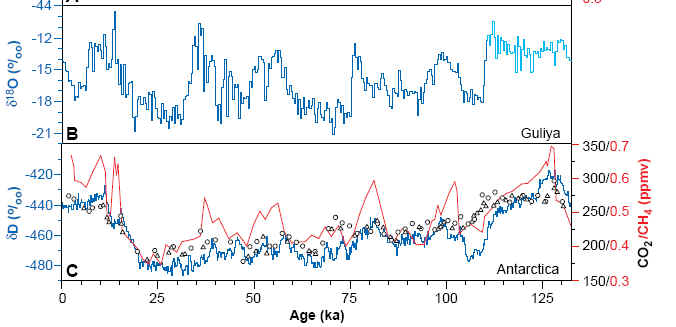
The original caption stated: “the Guliya record is also compared to the Vostok dD (blue), CH4 (red) and CO2 (black) [(13); circles, 1987 data; triangles, 1991 data] records (C), which display temporal continuity below isotope Stage 5d.” Thompson stated that dating was based on: “We used the apparent correlation between atmospheric CH4 levels and stadial and interstadial events inferred from d18O values”.
Next, I’m going to show a blow-up of the most recent portion of the above graphic, showing much higher dO18 values in an earlier portion of the Holocene, with the change in dO18 values from around -12 to -17 occurring about 6-8000 years ago.
Figure 2: Blow-up of Figure 3 from Thompson et al 1997.
Finally here is the data from Yang et al 2002 (kindly sent to me by email by Dr Yang some time ago) plotted with older to the right as in the Thompson graphic shown above. Observe the change between -17 values and -12 values, only this time the change takes place in the 3rd century AD. I’ll bet dollars-to-doughnuts that, if and when the samples are reconciled, we’re looking at the same transition in the two plots, merely dated differently. The reason for the enormous size of the difference is simply the exponential age models – so systemic age errors in the older parts of the core can be millenia, not simply 1-2%.


12 Comments
Steve – you are so prolific, I’m sure most of us just can’t keep up with you! There’s been at least two new entries since I last looked. We all have other lives to lead you know. But all great stuff.
I know that it’s almost counter-productive posting up some of these points. However, if I don’t log the point when I notice it, I lose track of it. Obviously I hope to pull all of this together some time, but I’m still exploring.
Right now I’m trying to finish my AGU presentation and I don’t want to notice these things right now, but they are pretty compelling.
Keep it up Steve M. Makes more people aware of what is(and is not) out there. Thanks a lot.
Steve, I believe the examples you have shown here highlight a serious problem, not just in ice studies but other proxies such as the deep sea record and speleothems. I call it the curse of ‘wiggle matching’. In the absence of good quality, independent methods for dating and control of an age model it is commpon practise to match the wiggels in one profile with those in a different archive.
I think that the Vostok record may have been matched to the SPECMAP deep sea d18-O record, itself a stacked foraminiferal record and slightly tuned to orbital parameters. Now we have Guliya matched to the methane record in Vostok.
This process imparts a conformity to the data and suppresses any differences that are likely to exist. It is also based on the assumption that there is an underlying causality between atmospheric CH4 levels and the d18-O in Guliya, namely temperature. However, we know that the TP record is likely to contain both temperature and more importantly a monsoon (precipitation) signal that is not apparent in the methane record.
Finally we have the situation where a high resolution record (Guliya) is tuned to a low resolution one (CH4).
One has to wonder will this whole house of cards begin to crumble if and when people start to invest time and money in high quality dating of these archives. I admit it is difficult for ice, but wiggle matching is a very poor substitute.
Here is a interesting new website concept, I wonder if it will ever catch on with the paleoclimate folks
What is Swivel?
Swivel is a place where curious people explore data ‘€” all kinds of data.
http://swivel.com/
Swivel lets you explore data and share your insights with others. Swivel has data about politics, economics, weather, sports, business and more.
Swivel is full of good stuff. We think of it like this:
* Explore popular data or obscure data. Search for it or have fun cruising all the colorful graphs, data sets and opinions.
* Compare gas prices to presidential approval ratings or UFO sightings to iPod sales. You might find a crazy coincidence or something more.
* Share your insights by posting a graph to your blog or emailing a link to your friends and coworkers.
* Upload the information you care about, describe it, pick a color scheme and even pick a cool photo to bring it to life.
If you’re curious about data, Swivel is the place for you.
.
#4 – Stacked records, yes, but carefully stacked. Here’s the paper on the method. Wiggle-matching of additional records should be at least as careful.
http://www.ldeo.columbia.edu/res/div/ocp/pub/martinson/science.pdf
re #6
Gary, I quite agree that the stacked SPECMAP record is an exemplar of excellent time correlation between the benthic d18-O record of deep ocean cores. Of course here the correlation is of like with like. That is an ice volume driven change in the oxygen isotope composition of the oceans. One should bear in mind however that the accuracy of the correlation is compromised by sedimentation rates and sampling intervals such that inter core correlation may only be accurate to 2000 to 4000 years.
Of course the SPECMAP project was targeted at understanding the Pleistocene glacial-interglacial cycles which have a periodicity of ca. 110,000 years for the last 4 ice ages and possibly a shorter period of 41,000 years for ice ages before this. On this time scale an accuracy of 2-4000 years represents a few percent only. One should also bear in mind that SPECMAP intended to provide a tool for correlation rather than an absolute dating technique.
One should question the robustness of correlating other records with the deep sea record, particularly where these records have a lower resolution and where the time period of interest is different to that of the Pleistocene.
There is no substitute for independent dating. For the recent Holocene ice core record this includes counting annual layers.
Paul, I agree on all your points. SPECMAP was 25 years ago and 2-4 kyrs sampling resolution was fine for the task at hand. The isotopic stages were pretty well recognized and independently dated by then. When dissimilar records are correlated, it should be done at least as carefully as the SPECMAP work. We’re not seeing that.
This is all pretty amazing.
Just to re-confirm (since there are a number of references to “Thompson et al 2004, Climatic Change”) I think this refers to
Thompson et. al., “Tropical Glacier and Ice Core Evidence of Climate Change on Annual to Millennial Time Scales’, Climatic Change, Volume 59, Numbers 1-2 / July, 2003
correct?
Geoff, yes you are right. The reason for the confusion is that the data for the 2003 Climate Change paper was lodged in 2004 with the World Data Center for Palaeoclimatology.
http://www1.ncdc.noaa.gov/pub/data/paleo/icecore/trop/guliya/guliya-d18o.txt
They have made the following suggestion:
SUGGESTED DATA CITATION: Thompson, L.G., et al.. 2004.
Guliya, China Ice Core Oxygen Isotope Data.
IGBP PAGES/World Data Center for Paleoclimatology
Data Contribution Series # 2004-057.
NOAA/NGDC Paleoclimatology Program, Boulder CO, USA.
The date of the paper (2003) and the data citation (2004) are different and hence the confusion.
Hi Paul,
Thanks for the clarification. I think it makes the most sense to refer to the paper and data separately which may reduce confusion.
Some people may find it amusing that Dr. Thompson himself mis-cites the Climatic Change article reference in his PNAS article this year, giving the year as 2002 (which is when he wrote it, not the year it was published) as you can see here (ref. 16).
He et al. (2004) has a plot of Guliya δ18O for the Holocene at higher resolution that shown in Thompson et al. 1997 or elsewhere. It shows an short period of less negative δ18O at about 1500 years. With some changes in age model, this could be the event 2000 years ago in Yang et al. 2002. In He et al (2004), the major mid-Holocene transition is dated to almost exactly the same age as it is in Thompson et al. (1997).
Yang et al. (2004) extends the isotopic stratigraphy of Yang et al. (2002) by a couple of hundred years. It contains the following text, which implies that the Thompson and Yang are working independently on the same core.
Thompson et al. (2006) includes a plot of decadal resolution data for the last 2000 years from Guliya. The last thousand of which matches the Climate Change paper data.
He et al (2004) Asynchronous Holocene climatic change across China. Quaternary Research 61, 52–63.
Thompson et al (2006) Holocene climate variability archived in the Puruogangri ice cap on the central Tibetan Plateau. Annals of Glaciology 43, 61-69.
Yang et al. (2004), Evidence for a late Holocene warm and humid climate period and environmental characteristics in the arid zones of northwest China during 2.2~1.8 kyr B.P. J. Geophys. Res., 109, D02105.