I was planning a new post on the truncation of the inconvenient 20th century downturn in the Briffa 2001 graphic in the IPCC graphic, that I observed some time ago here. Since data truncation is in the news, I was going to update the graphic in this post to better show just how cynical the IPCC truncation was (and will still do so.)
In the course of doing so, I thought that I’d check Briffa’s correlation claims and, surprisingly or unsurprisingly, found that my calculations were consistently lower than his. Also that the correlations over the full period of overlap were lower than the reported correlations over 1880-1960.
Briffa et al 2001 made 9 regional reconstructions shown in his Plate 2. See here with digital versions of 9 regional reconstructions here. Here is an example of one of the regional reconstructions together with Briffa’s description:
Plate 2 shows all of the new-low-frequency April-September regional reconstructions, plotted here as decadally smoothed anomalues in black. They are bracketed by their 1 and 2 standard error confidence estimates. These are time and time-scale-dependent and take into account the residual temperature variance in calibration and uncertainty (Standard errors) in the regression coefficients, as well as acconting for autocorreltation in the residuals (using a method suggested by P. Bloomfield, pers comm 1990) as described by Briffa et al (submitted 2000 – Holocene 2002).
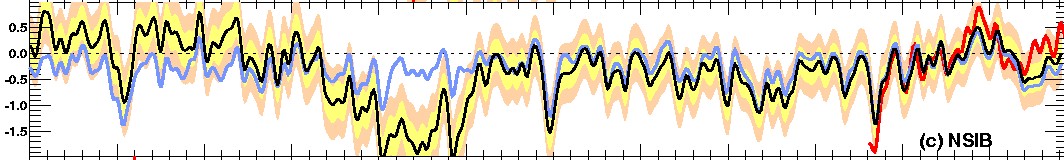
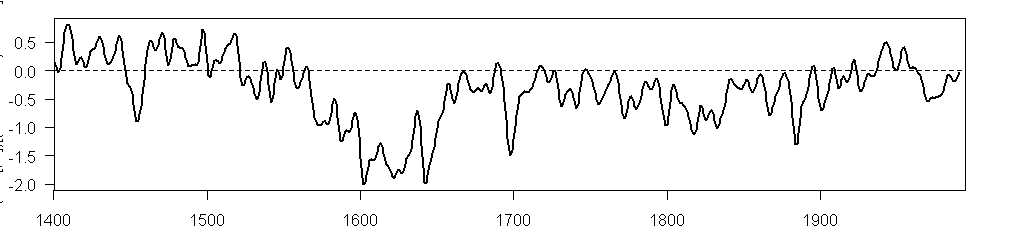
Excerpt (NSIB) from Plate 2 of Briffa et al 2001; together with plot of data archived at NNCDC.
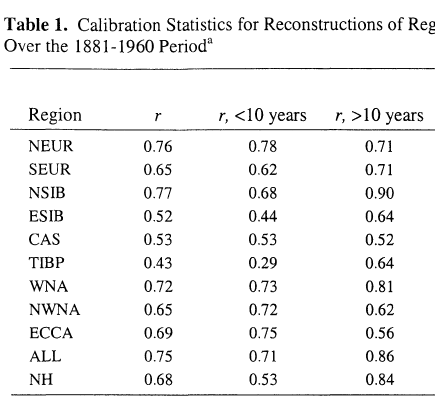
Briffa checked the correlations of these 9 reconstructions with regional temperature collations, describing the procedure as follows:
Each regional ABD MXD time series (See Figure 1) has been calibrated against an equivalent regional April-to-September mean temperature series, produced as an aggregate of the co-located instrumental surface anomalies (with respect to 1961-90 from land stations only [Jones et al 1999]). We used simple linear regression fitting the regression equations over the period 1881-1960 or over the total available period prior to 1960 when the instrumental record was shorter (see Table 1). The period after 1960 was not used to avoid bias in the regression coefficients that could be generated by an anomalous decline in tree density measurements over recent decades that is not forced by temperature Briffa et al Nature 391, 1998
Here is the table showing the claimed correlations between the regional ABD density reconstructions and regional Apr-Sept temperature.
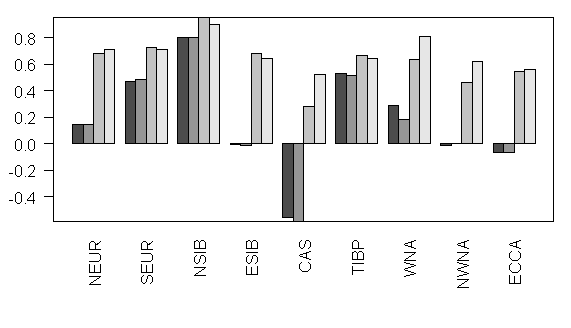
I then collated CRUTEM3 (and CRUTEM2) gridcell temperatures for the gridcells in the Briffa regions and calculated the Apr-Sept average over all the gridcells in each region and then calculated correlations both for the entire record and the 1880-1960 period (as in Briffa). The barplot below compares the reported Briffa values (on the right) for each of the 9 regions with my replications – far left – for full period; 2nd – 1880-1960 CRUTEM3; third – 1880-1960 – CRUTEM2. In all cases, the selected 1880-1960 yields a higher correlation than the full period – the 1880-1960 selection minimizes the effect of the Divergence Problem. In a couple of cases, I got much lower correlations than reported: CAS and TIBP. In the CAS region, the series were virtually uncorrelated over their full length, while Briffa reported a correlation of over 0.5.

Left- correlation with CRUTEM3 over entire period Apr-Sep; middle over 1880-1960; right – reported in Briffa et al 2001. This replaces an earlier version of the graphic.
The opportunism of the 1880-1960 period for “low-frequency” comparison is shown in the following figure. In 4 of 9 regions, low-frequency correlations are negative over the total period (due to Divergence). Briffa et al did not report these correlations, but only the correlations over the opportunistically chosen 1880-1960 period.


21 Comments
Steve,
There are some glitches in the code, so I cannot test this at the moment.
Function filter.combine.pad is missing
Line 20 is missing a .org, and needs to start with a double slash.
There is no object names jones
Function jonesinv is missing
#1. Sorry about that. I should have re-checked to ensure that I didn’t have local references. The script should be OK now. I’m puzzled by the discrepancy. It could come from using the updated HAdCRU3 data.
I’ve also checked to ensure that the regions are properly located with a plot of gridcells and compared it to the Briffa diagram in JGR. I’ve included script for that check (commented out), which needs the useful package fields.
I was very pleased, Steve M, to see your analysis of proxy correlations with updated temperature series. After all the recent commotion about using the most recent temperature series, my interest was renewed in seeing how these recent temperature time series changes (which your analyses showed can be sizeable) would affect the proxy correlations.
If, as it has been noted by posters at this blog, the proxies are constructed with overfit models, then nothing can be said about the integrity of the temperature series, since an overfit model can be fit to any temperature series, whether it is real or not ‘€” but not two significantly different ones, simultaneously.
If we start from the dendros’ viewpoint and accept the reconstructions as legitimate, then either the reconstructions or the temperature series have to be incorrect and one would think that the dendros would be having rather serious discussions with those people responsible for making these rather large temperature corrections. I would not think that the dendros or temperature series people, for that matter, can simply move on and ignore any significant discrepancies. If one moved on to producing newer reconstructions would one use the most recently modified temperature series or go back to the original ones?
I have to re-ask a previous question of mine: Do the various “official” temperature series vary by more than the uncertainty limits that are claimed for them would indicate.
Ken:
Couldn’t both the old and the new series be flawed, in which case the entire enterprise needs to be predicated upon an agreed upon series?
I think this comment sums it up pretty well. It’s always been the same, except for now. This assumes that the proxy is temp except that , now, with the best possible records and reconstructions, we can no longer match it.
Tough choice:
1. The proxy is invalid
2. The proxy is valid and the recent temp record is in invalid
What about correlating with radiosonde temps, available since 1958?
Re: #4
If one views the reconstructions as overfit, then the discrepancies say nothing about the legitimacy of any temperature series used. If one stands in the shoes of the people doing reconstructions with changing temperature series, they should either be, at least, somewhat concerned that these results indicate that the reconstructions were overfit or, if not, they must be very concerned about the legitimacy of the temperature changes and be publicizing that point.
If we have 37 professors very concerned that a popular TV program used out-of-date temperature series, I would think they would be even more concerned if the newer series showed significantly smaller correlations between reconstructions and temperatures. I think the 37 professors reacted quickly to the “Swindle” as advocates, while their reactions to deteriorating correlations with reconstructions will be in their science mode and much more deliberate and slow.
As I understand some of the Phil Jones correspondence with regard to Australia, Jones’ position is that the SSTs are used to force the models, so all this bickering about bias in land temps is not important. Did I get that right? Further, he says that he can’t match the land temps unless he uses the one-time bucket adjustment for SSTs.
Seems like the bucket adjustment is enormously important in this whole debate.
Seems like he’s more interested in forcing a validation of his model than accepting the validity of data.
Dear Steve,
Please verify your correlations.
I do not believe that they are correct.
Being reasonably experienced with using tree-ring from NW North America, I know for a fact that there is a stronger correlation with climate than your analysis infers.
Taking Keith’s NWNA series and undertaking a spatial correlation analysis over the 1881-1960 period for the April-September season, I get the following spatial plots for the CRUTEM2 and CRUTEM3 data-sets. They seem fairly similar to me with values in the range of what Keith published.
Rob
Same goes for NEUR
I’ll re-check them. I might add that my own first diagnosis of this sort of situation is that somewhere non-matching series have crept into the diagnosis and that would actually be my suspicion here. I posted up the script so that interested parties could verify. I’ll doublecheck
I think the point, Dr. Wilson, is that the work is unreplicable, not that their claims are incorrect. They haven’t archived the data and code used to generate their results, so now others have to guess at what they did. This practice is fine for academic pursuits, which dendroclimatology used to be, but we are talking now about a trillion-dollar policy problem. The bar of public policy accountability has been raised, and you folks seem to want things to go back the way they were in the 1960s-70s.
(Correctness also matters, however, so thanks for your contribution.)
I’m trying to reconcile things. I’ve compared the plots of the reconstructions in my matrix against the plots in Plate 2 of Briffa et al 2001 and they reconcile. I’ve collated regional averages from CRUTEM2 and compared them to regional averages from CRUTEM3. The two are collated in different ways – CRUTEM3 from a 72x36xtime NC object and CRUTEM2 from 2592xtime collation and the two regional temperature averages match to 4 9s in some cases, two 9s in all but one case. So I’ve got the right regions. The correlations to CRUTEM2 are no better.
I’ve asked Rob to send me the temperature data that he used.
I’m going to take this post offline in an hour or so if the differences are not reconciled and re-post it when I’ve done whatever reconciliation I can.
I’ve reconciled things and replaced the graphic here. As reconciled, there are some noticeable shortfalls, but more realistic than in the earlier graphic. The worst shortfalls are in Central Asia and the Tibetan Plateau. I’ve added a comparison of the reported low-frequency correlatiions, where the 1880-1960 is shown to be particularly opportunistic (the Divergence Problem)
bender,
They don’t want things to go completely back to the way they were in the 60’s and 70’s. I doubt you will find many who object to the increased funding they are getting these days.
It always comes down to the money, doesn’t it? In any case, if something’s not replicable, it’s not much use, is it.
Re #15
Steve M,
Your new graphic showing the correlation has four columns per locale but the caption reflects the three shown in the earlier version.
5:
LOL, in other words, when out-of-sample data are used and the correlation vanishes, it’s due to non-temperature effects, not overfitting. Could be, but I’m suspicious.
I’m not sure this is appropriate here, however it seems like it.
The latest I’m hearing on my blog from AGW supporters (admittedly not scientists) is that the GW signal is a .7 deg C rise since 1970. Which is unprecidented they tell me.
When I ask how this can be since I was under the impression that the correct number was .6 deg C for a century they say that is in fact correct but the .7 deg C number is also correct. I say OK then what caused the depression in the temperature record for the 1940 – 1970 period. The answer – sulfates.
I ask if sulfates depressed the numbers for a while and then they return to trend line isn’t it a bit much to claim the whole .7 deg C rise as caused by man made CO2? The answer is: no.
The contradictions are rising.
[snip – please stay more controlled]
I have a few of questions I want to briefly pose concerning dendrochronology and I thought this thread would be an appropriate place to do that.
Are there any reasons other than over fitting and random luck that a verification period would have a significantly smaller correlation of TRW and/or MDX with temperature than the correlation for the calibration period? I was thinking that if one could collect sufficient numbers of these correlation comparisons for the two periods and the verification period correlation came up significantly less than that for the calibration period would not this be strong evidence for over fitting? I do recall seeing the correlations for verification as being smaller than calibration for the published reconstructions I have read.
I am also aware that calibration and verification correlations could be data snooped, but if the researchers were unaware of the over fit results/indications they might be less likely to reject series with decent calibration correlations and a lesser calibration correlations.
A better test for over fit correlations would be to use out-of-sample results. I was thinking that the best way of performing this test would be to use the same trees used in previous reconstructions that have had some 20 plus years to grow and use the same correlation models used in the original calibration. Can trees, that were originally bored for TR analyses be re-bored later without concern for the first boring affecting later growth? Has this type of test been performed by dendros to test their models out-of-sample?