I observed the other day that Eli Rabett had done a bait-and-switch, in which Eli showed a picture of a well-located new station at Niwot Ridge (started only in 2003) as a supposed refutation of criticisms of incinerators, barbecues and tennis courts at USHCN stations. In response, Eli observed his right to “carrot pick”. Rosanne D’Arrigo once told an astonished NAS panel that you have to pick cherries if you want to make cherry pie and I guess the same applies to carrots.
However little Eli Rabbitt seems to have quickly retreated from the USHCN garden and decamped overseas, where his latest carrot pick is the De Bilt weather station in Holland, a site that is incinerator and barbecue free. The De Bilt station has moved a couple of times in the past century, but each move is relatively well-documented; there are photos not just of the current location but of the location in the 1930s and even the 19th century.
When I re-examined the De Bilt data, I was intrigued both by the size of the adjustment for a seemingly innocuous move of a couple hundred meters from a pagoda hut to a Stevenson hut and by the large discrepancy between the adjustments applied in 3 standard versions of the data. If the KNMi adjustment is “right”, then errors in the GISS and GHCN adjustments are up to 0.5 deg C in the 20th century and up to 1 deg C in the 19th century – extremely large errors in a well-studied site.
Anyone thinking about De Bilt needs to visit Hans Erren’s webpage , especially here where he has examined the De Bilt data from a variety of angles and I’m sure that Hans will correct any mis-steps here.
Let me re-state my view on these temperature series again: personally I have no doubt that temperatures are warmer today than in the 19th century. Are they warmer than the 11th century? I don’t know. Is it warmer now than the 1930s? Probably, but the size of the difference seems to depend to an alarming extent on adjustments. That’s not to say that the adjustments are wrong, but, if one is going to rely on specific estimates of the difference, one needs to understand the nitty-gritty of the adjustments that underpin the conclusion and why the adjustments are so different between KNMI, GISS and GHCN.
The “De Bilt” series begins in 1706, but is a splice of measurements taken in 5 different locations: Delft/Rijnsburg (1706-1734), Zwanenburg (1735-1800 & 1811-1848), Haarlem (1801-1810) and Utrecht (1849-1897) reduced to De Bilt and De Bilt (1898-present).
So far I have identified six different versions of the “De Bilt” series: GISS raw, GISS adjusted, GHCN raw, GHCN adjusted, KNMI and Labrijn (the latter emailed to me by Hans, who obtained it from the authors.) GHCN raw and Labrijn are the only versions that go back to 1706; the two GISS versions begin in 1881; the GHCN adjusted version in 1851 and the KNMI version in 1901. Four versions extend up-to-date, but the GHCN adjusted ends in 1991 for some inexplicable reason and the Labrijn version in 2000. The Labrijn and KNMI versions are pretty much identical for their period of overlap (1901-2000) and the GHCN and GISS raw versions are essentially identical for their period of overlap (1881-2006).
The 1950 Station Move
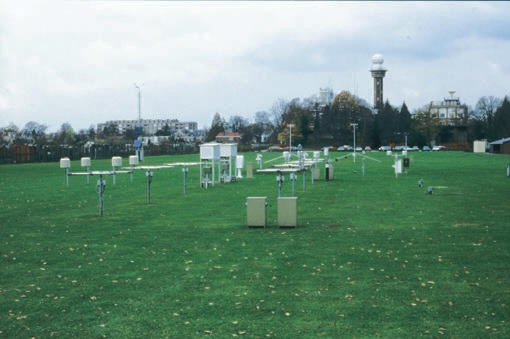
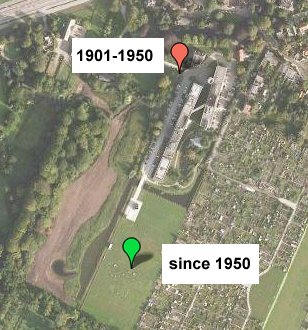
De Bilt metadata is discussed here which includes some interesting pictures (see also pictures at other Dutch sites). In the late 19th century, the station was at Utrecht, not De Bilt, moving in 1898 from Utrecht to the De Bilt “pagoda hut”, shown in the picture (top left below). In 1950, the station was moved again, this time several hundred meters away (see bottom left map from Hans Erren) and re-located in a Stevenson hut (see top right picture – this is the figure from Eli Rabett.) In 1993, an electric sensor replaced the thermometer. The adjustments are shown in bottom right and are discussed below the pictures.
 |
 |
 |
 |
Bottom right: Adjustments from GISS-GHCN raw data. GISS-GHCN version minus 4 versions.
This seemingly innocent move of a few hundred meters at the same elevation from one responsible scientific observation location to another resulted in a measurement discontinuity estimated by KNMI as approximately 1 deg C. Hans Erren has a similar estimate. Both estimates are obtained by comparing the De Bilt series over this period with nearby stations e.g. Uccle which did not move at this time – a strategy similar to that of the USHCN Station Adjustment Program.
To keep this in perspective, this “inhomogeneity” incurred by this move of a few hundred meters is substantially more than the entire amount of global warming experienced to date. So when people are thinking in terms of signal and noise, here’s an example of the type of “noise” that is introduced by a seemingly innocuous station move. So a move from the roof top of the Boulder fire station to the NIST building may well introduce a discontinuity as well. If all your stations have discontinuities, the estimation process would appear to become very formidable very quickly. There is some recent literature on these sort of adjustments, but the entire topic bears examination by third-party statisticians of Wegman calibre.
Now let’s look at the differences that arise from different adjustment schemes. See bottom right above. The KNMI and Labrijn already appear to contain an adjustment for the move from the pagoda hut. I presume that the online KNMI version derives in some way from the Labrijn version as these are essentially the same. Hans Erren has his own proposed adjustments shown here , which is in the same “family” as the other Dutch adjustments. A caveat here : my calculation of the GISS adjustment differs somewhat from Hans’ (we’ll probably try to reconcile calculations at some point) although the shapes are similar; and Hans’ figure does not include the GHCN adjustment version.
As noted above, the station moved from Zwanenburg to Utrecht in 1849 and from Utrecht to the De Bilt pagoda hut in 1898. In the 19th century when the station was located in Utrecht, the GHCN adjustment is very different than the KNMI adjustment, with the GHCN adjustment up to 1 deg C larger. It’s hard to understand why the GHCN adjustment should be so much larger. Also the GHCN adjustment becomes effective in little steps, while KNMI has a 1 deg C adjustment in 1950. GHCN and GISS both implement changes in a series of small steps, while KNMI has one large step in 1950. It’s curious that the move from the pagoda hut to the Stevenson hut occasioned a big adjustment, but the move from Utrecht to De Bilt didn’t trigger any change in the KNMI-Labrijn version. Also that the Huis Zwanenburg site, pictures by Hans Erren here had no material adjustment relative to the Stevenson hut.
So even in a relatively well-controlled series we’re talking substantial adjustments. If one views the adjustment as a statistical estimate, then how does one estimate the error distribution? In a trivial sense, the GHCN, GISS and KNMI adjustments cannot all be correct and, if either of the GHCN or KNMI adjustments is “correct”, then the error in the other one is about 1 deg C, an amount that seems very high in a well-measured instrumental site for a period that isn’t long ago. Even in the 20th century, adjustment errors of about 0.5 deg C are necessarily occurring in at least one of the series.
I haven’t waded through GHCN and GISS adjustment methodologies to see exactly what they are doing and am nowhere near to replicating their methodologies. (Wouldn’t it be nice if they just posted their codes so one could see exactly what they were doing, instead of having to decode obscure and poorly written methodological descriptions?) But let’s say that the KNMI adjustments are “right” and that the GISS and GHCN adjustments are “wrong” in this spot check. Then that would appear to indicate that the GHCN and GISS methodologies were wrong in some way and there would be no reason to assume that they were randomly wrong.
Update: Eli Rabett observed that another description of the adjustments, additional to the link that I provided above, is here and states that:
Corrections have been made for:
– relocation combined with a transition of large open hut to a wooden Stevenson screen (September 1950).
– relocation of the Stevenson screen (August 1951).
– lowering of Stevenson screen from 2.2 m to 1.5 m (June 1961).
– transition of artificial ventilated Stevenson screen to the current KNMI round-plated screen (June 1993).
– warming trend of 0.11°C per century caused by urban warming.Please note the following:
– the transition of the wooden Stevenson to a PVC Stevenson screen (August 1980) did not have a noticeable effect on the daily mean temperatures; consequently no corrections had to be applied.
– from 1951 onwards, KNMI shifted from so-called climatological temperature measurements to synoptical measurements. However, the climatological measurements continued to 1970. For the 1951-1970 period these measurements may be considered as more reliable than the synoptical measurements. Therefore, in the homogenized series the climatological measurements extend to 1970.
the present version of the series may change as soon as new results come available from the efforts of KNMI to homogenize the temperature series of De Bilt on a daily base, taking into account weather-dependent corrections.
There is nothing in this that is inconsistent with the above commentary. The 1950 relocation from the “large open hut” is the relocation from the “pagoda hut” described above, which yielded an adjustment of 1 deg C. I’m not objecting or arguing about this adjustment, merely observing that the changes as documented are not large and still yield an effect larger than observed global warming in the past century – something that has to be considered in signal-noise statistics when one is dealing with estimation of undocumented station changes.
Second, Eli has not commented on the discrepancy between GISS and GHCN adjustments and the KNMI results. So while the additional reference is interesting and further documents the points that I made above, it does not contradict them. Eli has simply thrown up a diversion as though it were an academic comment.


50 Comments
One seeming difference encompassed by those few hundred meters, if one can fairly judge from the bottom left photo, is a change from trees to no trees. From what I’ve read, relatively modest occlusions of the horizon can impose quite a noticeable bias in measured temperatures. Maybe the tree problem is what the pagoda hut (presuming that’s the tower) was built to overcome.
Would be nice if you let Eli’s comments through
Eli (#2), are you suggesting that SteveM is censoring your comments? I’d be surprised if that were true; SteveM is generally very respectful of free and open debate.
In any case, if you have an intelligent response to what SteveM has reported, why not post it on your blog and let us read it there? 😉
Looks like good old Howard U isn’t giving their chemistry faculty enough to do, unless carpet bombing the climate blogs 24/7 with nonsense is in their job description. With his latest, Professor Joshua Halpern seems to have raised the white flag in any case.
More on point, those interested in science rather than snarks (not Dr. Josh, and not me in this comment) will find some interesting reading here about the surf temp record, though heavy lifting is required:
Click to access R-321.pdf
#2. Eli, obviously your comments are let through or you wouldn’t be reading it. They may not appear instantaneously. If you look at the bottom of the post, you’ll see a message:
This is regrettable but we’re forced to manage service a little differently than we would like to avoid crashing within the constraints of the server budget. As you notice, this blog gets a lot of comments and we’ve even given your blog a little traffic boost. So if you can hold your horses for a little while, the comments will show up.
Also the inclusion of urls will trigger the spam filter for posters with short histories here. Your posts with urls need me to manually approve, so recognize that anything with a url in it will have to wait for me to pick it up until you have longer history here.
Eli merely notes that several of his responses have not appeared. It is uninteresting why. Clearly there is some problem over here. However, TAC had an excellent suggestion although you are always welcome
#6.
As far as I know, this is untrue. I am unaware of any of your comments that have not appeared here. I checked the spam filter are there are none there. I haven’t censored any. I’ve got a long track record of not censoring people as others will vouch for. I count 4 posts from you on June 6, 3 on June 5 and 2 on June 4. So you’re posting here a lot for someone whose posts are supposedly not appearing here. Please advise me which post hasn’t appeared. The post that you claim at your blog as being censored: is posted here http://www.climateaudit.org/?p=1640#comment-112891 despite your claim. Again please note that there is a delay due to caching, but please do not extrapolate a 15 minute delay that you have notice of to the conclusion that your comment has been censored (which it hasn’t been.)
BTW are you going to withdraw your fabricated claim that I “caused a denial of service” to other users at GISS?
Eli Rabett observed that another description of the adjustments, additional to the link that I provided above, is here and states that:
There is nothing in this that is inconsistent with my previous commentary. The 1950 relocation from the “large open hut” is the relocation from the “pagoda hut” described above, which yielded an adjustment of 1 deg C. I’m not objecting or arguing about this adjustment, merely observing that the changes as documented are not large and still yield an effect larger than observed global warming in the past century – something that has to be considered in signal-noise statistics when one is dealing with estimation of undocumented station changes.
Second, Eli has not commented on the discrepancy between GISS and GHCN adjustments and the KNMI results, the main results above. The references to KNMI literature are not going to resolve this discrepancy. His comment is simply a diversion, whereupon Eli scurried back into his little rabbit-hole.
I’m flattered.
Raw (non-homogeneous) daily data for De Bilt are here in zipped batches of 10 years:
http://www.knmi.nl/klimatologie/daggegevens/download.cgi
monthly data:
http://www.knmi.nl/klimatologie/maandgegevens/index.html
see here for unadjusted pre 1900 data:
http://www.knmi.nl/klimatologie/daggegevens/antieke_wrn/index.html
I haven’t compared them with van Engelen and Nellestijn:
http://www.knmi.nl/klimatologie/daggegevens/antieke_wrn/labrijn_ea.zip
Small remark, Uccle also has a jump in 1950, as reported by Sneyers. I initially compared both with Fichtelberg. Hohenpeissenberg confirms these corrections as “very likely”.
VanEngelen & Nellestijn did not adjust for UHI.
Hello,
Is it warmer today than in 1930? Is it warmer than in 1200? Probably not. Not for Central Europe! The Winters were a bit hotter
the last 100 Years, but the summers of the last 100 years were colder than around 1200:
There was a winter with 2 frostday, winters with thunderstorms in January an treeblossom in January. There were very hot
and dry, an very hot and wet summers around 1200. And how was the suns activity at that time?
What was different during the little iceage? The summers were also hot, but above all, the winters were cold!
What is different today? The winters are warm! Why? The sun? I think we can say YESSSSSS!
Is it surprising, that summers become as warm as around 1200, when the suns activity is MUCH HIGHER today? NO!
What do the pollen from a lake in Turkey (Val) tell us about the climate of the last 10000 Years?
Click to access 10_Lake_Van_Drilling_Project_SD4.pdf
Here is THE GRAPHIC of the climate of the last 10000 years:
It was warmer most of the time!
Best regards
Edouard
Interesting times:
I just found in http://climexp.knmi.nl/KNMIData the Brandsma homogenisation for the De Bilt locations (1901-present)
Ascii monthly text file:
http://climexp.knmi.nl/KNMIData/BiltTg19012002.month.txt
The official homogenisation:
http://climexp.knmi.nl/KNMIData/Tdebilt_hom.dat
The version can of worms is wide open.
I’m probably beeing a bit naive here- not being a meteorologist. However there does seem, to my mind at least, to be a simple means of moving a monitoring station (short distances at least, like the De Bilt move) and not have to make opaque “adjustments” of the type that are being discussed. Why not simply leave the old station in place for a couple of years and cross reference with the new? That way any adjustment would be supported by real world data.
Diurnal differences are also worthwile to investigate. Zugspitze and Hohenpeissenberg are two german high-quality alpine sites approximately 50km apart:
Re: #12 Don Keiller,
It might cost a little more but I have to agree with you.
I have to suppose that since they were only interested in local weather there was no concern about discontinuities in time trends.
But that was then, what about now?
So long as Eli/Professor Halpern chooses to tell lies, why not share some truths from the public record?
http://www.chem.howard.edu/~jhalpern/index.html
Like the fact that the good Professor Halpern is paid by NASA under the Space Grant Consortium Program, run out of Goddard (as is NASA GISS, home of one very famous climatologist) which might explain Dr. Halpern’s affinity for defending all things Hansen.
Should the good professor continue to decide not to correct his factual, er, ahem, misstatements about you, surely the Howard University provost office might like to hear that one of their esteemed professors is using his time (my how he uses it) to libel and slander others online.
http://www.provost.howard.edu/
Richard A. English, Ph.D.
renglish@howard.edu
Another truth from the public record is that Dr. Halpern appears to have completely abandoned his academic career in favor of the rabbit suit and internet libel. From his own web page he has not published a scientific paper in 3 years and not lead authored anything in 10. Too bad blog comments aren’t yet accepted on CVs.
http://www.chem.howard.edu/~jhalpern/publications.html
The bait, switch, and ad hominem are all he’s got. Your best response is simply the truth.
RE#4,#15
At least he cares about teaching his students.
http://ratemyprofessors.com/ShowRatings.jsp?tid=543236
RE#16
Ouch!
Elmer
if your are correct, you must have frightend Eli Rabett to death, or why is his homepage not showing up again?
Anyway, if you google Halpern and Nasa you get this
Wait, wait, wait…
I’m slow on the uptake here.
Eli Rabett = Professor Halpern ?!
Is this important? Is this slipping into an ad hominen discussion?
(If it is I’ve got some dirt on Elmer’s glue)
I agree that before discontinuing an old climate station that data should be collected simultaneously from the old and new sites, for validation purposes, for periods up to 5 years. The same principle should apply to any significant change in data retrieval methods from the same sites.
This is interesting. So ‘Eli Rabett’ really is a “scientist?”
All this time I’d assumed from the quality of his comments that he was a low level clerk paid by an environmentalist lobby to spam climate sites that didn’t toe the official IPCC line.
I am not sure keeping the old station for calibration is a good idea.
Why is the station moved? Is the quality of the new site better or will the quality of the old site worsen in the near future, for instance because of building activity? Using the old site for calibration will reduce the quality of the new site in these circumstances.
So using the old site for calibration is only ok when the quality of the old site is better than the quality of the new site. If so, why move it?
#15
Elmer: Can you say how you linked Prof Halpern and Eli?
Bernie says that anybody who constantly refers to themselves in the third person as Eli does has some
serious issues. Bernie also notes that the student comments tend to bear this out.
Who else recently demonstrated this amazing psychological aberration? Was it Kerry – or was his psychological tell the “royal we”?
#21
I am not an expert but if you are going to keep the data from the old site then you need to have some way of verifying (not calibrating) that the adjustments to the old data are reasonable. The overlapping data acts as test data for the adjustments. Presumably the new site data will be defined as the “good” data because the new site meets the guidelines, while the old site data will be adjusted. Even if the new site is poor the overlapping sets of data provide a way of analyzing what adjustments were actually made to what.
Or have I misunderstood your point?
Either way your question raises a key general issue in any adjustment procedure. Alas unravelling what was done and why to the thousand or so series is almost impossible if the site locations are not known – then we cannot replicate. Where this gets tricky is if the reference sites for the adjustment are also subject to adjustment, then its round and round we go
Bernie has some issues.
Empirical estimation of the effect of urban heat advection on the temperature series of De Bilt (The Netherlands) 2003
by T. Brandsma (KNMI), G.P. Können (KNMI), H.R.A. Wessels (),
http://www.knmi.nl/publications/showAbstract.php?id=518
Abstract
The influence of urban heat advection on the temperature time series of the Dutch GCOS station De Bilt has been studied empirically by comparing the hourly meteorological observations (1993-2000) with those of the nearby (7.5 km) rural station at Soesterberg. Station De Bilt is in the transition zone (TZ) between the urban and rural area, being surrounded by three towns, Utrecht, De Bilt and Zeist. The dependence of the hourly temperature differences between De Bilt and Soesterberg on wind direction has been examined as a function of season, day- and night-time hours and cloud amount. Strong dependence on wind direction was apparent for clear nights, with the greatest effects (up to 1 °C on average) for wind coming from the towns. The magnitude of the effect decreased with increasing cloudiness. The analysis suggests that most of the structure in the wind direction dependence is caused by urban heat advection to the measuring site in De Bilt. The urban heat advection is studied in more detail with an additive statistical model. Because the urban areas around the site expanded in the past century, urban heat advection trends contaminate the long-term trends in the temperature series (1897-present) of De Bilt. Based on the present work, we estimate that this effect may have raised the annual mean temperatures of De Bilt by 0.10 ⯠0.06 °C during the 20th century, being almost the full value of the present-day urban heat advection. The 0.10 ⯠0.06 °C rise due to urban heat advection corresponds to about 10% of the observed temperature rise of about 1.0 °C in the last century.
25: So?
25: wilde hare: yes he does!
Eli is at the beach, but if you are interested in the difference between the GHCN and GISS adjustments, a useful place to start would be http://pubs.giss.nasa.gov/docs/1999/1999_Hansen_etal.pdf which explains their methods of homogenization. The conclusion
Peterson is the GHCN. GHCN has recently moved away from First Difference itself.
http://www.ncdc.noaa.gov/oa/climate/research/ghcn/ghcngrid.html
GISS does not compute anomalies for individual stations, but for grid points.
As the Rabett briefly remarked to Hans Erren at his place, GISS’s method is designed for assigning temperatures to the grid points, not for optimal individual records
Left out the most important paragraph for this discussion from the Hansen, Sate, et al paper
The de Bilt homogenizations probably yield the best record for de Bilt. GISS loses local information by including information from stations within some range (1200 km) for homogenization, which is better for a global set.
You now have information and pointers to the homogenization methods used by all parties, their reasons for doing this and their understanding of the strengths and weaknesses of each.
So there
In the De Bilt case, all we know for sure is that the GISS and GHCN adjustments probably lead to bad adjustments at De Bilt.
You say that the GISS or GHCN methods are “better” for gridcells. I don’t see any proof of this. It’s asserted, but is this merely a cop-out to avoid being held to account? How do you know that it’s “better” for gridcells? The authors have not cited any known statistical authorities, where these claims are proven in a proper way, but merely, as so often in climate science, cited their own prior publications, undoubtedly containing other home made recipes. Do you have any evidence that the GHCN adjustment method works “better” for gridcells, as opposed to the evidence in hand that it yields screwed up results for De Bilt?
It’s not just De Bilt. Rob Wilson had to completely discard GHCN adjusted data in his Yukon tree ring studies because it was so screwed up in the adjustments.
If your objective is to calculate gridcell values, you can do your averaging at that stage. Why would you create a lot of distorted station records as intermediates in the calculation?
Whether the methods are replicable from this description is another question. We’ve had an ongoing project here, in which a couple of statistics post-docs have participated, trying to replicate MBH99 confidence interval calculations. No one has any idea how that was done (nor does von Storch have any idea). Maybe you can explain this to us as well.
Yes Eli, I agree the people in De Bilt are doing a wonderful job, It’s just that this
local knowledge is not used by GISS. To make things worse: the GISS “homogenisation” adds a warming trend to De Bilt!
Same for Uccle, same for Hohenpeissenberg, to name just three well maintained stations. Jones keeps it simple: he just truncates De Bilt after 1950.
GISS needs urgently to review their homogenisation method.
Conclusion: GISS can’t handle station moves.
Re #13
Wolfgang, diurnal range is calculated as the mean of min and max temps over a period such as a day. Minimum temperatures generally occur in the daytime as do the maximum. Hence the diurnal metric as calculated shows daytime variation and not diurnal variation.
I don’t know why you are interested in diurnal variation, but I’d suggest you use time based data rather than the min max difference.
Hello Mynheer Erren,
I’m also from Europe 😉
Maybe Hansen (and Co) compare their station data with the satellite data? Like in this link:
Or how do they get such a perfect correlation with Satellite temps?
Best regards (I’m from Luxemburg 😉
Ciao
Edouard
#34
Good question. Do you have an answer? I assume the surface temperature includes corrections?
RE: #15 – A prominent faction at NASA, its contractors and adjuncts, feature prominently in the current “killer AGW” hysteria. The dynamics which have led to this are the same ones which led to deemphasis on manned missions of extra orbital exploration earlier. The “there is too much human suffering and dire environmental problems to be able to continue to justify manned exploration” crowd got the ear of Nixon and ever since, NASA has been off track. Interesting how recently, with the change in management, there was hope of renewal, but lo and behold, the usual suspects are working overtime to undermine any new course or action. Pathetic …..
A final comment regarding Dr. Halpern then I’ll leave things to the Universe …. while there is no doubt that the core AGW group are a diverse bunch, I do find it unsurprising that Halpern is someone who came of age during the 1960s and was entering the rapid growth phase of his career at about the same time as the Malthus inspired “Soylent Green,” the establishment of the EPA, and all sorts of other “eco” centric things. The timbre of those times, which I can recall as well since I was just old enough to be aware of social things, swept up many. The ecology “e” stickers, the nascent fascination with recycling, the establishment of environmental law firms, etc. Exciting times to be sure. Times which left an imprint on me. Even in my own “reformed” state I still would be classified as an environmentalist. Some of us evolved beyond the “ecotopian” perspective, especially from the mid 1980s onward, and some of us did not.
Re: #34 Edouard,
I guess it depends upon your definition of “perfect”.
In the “Tropical lower troposphere and surface anomalies wrt 1981-1990” graph you linked, it looks like the UAH data starts at ~0.0°C (anomaly) and ends at ~+0.3°C. A delta delta of ~+0.3°C. The “Surface” data starts at ~-0.2°C and ends at ~+0.4°C a delta delta of ~+0.7°C.
But let’s say they did correlate “perfectly”. This would mean the lower troposphere and the surface warmed in the same way at exactly the same time. If this were so, how could one claim that the warming was caused by the anthropogenicly enhanced “greenhouse” effect, when the anthropogenicly enhanced “greenhouse” effect has the surface lagging behind the troposphere which is supposedly being warmed by the increased IR capture?
If however, it was the surface that was warming first then the increased heat flux to the heat sink in space would be expected to perfectly correlate the warming of the surface air and the tropospheric air.
Hmmm. How can one get around this inconvenient circumstance?
Well one could claim that the troposphere measurement is wrong and invent your own and call it something like RS 5.
#24
Eli
Bernie says he doesn’t and you may not, but speaking in the third person is associated with certain mental health problems. If the literary allusion is to Samuel Beckett, then I rest my case. – oops, Bernie rests his case.
#34 Edouard
I assumed that the satellite temperature measures were independent of the other temperature measures. However, I noticed that there appears to be an chnage in the relationship between surface and HadAT2 at just about the time the satellite measures became available, i.e., 1978. Is this a coincidence or are HadAT2 adjustments reflective of satellite data? Perhaps you can provide a table of the correlations between all 4 measures.
Quick, gentlemen! They’ve learned a lot of our measurements are contaminated by man-made features around the thermometers! They’ve also learned two stations that are a mile away are counted the same as ones that are a few hundred miles! We must take action now, before our house of cards falls apart. We had thought when we moved stations that not keeping the old one running would hide this forever, besides just hiding our records and statistical methods and models with well thought out excuses, illogic and bluster, but now they’re realizing the measurements could be off by .4 to 1.6 degrees! What shall we do? We need more obfuscation methods ASAP!
But please, be very quiet about this.
for completeness, several sources compared:
I have to stick up for whomever that ratemyprofessor dude is. If you teach or instruct, and all you get is 5 people complaining about you, you can’t be too bad at it. There’s always somebody telling you how horrible you are. 5 disgruntled friends for example.
Anyway.
@38 @40
Hello one more time,
Unfortunately I am a layman. I was very surprised, that the chaotic surface temperature records could correlate with the very precise sattelite records. If the dendroclimatic and paleoclimatic records would correlate in such a perfect way, it would be possible to reconstruct past temperatures and THE climate.
Sometimes it seems to me, that dendroclimatic records show the exact opposite of the surface records. But eventually the pollen records are a better source of climate data.
On the graphic http://www.metoffice.gov.uk/research/hadleycentre/CR_data/Monthly/upper_air_temps.gif you can see, that all the peaks in temperature take place at the same time. One would think, that the global surface temperature records really represent the amount of heat gathered by the atmosphere.
I wondered if these surface records are adjusted to the satellite data or if they are raw data. If they are not adjusted, it might be that this means that it is exactly what Steve McIntyre explained in post Nr 30 http://www.climateaudit.org/?p=1650#comment-113528 “You say that the GISS or GHCN methods are “better” for gridcells”. Please excuse my bad english. Maybe I sometimes don’t really understand, what is written here.
I just thought, that these adjustments are perhaps done to make the global temperatures fit to the géobal warming graphics, or in my example to the satellite temps. I wondered if the surface records really show the exact peaks of the satellite records. If they do, they must be valid in some way, even if the divergence between some satellite records and the surface remains to be a problem.
What I also want to say, is that the adjustments MUST all be done by people working in the area, who collect every important information, and can perhaps even tell how warm it really has become the last 30 to 70 years, because they lived there. Important information, like the one written in old books, who say for example, that the winter had only 2 frost days, MUST be more important, than dendro data telling us, that the winter was cold. In such a case dendro data MUST mean nothing and only the real world experience of the people of that time, must be taken into account. The vikings setteling in greenland for example show us how warm it really was at that time. No dendro data should be able to erase or flatten those historic records of the climate.
I think, that this is very important to get a real idea of the past climate.
I’m sorry if I disturb your professional statistic discussions by the obscure ideas of a layman. I thought this was important.
Best regards
Edouard from L.
Aart Labrijn reduced the Utrecht observations to De Bilt in his PhD thesis in 1945. I don’t know what the source is of the GISS 1850-1950 series.
ref:
A van Engelen and Nellestijn, JW, 1996, Monthly, seasonal and annual means of air temperature in tenths of centigrades in De Bilt, Netherlands, 1706-1995. KNMI report from the Climatological Services Branch
A. Labrijn, 1945, Het klimaat van Nederland gedurende de laatste twee en een halve eeuw, Mededelingen en Verhandelingen nr. 49, KNMI publ. 102.
Hans:
Can you say a little more about what we are looking at in your Labrijn graphics and what your conclusions are?
#33
Philip B,
well, I’m neither a native speaker nor a meteorologist – just interested in science. According to this page “Diurnal Temperature Variation is the change in temperature between the warmest and coolest parts of the day”.
So I should have captioned the graph “Diurnal Temperature Variation (Annual Mean)”, or am I mistaken again?
Wolfgang, I’m not a meteorologist either. My point was that people assume that diurnal variation represents the difference between daytime and nighttime temperatures. It doesn’t. It’s really just a measure of daytime temperature variation (on most days).
Wolfgang, the analysis of Australian weather data here (you will have to scroll down to see analysis of individual sites) shows that for most sites diurnal range is increasing measured by time based data, but this is not showing up in max – min temperature because minimum temperatures are rising in line with maximum temperatures.
Increased daytime warming is reducing the last bit of cooling in the early morning which normally results in the minimum temperature for the day.
It seems mean temperature is showing increased daytime warming, but not compensating increased nighttime cooling. Which begs the question, how much warming would we see if time based data were used.
Aryan van Engelen wrote to me on 23 August 2005:
The source of GHCN De Bilt is the World Weather Records. From this undiscimiately data are extracted without considering metadata. For De Bilt this results in a mix of daily averages which are calculated either from 3 daily observations or from hourly observations.
A search on “World Weather Records”, yielded the following remarkable quote on the Deutsche Wetterdienst site.
http://www.dwd.de/de/FundE/Klima/KLIS/daten/online/wwr/index.htm
On a meeting of the WMO-Commission for Basic Systems Task Group on the Internet 2-4 February 1998 in Wellington, New Zealand was agreed that the World Weather Records would be available in the internet.
Therefore all WWR starting 1951 are published in the internet.
I tried http://www.ncdc.noaa.gov/oa/wdc/index.php but got a time-out.
One Trackback
[…] De Bilt Adjustments […]