It’s interesting that different statistics gathering services record different results for the same measured quantity – in this case the answer to the question “how many people browse to Climate Audit?”.
Thus we have two different results for two methods. The first is using WordPress.com to measure the number of visitors (which uses a plug-in to insert a small piece of Javascript into the front page and every article).
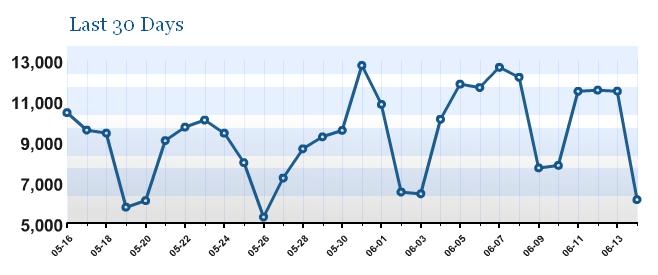
Ignoring the last data point, which is just the cumulative total for the part of the day when I captured the picture, you can see that CA averages 9,000-12,000 during weekdays falling to 6,000-8,000 on weekends.
Next Google Analytics, which is a fairly comprehensive package of almost everything you would want to know about who is visiting your website, where they are, which OS and browser they’re using, whether they dress to the left or right etc. This service produces many reports on this and many other things. I discovered that we have a single visitor from Greenland and some rather assiduous readers on the island of Jersey.
Google Analytics also uses a piece of Javascript which is embedded in the front page.

The difference between them I can only ascribe to the caching used on the site. According to Google Analytics, the average time spent on the site is of the order of 4 minutes at a time, which is much less than the cache takes to expire. So of Google does not take account of caching and WordPress.com does, then it might explain the discrepancy.
I’ve no doubt that another method like Alexa would yield a different result again. Real world statistics gathering is not an exact science, not even for websites.
For more on what Google Analytics reports look like, I have archived the overall report, as well as the reports on Canada and the United States.


11 Comments
I would bet that they aren’t measuring the same thing. The WordPress plugin counts every page view. If one person visited you site and clicked refresh 9000 times, it would show 9000 on it’s graph. I imagine that Google Analytics is attempting to show you an estimated number of visitors. In this case, if one person visited your site and clicked refresh 9000 times, it would only show up as one visitor. By using both of them, you can get a rough idea of how many pages each visitor views.
Just wanna say that here is pictures of 4 inch snow in the middle of Sweden 14th of June 2007 (yesterday):
http://www.svd.se/dynamiskt/inrikes/did_15805049.asp
http://www.dn.se/DNet/jsp/polopoly.jsp?d=147&a=661040
http://aftonbladet.se/vss/vader/story/0,2789,1094730,00.html
Best greetings from Swe-d-d-d-deden; Ouch! It’s so c-c-c-cold!
“…whether they dress to the left or right…”
The wonders of modern technology!
Is this cross-correlated with boxers/briefs?
Seriously, I’m somewhat surprised to see the traffic fall so much on weekends. Does this indicate that folks are browsing while at work?
Yes. People are browsing CA from work.
John A, Weren’t blogs invented to give government workers something to do?
I thought that was either climate modelling or the International Space Station..
Let’s not boast too much, just a little. 😉 By the same Google Analytics PDF, The Reference Frame has 30% more visits, 250% more fully unique visitors, 10% more pageviews, and smaller time – because articles don’t have any “read more”. 😉
Click to access google-analytics.pdf
Statcounter lets you put invisible code on every single page, for free. That would probably be your best best to get the true numbers, and stuff like unique visitors and returning etc. The free version keeps very detailed information on only the last 100 visitors, but the stats for everything tracks it all — country, browser, OS, how long they stayed on each page, etc.
I wish more people would browse this site so that parasitic entities like http://climatecounts.org/index.php don’t have such fertile ground to grow in.
I interrupt normal programming to announce that I have received answers to questions, generated in discussion at the ClimateAudit blog, directed to D.E. Parker concerning his study on the Urban Heat Island effect, and its effect (or lack thereof) on the perception of global warming through land-based temperature measurements.
You can find his responses at:
http://www.climateaudit.org/?p=1718#comment-119294 ,
starting at entry #386.
BTW, there’s no need to use multiple statcounters. One good one is certainly sufficient. The Google Analytics tools provide page views, site visits and a lot more.
And Lubos, I wouldn’t boast too much about your relative site stats. If anything is learned from the CA experience, it ought to be the importance of understanding the meaning of the measures… ;). By comparison to CA, the Reference Frame has more people stopping by, but they tend to visit for a brief moment and never return.
The fact that the average CA visitor stays for almost five minutes, and 80 percent are repeat visitors, tells me that this site provides real value to visitors.