Max Berkelhammer, a student of Lowell Stott ( a prominent and excellent researcher on ocean sediments) has been carrying out research on dO18 content of bristlecones in the White Mountains. His website shows that he has an article on this research that has been accepted for G3 and CA readers should pay attention to this article when it comes out.
His website has a number of interesting conference presentations on dO18 in bristlecone, from which today’s note is drawn. dO18 levels in White Mt bristlecones changed remarkably at the start of the 20th century.
This is entirely new and important data and their interpretation is highly interesting.
First here is a figure from Berkelhammer’s PACLIM 2007 presentation online here, showing dO18 levels from 2 different bristlecone pines – showing a remarkable change in dO18 levels of about 30 from 1700-1850 to levels of under 20 in the 20th century, with the change taking place between 1850 and 1915.
Berkelhammer and Stott PACLIM Figure 2: Measured δ18O values of Bristlecone Pine cellulose; shown in black are annual values for two cores taken from trees in the same grove. The cores have excellent correlation with an R2 value of 0.82. The red line is the mean of the two cores. The shaded region (1855-1910) is used to highlight the major transition that separates the pre-1850 values from the twentieth century values. The data has an analytical uncertainty of 0.3 (VSMOW).
They observe similar changes in dO18 levels in two other proxies, with the figure below showing the bristlecone Pine δ18O compared to Santa Barbara Basin Benthic δ13C (Holsten et al. 2004) which they note as being interpreted as an upwelling proxy – a topic that we’ve visited in connection with the Arabian Sea – and Walker Lake (Sierra Nevada) δ18O (Yuan et al. 2006), which was interpreted as a lake level proxy.
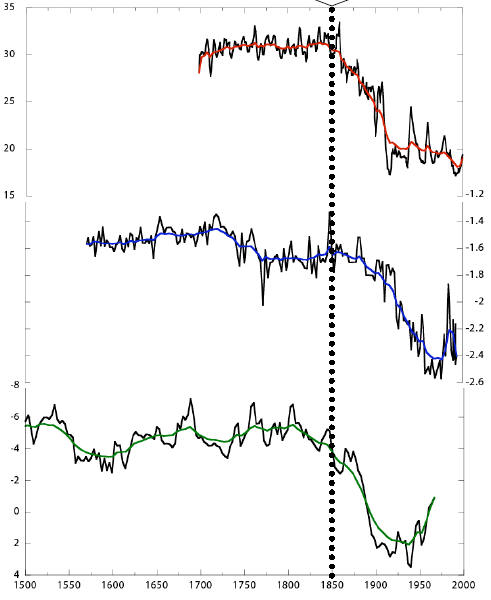
From Berkalhammer and Stott PACLIM.
To these examples, I would also add the dO18 results from the Yukon, where Fisher et al (discussed previously) reported a substantial change in dO18 levels at Mount Logan ice core and Jellybean Lake sediments, as illustrated below. Fisher et al concluded that there had been a regime change in which atmospheric circulation had been re-oriented.
(Note that the missing Thompson Bona-Churchill ice core data can be projected to be similar to the Mount Logan results – had the dO18 levels gone up, one would have expected the results to have been available for IPCC AR4 and Al Gore’s hockey stick. As matters presently stand, if lower dO18 in Yukon ice cores are attributable to changes in atmospheric circulation, one wonders how one can confidently ascribe higher dO18 values in Himalayan ice cores to global warming as opposed to changes in atmospheric circulation.)
In any event, the change in bristlecone dO18 is not isolated – and may well be related to contemporary changes recorded in other proxies. Berkalhammer and Stott then consider how such a change in dO18 could occur. They conclude that the magnitude of the isotopic shift (over 10) could plausibly be explained only by a change in provenance of moisture:
Humidity could only account for a fraction of the isotopic variability (~1.5) Magnitude of isotopic shift exceeds shallow/deep water isotopic gradient (Tang and Feng, 2001) Data from individual storms during a winter season shows difference between North Pacific storms (~-11 ) and Pineapple Express storm (~-2.5 ) can be close to 9. Could subtropical storms have been the dominant winter storm type prior to 1850?
Or again:
This mid 19th century isotopic shift is correlates with the major climate shift across the northern hemisphere that is documented in a wide-range of proxy records. Geochemical modeling of the BcP cellulosic δ18O stratigraphy indicates that the only viable explanation for a 10 enrichment during the 19th century would involve a change in the primary source of rain water to the region from one dominated by mid latitude storms during the 19th century to one dominated by more isotopically depleted, high latitude storms, during the 20th century. Measurements of the isotopic composition of individual storms during the winter of 2006 illustrate the fact that the δ18OVSMOW of rain from North Pacific storms can be 9 lower than that of their subtropical counterparts, known as the Pineapple Express. We hypothesize that the large isotopic shift in the 19th century is evidence for a change in mean storm trajectories brought about by a more southerly position of the mid-latitude jet and changes in the frequency of the Pacific Decadal Oscillation. Major changes in atmospheric circulation are noted by both ice core and marine sediment records covering this period and these findings thus offer insight onto the dramatic climatic changes that occurred at the terminus of the Little Ice Age.
They illustrate the potential change as follows:
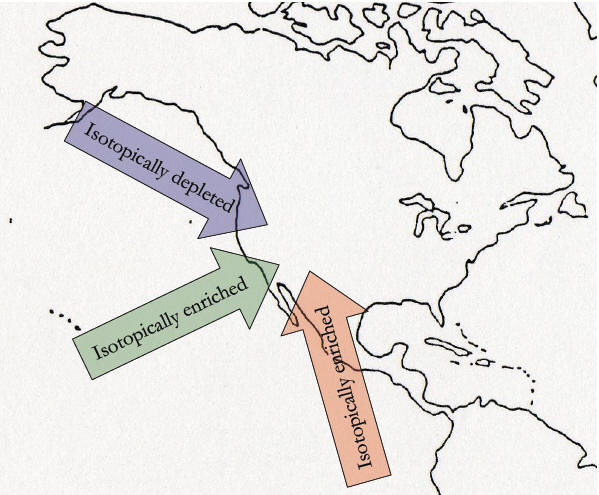
Pineapple Expresses sound like a topic dear to Steve Sadlov’s heart. One nuance in this explanation that I wonder about is that it doesn’t mention precipitation coming from the north. Some of the local meteorological information on the White Mountains mentions patterns that differ from southern California.
For example, the following account associates “Tonopah lows” with snowfall in the White Mountains – incorporating White Mountain precipitation patterns more with Nevada precipitation than California precipitation (at Quelccaya in Peru, the precipitation also comes from the east):
When a surface low-pressure center forms in western Nevada accompanied by an upper trough that deepens excessively to form a cyclone over the region a weather pattern known locally as a “Tonopah low” a northeasterly to southeasterly flow often brings continental polar air or recycled maritime polar air, low clouds, and snowfall to the White-Inyo Range. When such storms involve moist Pacific air, they usually bring heavy snowfall to the region; some of the biggest snowstorms recorded in the White Mountains have occurred in such circulation patterns. Precipitation from closed cyclones over the region is most frequent in spring, resulting in a spring (April or May) precipitation maximum in much of the Great Basin, in contrast to the pronounced winter maximum in the Sierra Nevada.
…
On infrequent occasions, usually several years apart (e.g., January 1937, January 1949, December 1972, February 1989, and December 1990), a long northerly fetch of air may bring an invasion of true Arctic air from interior Alaska or the Yukon. These episodes bring record cold temperatures to the White-Inyo Range and adjacent valleys; at such times minimum temperatures may dip to -25°F (-31°C) or below.Most winters include one or two episodes of “warm storms,” periods of a few to several days in which very moist tropical air reaches California from the vicinity of Hawaii. In these events the freezing level may be above 10,000 ft (3,000 m), and the heavy rainfall may result in widespread flooding in much of California. It is during such storms that heavy rime icing may form on trees, structures, and power lines on high mountain ridges. This is caused by the combined effect of strong winds and supercooled clouds (composed of water droplets at air temperatures below freezing). The cloud droplets freeze on contact, building great formations of ice that grow into the direction of the wind.
Conversely, “cold storms” bring snow to low elevations, including the floor of Owen Valley and desert areas to the south and east of the White-Inyo Range. Major westerly storms that last for two or three days bring heavy accumulations of snow a foot (30 cm) or more in the valleys, and two or three times as much at the highest elevations. Very cold storms from the northwest contain less water vapor, are of shorter duration, and usually bring only a few inches (several centimeters) of snow.
As discussed previously, precipitation in the White Mountain area results primarily from the passage of cyclones with associated fronts during fall, winter, and spring; from closed cyclones in late winter and spring; and from the flow of moist tropical air from the southeast to the southwest quadrant in the summer. Annual amounts vary from 56 in (125150 mm) on the valley floors to 20 in (508 mm) or a little more at the highest elevations. Totals appear to increase right up to the crest of the range. The rate of increase averages about 1.5 to 2.5 in per 1,000 ft (120205 mm per km) rise. However, this average is difficult to apply to any one portion of the range, and the increase is not linear, being higher at upper elevations. Table 1.3 gives average monthly and annual precipitation amounts for stations within the region.
Empirical observation also indicates that the buildup of cumulonimbus clouds in summer thunderstorms is more likely to occur over specific portions of the summit upland than at random. Topographic influence on air moving into the area from characteristic directions is the probable cause. This could add a checkerboard pattern of precipitation distribution independent of more general patterns, such as the increase with elevation and from south to north. Four areas of cloud concentration are noticeable. From south to north, these are Sheep Mountain-Piute (or Paiute) Mountain, the plateau just south of White Mountain Peak, Chiatovich Flats and the area just north of the Cabin Creek-Birch Creek saddle, and the northern portion of Pellisier Flats at the head of Chiatovich Creek. Common features of the four areas are rises in elevation from south to north and broad lateral extent from west to east. Cumulonimbus clouds may form over any part of the range on any summer day, and during extensive storms all or most of the higher elevations may be cloud-covered, but initial formation and greater subsequent development more commonly occur over these four areas.
Another account of Nevada meteorology says:
it is the driest of the fifty states Passing frontal systems will typically cause a temperature fall and winds will shift to northwesterly, northerly, or even northeasterly. These frontal passages may produce gusty winds and scattered to broken mid-level cloudiness. But they will generally produce only light precipitation, if any.
Cold fronts approaching Fallon from the north during the Winter months produce some of the most intense weather observed. If the wind flow preceding the front has a northerly component, snow usually results, if it has a southerly component, rain will occur.
I think that Berkelhammer and Stott’s association of the change in bristlecone dO18 with a change in precipitation provenance is quite plausible – whether the change is from Pineapple Express to North Pacific or whether it involves some aspect of Tonopah Lows is a small nuance that isn’t material to their main point, but may be worth attending to for people with an interest in bristlecones.
I’ve corresponded with Stott about this in very cordial terms and he’s offered to analyze one of our Colorado cores when the crossdating is completed and I plan to take him up on this offer.
References:
M. Berkelhammer and L.D. Stott. An extreme turn-of-the-century hydrologic event recorded in d18O from Bristlecone Pine tree-ring cellulose. Pacific Climate Conference. Pacific Grove, California. May 14, 2007. pdf
Jennifer Holsten, Lowell Stott and Will Berelson, 2004. Reconstructing benthic carbon oxidation rates using δ13C of benthic foraminifers Marine Micropaleontology 53, 2004, 117-132 url
Yuan, F., B. K. Linsley, S. P. Lund, and J. P. McGeehin (2004), A 1200 year record of hydrologic variability in the Sierra
Nevada from sediments in Walker Lake, Nevada, Geochem. Geophys. Geosyst., 5, Q03007, doi:10.1029/2003GC000652.


43 Comments
“Another account of Nevada meteorology says:
And it is no coincidence that average temperatures are higher in Nevada than those at the same latitudes and elevations in humid areas. Just where is that elusive positive water vapor feedback?
Sorry for the simplistic question, but exactly how is dO18 used in temperature reconstruction. Does more dO18 in a proxy indicate cooling and how is this determined?
thanks.
Do I understand this correctly? This evidence suggests the tail-end of the Little Ice Age was marked by a significant and long-term change in the Jet Stream? And this began happening approx 1850?
Hmmmm, what will the esteemed computer climate modelers will have to say about this? 🙂
Interesting a while back I mentioned to SteveS that it might be interesting to compare rings from the
Whites with Rings from Lassen ( just NE of Orland) and he mentioned the two different weather patterns
in CA. So, maybe a d018 comparison would be revealing as the Lassen trees would be more subject
to the Isotopically depleted, just a thought.
Would this shift also be reflected in ice cores? ANd if so which ones?
A higher O18 to O16 ratio in precipitated water indicates a higher temperature of the water, usually the ocean, from which the water evaporated. Think of the effect as fractional distillation, that if done at a low temperature, will favor evaporation predominately of the lighter molecules of water having no O18.
Here’s another piece of the jigsaw puzzle. Here along the Front Range of Colorado, we all recognize the huge difference between storms arriving from the West/NorthWest and those arriving from the South (Gulf).
West/Northwest storms are much colder (particularly in winter)…
Even more, Gulf storms are WET.
If there was a major long-term wind shift at the end of the 19th century, that could easily impact both precipitation and storm intensity among the BCP’s in this area.
I’m curious how dendroclimatologists analyze such possibilities when evaluating conditions for validating the uniformitarian principle.
If you keep the year 1888 in your mind you will get fixated that something odd happened then in Nth America, perhaps globally.
Someting odd is happening in my mind as I grapple with elementary atmospheric climatology. A temperature change at a tree location can be from a change in radiative energy (say an altered pattern of cloud cover) or a change in transported energy (such as a storm or other convection). One of these moves oxygen isotopes differently to the other. This is but one of the reservations I have about oxygen isotopes used this way, but I’m pleased that you have the offer to analyse some of your material.
What data are you referring to? The only event around that time that I can think of is the 1883 Krakatau eruption that ejected more than 25 cubic kilometres of material.
Re #6 This strictly isn’t true. Yes there is a strong correlation between precipitation d18O and temperature. However, this correlation is local. That is to say that the local temperature correlates with the precipitation isotope composition and not the temperature in the source region. We understand this effect in terms of a distillation column.
Imagine a mass of air saturated with water vapour. The first water to precipitate out of this air mass and fall as rain or snow has an isotopic composition enriched in 18-O compared to the vapour. The effect of this is to deplete the residual vapour in 18-O, and thus subsequent precipitation. To maintain precipitation it is necessary to further cool the air mass, thus ensuring saturation. Hence the strong positive correlation between local temperature and precipitation isotope composition.
Steve Mc, I agree with Berkelhammer and Stott in the sense that such a large change in d18O can only be plausibly accounted for by a change in the dominant air mass supplying precipitation to the region. Having said this the change is still extraordinarily large at 10 per mille plus. Berkelhammer and Stott look at differences of nearly 9 per mille between single storms derived from arctic and sub-tropical sources. I would be surprised if such differences were maintained across a whole season. This is an interesting project. Are any of your readers interested in collecting rainfall/snowfall in the area on a daily basis, shipping them to my lab where we’ll do an oxygen and deuterium isotopic analysis. In combination with air mass back trajectory analysis we should be able to say something about the differences in isotopic composition of precipitation from different source regions for this example.
I don’t know anything about the hydrology, hydrogeology of the region but would be interested to know if there are any intermontane basins with structurally simple, single porosity sedimentary basins and aquifers. If so it may be possible to track precipitation isotope changes back through time. Temporal resolution would not be great but a shift of more than 10 per mille in oxygen isotope composition would be hard to degrade through diffusion/dispersion processes!
Paul, what care is required to preserve the samples? (Interesting minor problem: keeping birds from contaminating the collection.) What spacing from interfering obstacles? How quickly do samples need to get to you? (I.e. it would be less costly to mail in bulk every week or two.)
I’ll talk w/ Leslie about this. She loves doing fieldwork like this. We could potentially set up collection in the middle of our field (7050 ft in Colorado).
Perhaps even better: we know the folks who have operated a COOP precipitation site for decades. I wonder whether they simply dump the collected water or ??? Those collectors are ideally shaped.
fractional distillation should also apply to the resins trapped in the wood. When temperatures are low, short chained hydrocarbons should be present in the tree rings; but when the max temperature is high these should have distilled off.
If you take different areas of the ring and extract with an organic solvent, like petroleum-ether, and then HPLC/MassSpec the result you should be able to see what the composition of the resin was when it was laid down.
This sort of analysis should give you a good indication of the maximium temperatures the trees faced during a yearly growing season.
#10 brings up a good point about the expectations of fractionation due to precipitation. If the map http://www.fs.fed.us/psw/cirmount/meetings/paclim/pdf/berkelhammer_talk_PACLIM2007.pdf, is used one site could represent simply a change in local precipitation patterns. However, fractionation due to precipitation does not seem reasonable for the White Mountain samples.
Pete, sample collection, storage and shipping is straightforward. The main requirement is to minimise evaporation during the collection procedure. This is not really a problem for daily, or event collection. Standard rain gauges, or ones you make yourself…1 or 2L soft drink plastic bottle, cut the top off and invert it as the collection funnel..are fine. Swill the water around the gauge, collecting any that has evaporated and recondensed on the sides, mixing it and then collecting a fraction of it in a sample bottle. I use small (10mL) HDPE or glass bottles with McCartney seals and then wrap the lid in parafilm to prevent any evaporative loss. I store the bottles inverted as a further precaution against evaporative loss through the lid seal. Rainwater samples can be stored for months to years without any problems. It would be best to ship, perhaps monthly.
Samples collected from a COOP gauge would e perfect. There is no real need to worry about contamination by birds. It’s difficult to change significantly the isotope composition of precipitation samples other than by evaporation.
I can ship out several hundred suitable bottles and a supply of parafilm to you. We could recycle these on a monthly basis as samples are analysed.
We routinely use 2.4mL samples for oxygen isotope analysis, and sub microlitre for hydrogen. However, we can use much less for the oxygen if necessary.
I don’t think this would work. There is probably no resin distillation going on inside the tree. Temperatures in there don’t vary much, due to the good insulation properties of bark and wood and the high moisture levels. Moreover, I think the chain lengths are controlled strictly by enzymes. The shortest “chain” resin is 10 carbons (2 isoprene units = terpene).
When I lived in the Las Vegas area in 2004 I used to go up into the Mt. Charleston (over 11,000 at the peak) area. At Mt. Lee there were some pine trees that had just been cut down and it was extremely clear that there was a recent (few decades) growth spurt in those pine trees. This was at 8600 feet at the end of the parking lot (left side) opposite from the Ski lifts. This could give some very nice recent data from those altitudes and those mountains are just across from the Sierra’s and are an interesting anomaly in Southern Nevada.
re 16: I forgot to add that tree bark is one of the best vapor barriers in existence.
Interesting that the latest major retreat of Swiss alpine glaciers got under way about 1850. I wonder if there is a connection. Or a teleconnection :). Murray
Paul,
This is getting interesting. We’ll need to work through some logistics and get back to you.
One other question: how much precipitation is needed for a useful sample? The Front Range is the second sunniest region of the USA (after Florida), and on average we receive only 13 inches of precipitation a year. In any given month, we might have noticeable precipitation 0-3 days. A very bad month, perhaps 10.
Looking at a station near me, and a station in Boulder, year to date (299 days) has had:
(Amount, Black Forest days, Boulder days)
>0.00″ 93 86
>0.01″ 63 86
>0.02″ 55 86
>0.05″ 36 59
>0.10″ 26 46
>0.20″ 13 17
>0.50″ 02 11
>1.00″ 00 03
And this year we had the worst winter storms (weekly blizzards in January) in more than a decade
Looks like you’ll get more samples from our friends in Boulder than here 😉
Pete,
using a standard rain gauge (5″ (12.7cm) diameter), 0.005″ (0.13mm) of precipitation will produce enough volume for both oxygen and hydrogen isotope analysis using the methods employed in my lab.
My email is p.dennis at uea dot ac dot uk. Drop me a line and we can continue planning by email.
I have a circular disc about 10 inches diameter with many near-concentric rings and a hole in the middle. The data density increases as one nears the centre.
Is this a record?
And if you are of the generation that remembers “The Running, Jumping and Standing Still Film” produced by the Goons in 1960 (see http://en.wikipedia.org/wiki/The_Running_Jumping_&_Standing_Still_Film) you will know that if you put that black disc on a tree stump (yes truly) and put a stylus acoustically coupled to a megaphone that you hold next to your air, and then run around the tree stump running the stylus in the groove you will hear……..
Now the fact that your circular disc is 10 inches in diameter tells us quite a bit about what you will hear. I would guess original Duke Ellington rather than The Beatles. And be careful with the disc. Unlike later similar 12 inch discs it is likely to be fragile and prone to breakage!
Of course I meant ‘ear’. Getting old!
On the possibility of a mid 19th century shift in North American atmospheric circulation:
Click to access Clim%20Dynamics2004.pdf
Multicentury reconstruction of the Canadian Drought Code from eastern Canada
and its relationship with paleoclimatic indices of atmospheric circulation
Tonapah Lows – cut offs that sit over Nevada for days, sometimes even retrograding over California. These are linked with a Siberia Express pattern where the express is bringing the Polar Jet straight down from the MacKenzie Delta region (after shooting over the polar region). When the Express sets in, you can expect ongoing snow showers east of the Sierra crest. Not the legendary “Sierra Cement” dumps from Pineapple Express or other zonal set ups, but, a steady, powedery, cold, type of snow, which gets into all the nooks and crannies, and blows around like fine sand. Intermingle Siberia Express with zonality, and you are talking about a pretty good “camel’s hump” for the BCPs going into the dry season.
Re #26:
Care to elaborate? Is Siberian Express not meridional? What do you mean exactly by “intermingle”? Is that not what we have now, intermingling of zonal and meridional flows?
RE: #27 – in order for all that light powder to stay in place, and not be blown away (like it was last winter), there need to be intervening layers of “Sierra Cement” – which is zonally originated. Yes, Siberia Express is meridional, in fact, bordering on retrograde. The most extreme examples result in NE upper and lower winds that reach coastal California, bringing a low elevation snow event.
Re #28
I follow. (I didn’t realize that by ‘camel’s hump’ you were referring to the cementing of snow layers. Makes sense.)
RE: #29 – This is a frustrating thing for ski areas. Many years, as noted in Steve M’s post / the paper, this pattern sets in in April and May. The masses from the Calif low lands, who the ski operations depend on for their business, are often not aware of it. In the Calif low lands, only a few light showers, if anything, are experienced (in some cases, only wind). So, the masses are on to kayaks, bicycles and camping. Ski areas typically cannot afford to run ads after March. So, the piles of snow are visited by only a few (especially me!). I’ve cried a few years as they shut down the resorts in May, with ample snow still covering the slopes, enough to last into July.
Steve, would it be fair to say that the White Mountains can get both Pineapple Express-type snow (is this Sierra Cement?) and Siberia Express snow right now? The Berkelhammer and Stott results seem to indicate that there wasn’t as much Siberia Express snow in the LIA. It seems like a surprising result.
It is a conclusion that seems at odds with Girardin’s hypothesis that eastern North American drought used to track the PDO until 1850 when jet stream flow shifted North (thus allowing the NAO storm track to dominate in the East). If California/Nevada/Sierra storms during LIA were tracking from the isotopically enriched south, this would imply a seemingly unlikely (?) long-range meridional teleconnection between the Pacific and James Bay, with the entire Pacific coastal region frequently cut off from the rest of northern North America. Maybe Girardin’s alleged ~1850 jet stream ‘shift’ was largely meridional, not purely zonal?
A map would probably help …
RE: #31 – The White’s are technically in a rainshadow location. That said, peaks are 14K, nearly as tall as the high Sierra. So, it’s not as dry as the Owens Valley. Pineapple (aka “Sierra Cement” producing storms) will bring some snow but no where near what you’ll get on the Sierra’s west slope and summit areas. Siberia is not really blocked by any specific range. There is some oblique blockage by the many ranges of the Great Basin / Columbia Plateau, but again, the White’s are 14K vs those ranges topping out at 11 max. So, Siberia brings more or less a direct hit. When it sets in (and its offshoot the Tonapah Low) the powder dump goes on for days on end. LIA – depends on what the Pacific was doing – PDO seems to be the arbiter of Polar Jet flows.
Also, Pineapple would generally not elevate the snow line above about 9K max (typically, more like 8K max).
Also, a note about Pineapple and flooding. Here are the real scenarios I’ve seen. Early snow (from zonal flows, typically out of the NW) gets hit by Pineapple (this is most common in Dec). Another one is, Pineapple sets in, and the snow level oscillates with short waves coming through. The snow in the “transition zone” repeatedly piles up then melts. Final one is, a late Pineapple when snow levels are innately rising. I mean late, as in, late May. This last one is exceedingly rare. More nuances …. Pineapple-caused elevated snow level will impact the west slope of the Sierra much, much more than the east slope and Whites. Again, at BCP elevations, the biggest impact of Pineapple would be wetter/larger flake snow than from Siberia. It would not cause melting at that elevation.
The cyclonic effect?
Ernest Thayer, 1888
Sorry… I was reflecting over more recent, notable “whiffs” here in Colorado. But if a butterfly’s wings on the other side of the planet can engender hurricanes, how about a slugger’s bat? It might explain Mudville…
I must invent a term for sadlovian salivating over weather patterns.
Steve, I understood my math geek friends who were musically inclined.
What the hell is the connection between weather patterns and circuits?
at a deep level I mean.
I’m thinking anthony shares the same bent and the connection escapes me.
Re #’s 36 & 37, greetings from “somewhere,” Bill 🙂
Steve, sorry for going completely OT.
I don’t know where to post this so here goes. It’s about trees, their use by rings as temperature proxies and the inverted U shaped response to certain variation from optimum growing conditions. Too much temp can kill as easily as too little, too much water, too much of some fertilizers etc. There are threads elsewhere along these lines.
CO2 fertilisation is mentioned as a disturber of the orderly nature of dendrothermometry. Keep in mind that fertilisation (nutritional type) is traditionally divided into the majors (N, P and K) and the trace elements (like Mo, B, Zn, etc). In between there is a medium droup which includes sulphur. Trees require a fair bit of sulphur, in part because many of their proteins have sulphur-rich amino acids. Talk acids, talk acid rain, which is sometimes correlated with SO2 production from ventures like smelting sulphide ores and burning pyritic coal.
Quite a lot of work was done on wind dispersion of the SO2 plume from the big mine at Mt Isa in Australia, which is essentially isolated from competing anthropogenic sources. The plume could be detected at ground level for several hundred km in strong windy weather. I have no doubt that it added nourishment to plants over a large area and might well have upset the ring pattern in larger trees.
As such, I think that sulphur should be added into the dendro work as well as adding, Lindzen style, to atmospheric physics effects.
I simply do not comprehend the choice of CO2 and methane as the main culprits for global warming when so many other possible factors are out there, awaiting research and incorporation into explanations. As one prominent scientist put it to me the other day, numerous models do not fit UNLESS you program in a rising concentration of CO2. That is science by subtraction. I am more interested in adding in possible perturbations to see if they, too, make the models play the right tunes. Why stop at CO2 and methane when there’s so much more excitement still to come?
That doesn’t even matter if the temperature rise is wrong, meaningless or natural.
But if it is correct, meaningful and un-natural, somebody builds a temp-co2 linked model and boom. Big deal.
The reason the focus is on that is because it’s a simple answer, it’s an easy answer, and it’s something we can do something about. There’s other possible ulterior motives, but let’s say that in the last couple of hundred years, it certainly looks like they’re going together. (If that’s a long enough
period of time, if there’s a relationship that strong, or which direction the relationship is, those are other questions.)
Scientifically physically CO2 does have some effect, some role, and so if we say it “causes warming” then that’s fine, but the story doesn’t stop there as some would. It’s incomplete.
It’s just as valid to say “aerosols cause cooling” or “particles cause warming” or “water causes cooling” or “clouds do something or another probably both” etc etc etc.
But of course, since the others don’t “match the temperature change” yada yada yada some think CO2 is all there is and don’t realize this isn’t some cup where we put in 6 ounces of water and know what we have, and we can take the water back out, this is one factor of a complex, dynamic, poorly understood chaotic system.
I contend that simply saying we can point to any one thing and draw conclusions from it is naïve and illogical, just because that one thing A) seems to explain it all B) looks like it causes the other.
Isn’t this pretty much the heart of the controversy?
There is a Tonopah Low prog’ed to settle in, by early next week.
A new paper that casts doubt on the findings of Berkelhammer & Stott’s oxygen isotope bristlecone departure. Abstract is here:
http://hol.sagepub.com/cgi/content/abstract/20/1/3