Specialist literature on varves e.g. Besonen et al 2008 – coauthor Raymond Bradley -(which is cited by Tingley and Huybers) make the obvious observation that varves are compacted within a core. Besonen et al 2008 allow for compaction by estimating annual mass accumulation as a more appropriate measurement of varve “thickness”, rather than uncompacted varve thickness. In their abstract, Besonen et al stated:
In many studies of lakes from the High Arctic, varve thickness is a good proxy for summer temperature and we interpret the Lower Murray Lake varves in this way. OnOn that basis, the Lower Murray Lake varve thickness record suggests that summer temperatures in recent decades were among the warmest of the last millennium, comparable with conditions that last occurred in the early twelfth and late thirteenth centuries, but estimates based on the sediment accumulation rate do not show such a recent increase
They report later in the article:
On the other hand, because of compaction, the thickness of recent varves is not directly comparable with those varves that are buried deeper in the sediment pile. This problem can be addressed by calculating a packing index (a simple ratio of the area occupied by sediment grains versus the area occupied by matrix in the varve BSE images) and then calculating the sediment accumulation rate on an annual basis (assuming a constant sediment density of 2.65 g/cm3, for quartz). This procedure compensates for compression of the sediment with depth, and results in a suppression of the trend over the last century seen in the varve thickness record (Figure 7).
An excerpt from Besonen’s Figure 7 is shown below. The top panel shows varve thickness unadjusted for compaction, while the bottom panel shows mass accumulation. The top panel (with no allowance for compaction) shows somewhat elevated 20th century levels, while the bottom panel (after allowing for compaction) does not – the phenomenon noted in their abstract.
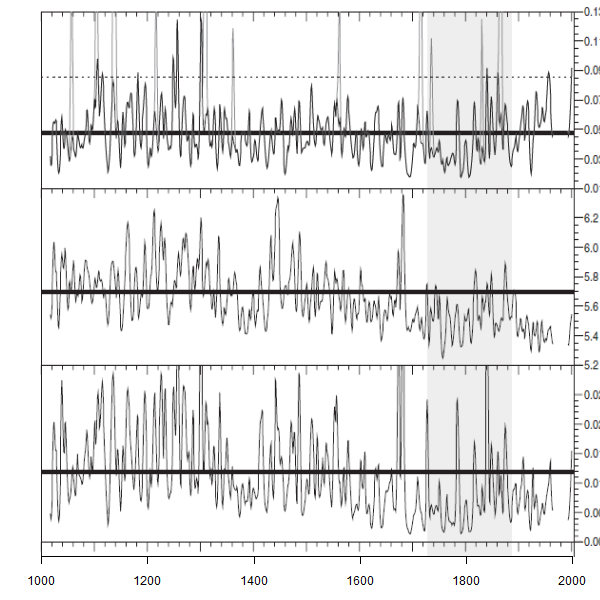
Figure 1. Excerpt from Besonen et al Figure 7. Top – varve thickness unadjusted for compaction (but after turbidites); middle – density; bottom – mass accumulation.
A related article (Cook et al 2009 – also with Bradley as coauthor) the following year on a different Murray lake core made similar observations about compaction. Cook et al provided a temperature reconstruction using mass accumulation rate, showing a rather elevated MWP as shown below. I’m not inclined to put much weight on simplistic reconstructions from varve thickness (see also my discussion of Gifford Miller’s observations on this topic), but show this series as evidence that mass accumulation was used by this group as the relevant index.)
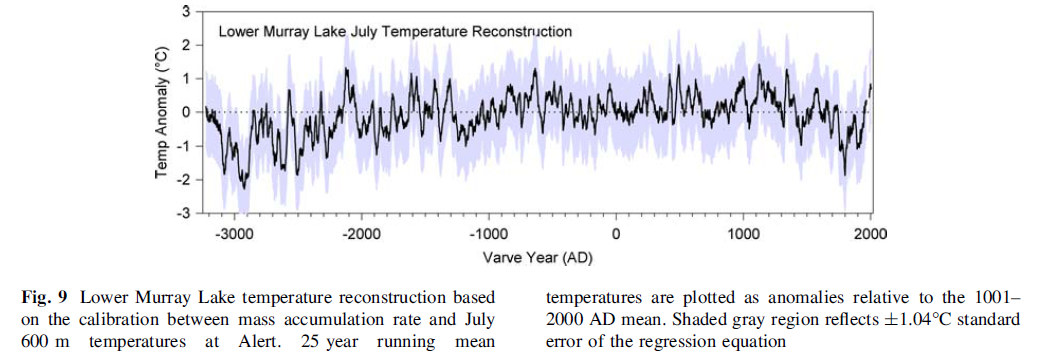
Figure 2. Excerpt from Cook et al 2009.
Tingley and Huybers 2013 have three classes of proxy data: MXD data, which has the familiar divergence problem; ice core O18 which doesn’t have a Hockey Stick shape and varves. The Murray Lake varve series is used. Tingley and Huybers provide an excellent SI, including exact URLs for data sets as used – a simple enough protocol that unfortunately is seldom observed. (They forgot to archive their actual reconstruction, though I presume that this is a mere oversight since their intent is clearly to provide a comprehensive archive).
In their SI, they state:
Details and references for the lake varve records used in the analysis are available in Table S.1. Unless the description of the data indicates otherwise, we use the total varve thickness.
Of the two Murray Lake versions (different cores taken by the same group), they cite the Besonen et al version.
For the Murray lake record, we use the unfiltered version of the shorter (1000 year) record posted at the NOAA Paleolimnology site [60].
However, when one compares their archive of data as used to the NOAA archive, one can immediately determine that they used varve thickness without compensating for varve compaction (the series match), rather than mass accumulation as used by Cook et al 2009 in their temperature reconstruction. This decision gives a pronounced upward bias, as shown by the difference between the two series (after taking a log and then scaling as in Tingley and Huybers.)
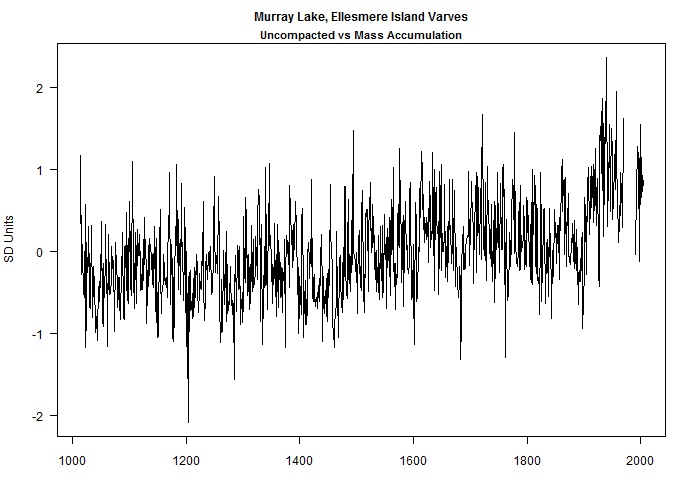
Figure ^. Murray Lake. Difference between uncompacted varve thickness as used by Tingley and Huybers and mass accumulation. Both series logged and then scaled, before differencing.
I haven’t yet looked at how the other varve series handled compaction, but it seems like an important issue in any attempt to deduce temperatures from this sort of data. In the particular case of the Murray Lake series, it seems to me that the original data clearly “indicates” that mass accumulation be used as an index, rather than varve thickness unadjusted for compaction and that this should have been used according to the stated methodology of Tingley and Huybers.
As previously noted, Tingley and Huybers also used the contaminated portion of the Korttajarvi sediment data, so there are multiple problems with their varve reconstruction. These are not complicated issues, but ones that ought to be within the scope of even Nature peer reviewers.


17 Comments
It goes without saying, but I’ll say it anyway: these analyses of temperature proxies that SteveM has been doing of late have been most informative and greatly appreciated by me. One does not have to go into the motivation of why reconstruction authors might use one version of a reconstruction over another or truncate a reconstruction where they did, or, for that matter, why we do not see the climate science community more directly involved in critiquing these works in order to appreciate the efforts and need for those efforts that come from outside the community. It puts the published reconstruction works in a whole different light and raises the question about the basic premises of these reconstructions.
“Nature
peerpoor reviewers”Fixed!
A single varve drilling core can deliver two very different temperature (proxy) graphs depending which aspect a researcher wants to highlight?
An inconvenient truth for Science.
In a previous discussion of Miller et al 2012 here https://climateaudit.org/2012/02/11/gifford-miller-vs-ar5-reconstructions/, Gifford Miller interpreted increasing varve thickness as evidence of cold rather than warmth.
Tingley and Huybers did not explain why Miller was wrong.
Steve — As I recall from some articles on (Canadian) varve thickness discussed here a few years ago, the correlation of varve thickness with temperature depends on whether the lake is glacier-fed or snow-fed.
If it is glacier-fed, a warm year means more melt and more varve buildup.
But if it is snow-fed, a cold year means that a larger portion of the annual precipitation is in the form of snow that just sits there until spring and then causes a more violent spring meltoff and therefore thicker varves.
So it can go either way. But if feeding glaciers have come and gone over the period in question, it must be very uncertain.
There is pre-Team literature on varves which concludes only that a lot of factors are involved. Gifford Miller’s comments on this seem appropriately nuanced.
OK, just another case where the climate ‘scientists’ seem to be unaware of a multitude of data in the geological and related engineering literature. It is well known that sediments are compacted under the weight of more newly deposited layers. There are a number of papers in the literature covering what are termed “shallow” (meaning less than say 2000 ft below the seafloor or ‘mudline’) sediment porosity (inverse of the solidity or sediment mass as discussed above) changes with depth. Curve fits of this behavior depend on the amount and type of clay minerals and sand/silt (quartz mostly) present in the sediments. The finer the materials deposited the more the sediment compacts with depth. Typical curve fits of the data incorporate non-linear exponential decay (e.g., Porosity(depth) = Porosity(mudline)*exp[-rateterm(depth)*depth]).
Clearly, the varves or equivalently the thickness of sediments depostited over a given time period at a constant rate will decrease with the depth of those sediments. The amount of compaction can be dramatic and is always greater near the surface where all of the recent sediments are. To ignore this effect to me is another indicator of the lack of knowledge or more gently experience these guys have. Of course, one could speculate nefarious intent. I suspect it is just inexperience and stopping at the point where one gets the desired answer.
I have even heard news anchors mention (post-Katrina) how the Mississippi delta is sinking as the muck gets compacted unless more mud is added on top. This is common knowledge.
I came across this…
D Andrea, W.J. and Bradley, R.S., 2010, “A 5,000 year alkenone-based temperature record from Lower Murray Lake reveals a distinct Medieval Warm Period in the Canadian High Arctic”
From the abstract:
” We have generated a ~5,000 year long, decadally-resolved record of summer water temperature from the annually-laminated sediments of Lower Murray Lake on Ellesmere Island in the Canadian High Arctic.
Most strikingly, the alkenone record reveals warm lake water temperatures beginning ~800 AD and persisting until ~1200 AD, with temperatures up to 2-3 deg C warmer than the mean temperature for the past 100 years. This dramatic medieval warm period on Ellesmere Island interrupted a distinct (neoglacial) cooling trend that had begun approximately 2000 years earlier.”
Steve: this data has not been published yet. Your reference is to a presentation at 2010 AGU, but it’s not in the literature yet. Maybe they’re waiting for Lonnie Thompson to publish Bona Churchill.
Oops,
http://cgrg.geog.uvic.ca/abstracts/DALake-based.html
Thanks Jeff. Obviously there can be local problems and method issues with all paleo-temperature proxies and one should be cautious about results that confirm ones opinions. However, qualitative confirmation data, if true, is useful.
Howard,
I particularly liked that part too and think it would be interesting to see their references to archeology papers. This is something that I see is missing from climate reconstructions.
I hope that Tingley and Huybers will stop by to comment on your criticisms. It’s a good sign that they are properly archiving their data.
Besonen et al 2008:
A 1,000-year, annually-resolved record of hurricane activity from
Boston, Massachusetts
Click to access Besonenetal08GRL.pdf
Using varves (annually deposited mud) to determine hurricane activity going back
1 kyr. Note, the explosive growth in the Boston area meant they had to chuck the data
from 1870 onward. In the high arctic, you are unlikely to have as much human contamination and varve data may be good up to the top of the sample, but the varve compaction needs to be addressed.
Discussion at CA from 2008:
Aren’t you giving NATURE peer-reviewers way too much credit? Technically and ethically?
Seems to chuck about 100 years of soil engineering out the window. No discussion of water content clay/silt fraction and preloading. Drilled lots of varved soils and can’t remember compacting the samples as a result of undisturbed sampling. Desiccation, glacial reloading are some other complications. Poor sampling techniques would account for compaction and garbage results.
Indeed varve thickness is not the best proxy because of several parameters which are not necessarily linked to climate. It can be a good proxy for proximal glacial lakes, but for nival watershed, it does not seem really good. However grain size data extracted from annual varves in nival watershed might be much more effective to track a single meteorological signal. There’s a paper on that in which correlation between varve thickness and annual particle size are weakly correlated as observed in fig. 4.
http://link.springer.com/article/10.1007%2Fs10933-012-9611-8#page-1