A question for readers: which of the following proxies are used to reconstruct past Southern Hemisphere temperature in the IPCC’s graphic (Figure 5.7b) showing SH reconstructions:
1. Graybill’s California strip-bark bristlecone chronologies
2. upside down and contaminated Finnish lake sediments
3. European instrumental temperature data
4. Antarctic ice core d18O isotope data covering the medieval period
The answer, rather remarkably, is that IPCC’s SH temperature reconstructions in their signature spaghetti graph (Figure 5.7b) used California bristlecone chronologies, upside down Tiljander and European instrumental temperature data, but did not use Antarctic isotope data covering the medieval period.
This remarkable turn of events occurred because IPCC Figure 5.7 relied on SH reconstructions from Mann et al 2008, citing three SH reconstructions from Mann et al 2008: Ma08eivl, Ma08eivf and Ma08cpsl. While it may seem counter-intuitive that bristlecones and contaminated Finnish sediments would be used in a SH temperature reconstruction, anything is possible in Mannian EIV and, indeed, bristlecones and contaminated sediments turn out to contribute to the SH EIV reconstructions, as I will show below.

IPCC AR5 FIgure 5.7(b). Reconstructed … Southern Hemisphere… annual temperatures during the last 2000 years. Individual reconstructions (see Appendix 5. A. 1 for further information about each one) are shown as indicated in the legends, grouped by colour according to their spatial representation (red: land-only all latitudes; orange: land-only extra-tropical latitudes; light blue: land and sea extra-tropical latitudes; dark blue: land and sea all latitudes) and instrumental temperatures shown in black (HadCRUT4 land and sea, and CRUTEM4 land-only; Morice et al., 2012). All series represent anomalies (°C) from the 1881-1980 mean (horizontal dashed line) and have been smoothed with a filter that reduces variations on timescales less than ~50 years.
Two of the three Figure 5.7 reconstructions (Ma08eivl, Ma08eivf) are Mannian EIV reconstructions ostensibly for land (“l”) and land-and-ocean (“f”). The third reconstruction (Ma08cpsl) is a CPS reconstruction for “land”. I use “land” and “land-and-ocean” in quotation marks for reasons that will become clear later in the post.
Each EIV reconstruction is a “composite” of EIV versions calculated using different proxy networks, with each variation included only in the period in which it passes Mannian cross-validation – a murky statistical procedure not employed, to my knowledge, by any other known “scientist” (or scientist, for that matter).
Ma08eivl (the “land” reconstruction) is (as I understand it) an average of the following five slightly varied Mannian reconstructions:
1. sh_glful_cru. This variation uses the “glful” network i.e. it includes proxies from both the Northern and Southern hemisphere (GL-global) without screening (“ful” as opposed to “scr” for screened). In the AD700 step (which I’ve selected as an example), the glful network has 43 proxies, of which only 9 are in the SH.

Figure 2. Location of ‘glful’ proxy network (AD700 Step). 34 of 43 are in the Northern Hemisphere.
2. sh_glful_nolut_cru – The glful_nolut network is formed by excluding the Luterbacher network from the glful network. The Luterbacher network are a gridded European reconstruction from AD1500 on, in which instrumental data is used in the recent portion. Its modern portion is not “proxy” data and inclusion of this data as supposed “proxy” data overstates statistics on proxy veracity – a point made at CA previously. The Luterbacher data does not go back to the medieval period and thus this variation is more or less identical to glful in the medieval period. (I say “more or less” because nothing can be assumed in Mannian data analysis.)
3. sh_glful_nodendr_cru. In the glful_nodendr proxy network, tree ring data is excluded. However, it still includes both upside-down Tiljander and the Luterbacher network. Without the contaminated Tiljander data, this reconstruction apparently doesn’t “validate” prior to AD1500 (according to the SI to Mann et al 2009). However, Mann did not issue a corrigendum at PNAS and the portion of this reconstruction reliant on contaminated Finnish sediments continues to contribute to the SH reconstruction.
4. sh_shful_cru. This network uses the shful network: SH proxies without Mannian screening. Nine proxies are included: Quelccaya O18 and accumulation, both in older versions (also used in MBH98); Cook’s Tasmania tree ring chronology (also used in MBH98), two spelothem series (C13, O18) from Cold Air Cave, South Africa, Thompson’s Kilimanjaro O18; Pallcacocha greyscale sediments; and a couple of Argentine tree ring series. This network should correspond to the CPS network in the same step.
5. sh_shscr_cru – This network applies Mannian screening (another murky operation) to the shful network. Only 4 proxies are eligible for the AD700 step, one of which is Quelccaya d18O, a familiar series. Mannian “validation” eliminates this variation prior to AD1300, so it doesn’t “matter” for medieval comparisons.
Thus, three of the four variations contributing to the composite in the medieval period are dominated by NH proxies. Bristlecones, contaminated sediments and Luterbacher’s European instrumental-using network all contribute in varying degrees to three of the four variations, proving my point.
SH “Land” and “Land-and-Ocean” Reconstructions
Mann’s SH land-and-ocean reconstruction uses exactly the same network as his SH land reconstruction: glful; glful_nodendr;glful_nolut; shful and shscr. The only difference arises from the target series (SH HadCRU rather than SH CRUTEM). For each proxy network used in the composite, the SH “land” and SH “land-and-ocean” reconstructions are remarkably similar. For example, the next figure compares “land” and “land-and-ocean” reconstructions from the glful network (shglfulcru and shglfulhad respectively. These reconstructions are remarkably similar not because of skill in reconstructing land versus land-and-ocean, but simply because Mann has regressed slightly different instrumental series against the same proxy network. The reconstructions have only slight differences in weights and scaling.
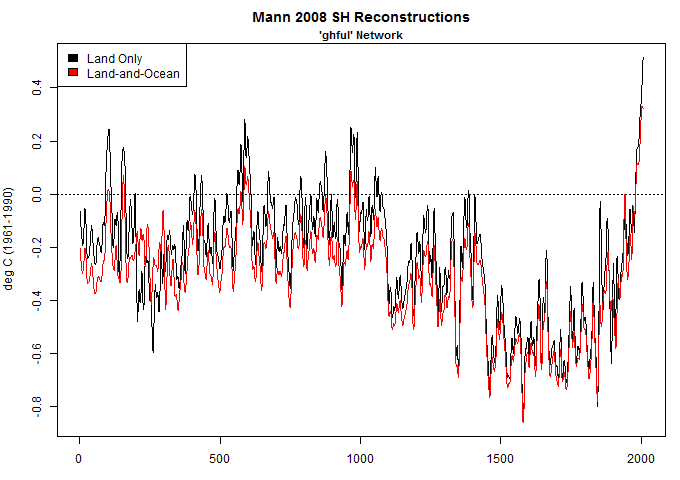
Figure 3. Mann 2008 SH “glful” reconstructions for “land” and “land only”.
The look of these reconstructions is noticeably different than the original Hockey Stick. This is because this variation assigns considerable weight to Curtis’ Central American lake sediment O18 series: these have a fairly marked medieval warm period; other variations more heavily weight bristlecones and/or Korttajarvi sediments and are more Hockey Stick in appearance.
NH and SH “Land” Reconstructions
Similarly, NH and SH “land” reconstructions using the glful network are remarkably similar to one another, again not because of “skill” in differentiating one hemisphere from another but merely because the SAME network of proxies is used in both cases.
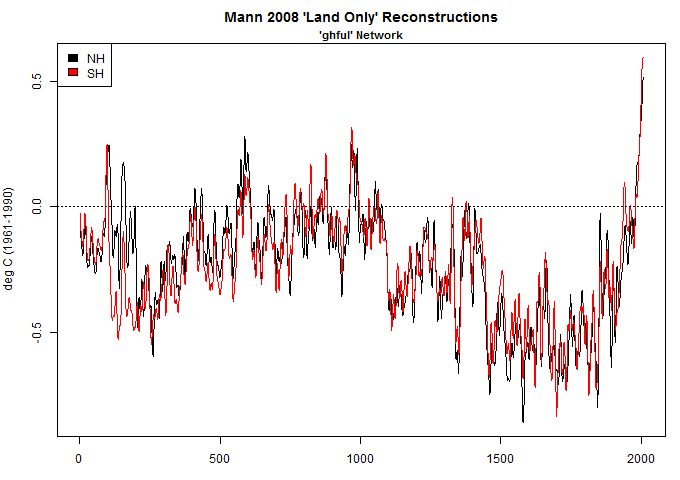
Figure 4. Mann 2008 NH and SH “land” reconstructions.
shful vs glful
In the next graphic, I’ve compared the SH “land” reconstruction from the glful network to the shful network (shglfulcru vs shshfulcru). These differ in the early portion but are more than remarkably similar since 1860: they are identical. See the right panel below where glful has been shown as a line and shful as “+”.
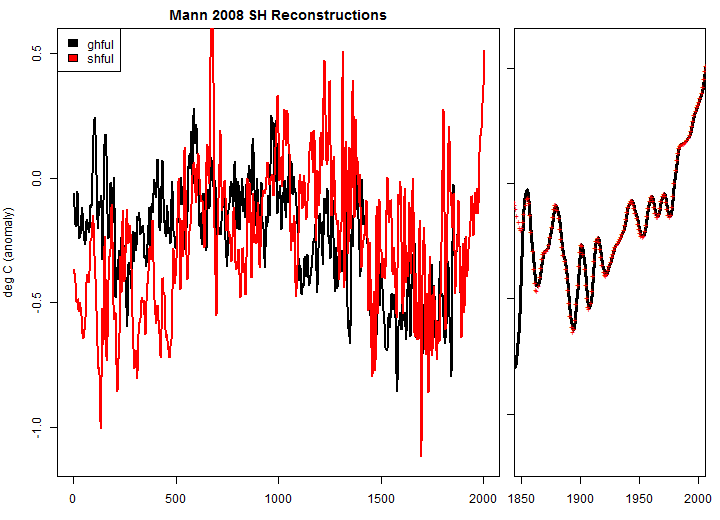
Figure 5. Mann et al 2008 SH variations: glful and shful.
This phenomenon was noted in contemporary CA discussion of Mann et al 2008, but not discussed recently. The reason why the later periods are identical is that Mann’s EIV reconstructions splice instrumental temperature to proxy reconstructions. (Longtime readers will recall Mann’s notorious 2004 statement that allegations that climate scientists spliced instrumental data with proxy reconstructions was a fabrication of fossil fuel disinformation.)
EIV vs CPS
In the next graphic, I’ve compared the Mann 2008 SH CPS reconstruction to the SH EIV reconstruction using screened SH proxies: Mannian CPS methodology includes a screening step. I haven’t parsed Mannian EIV screening to verify that it is the same as Mannian CPS screening. There is considerable similarity between the variations, but also differences. These presumably arise from differences in weights, with some series being more heavily weighted in EIV than CPS. (EIV can also assign negative weights to some series i.e. flip them over.)
Also note the difference in the modern period: Mannian CPS does not splice instrumental data into the reconstruction.
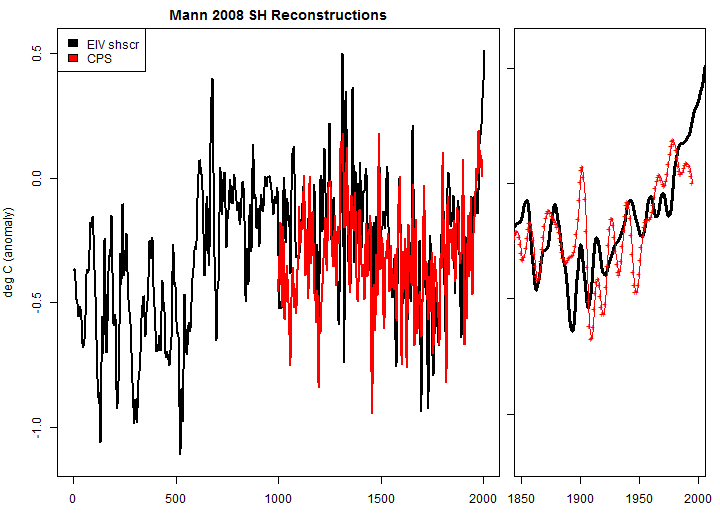
Figure ^. Mann et al 2008 SH “land” reconstructions: EIV using SH screened network (shshscrcru) vs CPS.
Antarctic Proxies
Probably the most important development in Southern Hemisphere proxies since AR4 has been the publication and/or archiving of high-resolution Antarctic isotope data covering the last two millennia. Some data had been measured prior to AR4 (e.g. Tas van Ommen’s Law Dome and Ellen Mosley Thompson’s), but it had either not been published (van Ommen) or archived (Mosley-Thompson). In addition, there are important new results e.g. Steig et al 2013, commendably archived in a timely manner.
Antarctic isotope data (PAGES2K and Steig et al 2013) shows a long-term decline in isotope data. IPCC AR5 commented on this as follows:
Antarctica was likely warmer than 1971–2000 during the late 17th century, and during the period from approximately the mid-2nd century to 1250 (PAGES 2k Consortium, 2013).
Despite the importance of Antarctic isotope data, no Antarctic isotope data covering the medieval period was incorporated in the IPCC SH spaghetti graph (Figure 5.7b).
This is because Mann et al 2008 did not use any Antarctic isotope data covering the medieval period. Nearly all of the Antarctic data used in Mann et al 2008 is only from ~1760 on: it appears to come from a rather dated collation of ice core information by David Fisher in the 1990s. The earliest Antarctic ice core in Mann et al 2008 is Talos Dome, in a version which goes only to the 13th century.
Curiously, in an earlier work (Mann and Jones 2003), Mann had used an Antarctic isotope series covering the past two millennia (Law Dome), but, despite the shortage of long SH proxies, this series was not used in Mann et al 2008. The reasons for its omission were not stated. As CA readers realize, the Law Dome isotope series has a rather elevated medieval period, a feature that led to an AR4 controversy seen in Climategate emails. AR4 wanted to illustrate long SH proxies, but refused to show the Law Dome series (with its warm medieval period).
In other words, as stated in my introduction, the IPCC reconstructions in Figure 5.7 did not any Antarctic isotope data covering the medieval period.
Conclusion
In its running text, the IPCC stated of Southern Hemisphere reconctructions:
An increasing number of proxy records and regional reconstructions are being developed for the SH (Section 5.5), but relatively few reconstructions of SH or global mean temperatures have been published (Figure 5.7b and c).
Both statements are true, but a complete assessment would have reported that the reconstructions shown in their Figure 5.7b did not rely on these new proxy records, but, for the most part, on Northern Hemisphere proxies, including bristlecones and contaminated sediments.


109 Comments
As soon as I read your question, I would have said, “start with the most distant location.”
Peer reviewed??
Can this really be as totally ridiculous as it sounds?
Note the prominence of the ‘PS04bore’ placement (1st) and the thickness of its line. That’s a borehole temperature meta-study: Pollack and Smerdon 2004. But this looked at Northern Hemisphere borehole readings.
Earlier, at AR4, Pollack and Smerdon was present in the NH spaghetti graph (fg. 6.10b), lighter colored and listed last. I see no place at AR4 where PS04 was applied to Southern Hemisphere anything. Indeed, PS04 openly notes that the “global database” they used also contains Southern Hemisphere boreholes, and implicitly suggests someone should look at those too.
So, AR5’s fg. 5.7 gives visual and notational placement prominence to a NH borehole paper.
Progress!
As a follow-up, AR5 Table 5.A.6, at page 5-105 states that the “region” covered in “Pollack and Smerdon (2004)” is “L [Land] 0-90 N, L 0-90 S L 90 S- 90 N.”
I re-checked the paper, it is Northern only. I am confirmed by AR4’s “Table 6.1 Records of Northern Hemisphere temperature shown in Figure 6.10, at page 469, which indicates “Land, 0-90 N” for “Pollack and Smerdon, 2004.”
Amendment for clarification: So, AR5′s fg. 5.7(b)…Southern Hemisphere… gives visual and notational placement prominence to a NH borehole paper.
Just a little more: looking very closely at the three graphs of AR5’s fg. 5.7, each evidence the PS04bore. Such is relevant for the NH representations, but irreverent and irresponsible–or worse–for both the SH and Global reconstruction graphs. Notably, the endpoints of the three are slightly different. The NH one ends is highest, SH lowest, and the global is in between. The middling global one apparently is supposed to appear like a representation of the merging of the two sets of hemispheric data, something that does not actually appear in that paper, let alone consider SH data at all. That is quite a bit of graphic chicanery, unless there is some other explanation…which I kinda doubt. At least, any good one.
Isn’t all this Jean S.’ fault? If Gergis et al had sailed through, they would have all sorts of SH hockey sticks to point to!
Ok, that made me laugh…very nicely put. Chuckle…
No, Matt.
Here is an extract from the Gergis withdrawn paper –
“The multi-proxy temperature reconstructions that are currently available for Southern Hemisphere (Jones et al., 1998; Huang et al., 2000; Mann and Jones, 2003; Mann et al., 2008) are considerably more uncertain due to the limited availability of long proxy records and hitherto lack of consolidation of available records from the region.”
Same cast, same actors.
Worse then I thought.
Some teleconnections are more tele- than others.
Seriously, this comes as no surprise after what we’ve seen of Mann’s disregard for the very idea of a priori proxy screening. If you start from the premise that anything which went up in the 20th century by as much as global thermometers went up (or went up by as much as global thermometers went up once you’ve turned it upside-down) must itself be a global thermometer, it’s not that much of a leap to assume that anything which went up in the 20th century by as much as SH thermometers went up must itself be a SH thermometer even if it doesn’t happen to be in the SH.
The gift that keeps on giving … the Mannian method even mixes the hemispheres. Congratulations as usual on a most succinct and clear demonstration of the vacuous nature of their prolixity.
w.
I think that Steve has shown admirable restraint in this post. I think it behooves the rest of us to follow suit. Afterall, we don’t want Steve following Mark Steyn on the witness stand in a defamation suit, do we?
I get the feeling he is away from his computer at the moment.
I am not an engineer or scientist but am I to understand that Mann used Northern Hemisphere proxies to construct a Southern Hemisphere hockey stick?
Chuck L,
According to “Mannian logic” (i.e., logic according to Michael Mann), the “test” of a proxy for a region is how well it reproduces the Climate Research Unit’s thermometer-based estimates for that region over the chosen “validation” time period, e.g., 1850-1899.
By the way, the acronyms and abbreviations can get a bit confusing. So, in case you aren’t familiar with the datasets, the thermometer-based datasets used for Mann et al., 2008 were CRUTEM3 (land-only) and HadCRUT3 (land and oceans). The “CRU” stands for Climate Research Unit and “Had” is short for the Hadley Centre who calculate the sea surface temperatures. The CRU and Hadley Centre provide separate Northern Hemisphere (NH), Southern Hemisphere (SH) and Global versions of their datasets.
In the years since Mann et al., 2008, the CRU and Hadley Centre have updated their datasets to version 4 (HadCRUT4/CRUTEM4). So, in the IPCC figure Steve is discussing, the IPCC compared the Southern Hemisphere (“SH”) versions of HadCRUT 4 and CRUTEM 4 to the Mann et al., proxy estimates (the ones labelled “Ma08eivl”, “Ma08eivf” and “Ma08cpsl”).
Anyway, according to Mann et al. algorithms, it doesn’t really matter what a proxy is, or even where it comes from, in order for it to be a “temperature proxy”! Once a given proxy record shows a similar statistical relationship between values over the “validation” period to that in the thermometer dataset then Mann et al.’s algorithms decide that that proxy is a good one, and it gets a high weighting.
This algorithm has some bizarre consequences:
1. The proxy doesn’t actually need to be a temperature proxy! In fact, many of the proxies Mann et al. have used over the years were officially “precipitation proxies”, and they have even used “rainfall records” as temperature proxies.
2. The proxy doesn’t actually have to reproduce local temperature records. All it needs is to show a similar trend to the “global” or “hemispheric” record being tested (and just over the validation period!). For instance, the famous “strip bark” bristlecone pines Mann used in his original 1998/1999 studies showed a sharp “hockey stick” trend, which matched the CRU “northern hemisphere” dataset, but didn’t match the actual temperature records in western US where the bristlecone pines grow!
3. The proxy doesn’t have to be on the same continent, or even in the same hemisphere, as Steve points out in this post. In the original Mann, Bradley and Hughes, 1999 “hockeystick” (often called “MBH99”), they claimed to have reconstructed northern hemisphere temperatures all the way back to 1000 AD. But, of the 12 proxies they had with data going back to 1000 AD, four of them were actually from the southern hemisphere! In this post, Steve is pointing out that the Mann et al., 2008 southern hemisphere estimates are mostly based on northern hemisphere proxies!
As far as I know the only official “justification” Mann has given for this approach is an obscure reference to “teleconnections” in his first 1998 paper.
In Mann et al., 1998, they said something along the lines that complex weather patterns like El Nino can cause weather patterns in one part of the world to be related to the weather patterns in another part of the world. In other words, a temperature proxy from the Sahel might actually give some idea of what happened in the Amazon. I’d have to double check, but as far as I remember, that is the only formal justification that’s been given so far… Maybe Steve or one of the others might correct me on this???
Does that answer your question?
Thanks, Ronan. Very helpful; it appears to be even more farfetched than I had supposed! With the Southern Hemisphere containing far more water than land,it seems to me that there is even less justification to use proxies from one hemisphere to derive climatic trends for another, whether temperature or precipitation. I appreciate your time and explanation
No problem, Chuck L. 🙂
Actually, this “wrong hemisphere” problem is probably one of the least problematic aspects of the Mann et al. multiproxy studies!
For example,
1. If a proxy gets a high/low “verification” score during the verification period, how do we know that wasn’t just a coincidence?
The problem with “data dredging” (which is essentially what they are doing), is that your analysis will generate a lot of false positives and false negatives. Data dredging (or data mining) can be a useful technique in an “exploratory” stage of analysis, but Mann et al. are using it as a “confirmatory” stage, i.e., they’re using their analysis to say “this is what temperatures were like in year x…”
2. The actual “verification statistics” Mann et al. use for testing their proxies are… emm… let’s just say, “non-standard” 😉
3. In several cases, the proxies they used are known to have non-temperature-related biases. For instance, when Mia Tiljander et al. were collecting the Finnish lake sediments mentioned at the top of the post, they found that the sediments near the top of the core were contaminated by local human activity, e.g., bridge building, from about 1750(?) AD onwards. In other words, the sediment measurements during the “verification period” are not a proxy for temperature…
But, the above problems have been discussed extensively elsewhere on this blog. So, I guess we should just stick to the SH/NH issue for now…
At least they are on the same planet.
I’m not so sure about that, John…
Oh, wait… do you mean the proxies? 😉
In that case, you’re right. That’s at least something… 🙂
It would not surprise me to see a Martian proxy used in future papers. I hear temps there have been hockey-stickish.
Surely, an upside-down Tiljander, when viewed from the southern hemisphere, would appear right-side up! Q.E.D.
Usually for me, LOL is a figure of speech. But in this case …
w.
I believe the old saw that two wrongs do not, in fact, make a right pretty much applies here.
Nix-
Priceless!
🙂
TNT’s NBA postgame show likes to put up photoshopped pictures, and on particularly amusing ones Shaquille O’Neal will yell out,’Underdog, put that on a t-shirt!’
Well, JOSH, put that on a T-shirt!
The claim that “wrong hemisphere” data were used is bizarre. Multivariate regression methods are insensitive to the side of predictors. Screening, when used, employed one-sided tests only when a definite hemisphere could be a priori reasoned on physical grounds. Potential nonhemispheric influences on the Tiljander and other proxies were discussed in the Appendix, which showed that none of our central conclusions relied on their use.
Indeed, a forthcoming reconstruction by the usual suspects, incorporating updated series for Mare Tranquillitatis, Olympus Mons, and the Great Red Spot, shows that omitting the series from Europe and California has no significant impact on the reconstructed SH history.
You forgot to mention how robust the findings are. No doubt they’re so robust that you can substitute red noise for the data and STILL get the right result most of the time!
By the way,,, how ironic is it that the word “robust” comes from Latin “robustus” which means “as strong as oak”?
Paul, good points, but I’m waiting for the study “Multi-regression analysis of magnetosphere, charged-particle and plasma wave measurements of the Voyager space probes as an paleo-climate proxy” (will be out shortly in Science, Nature, PNAS or Psychology Today, whoever shows interest first). This robust climate reconstruction will settle all those baseless accusations – once and for all.
Recycled Proxies. Recycled Excuses. Hilarity ensues.
Very nicely done. Link here for those who didn’t recognize this as a parody. http://www.pnas.org/content/106/6/E11.full
(Sad thing is that it is difficult to distinguish the parody from the original).
Re: MikeN (Oct 28 16:11),
I would like to add my praise for this comment/parody. It did truly make me LAUGH OUT LOUD.
Fabulous parody, MikeN!
I find it interesting to note that no SH teams have ever participated in olympic hockey.
At least according to Wikipedia (the abattoir of all knowledge).
Australia played in 1960, but were outscored 87-10 in six games, finishing dead last. Probably why they haven’t been back.
Okay, I should have said no SH teams have ever competed in olympic hockey.
Jeff,
But some Australian teams have participated in Australian hockey sticks, for which I apologise on behalf of scientific minded Australians, if they accept me as a representative.
Jeff, you must mean ice hockey. In Field Hockey, both Australia and NZ have won gold medals at the Olympics.
Ice hockey is played in both countries, but there’s no national league and very restricted places to play.
Darwin Ice Hockey world champions
Maybe a field hockey stick would be better. That way you could never be certain if modern temperatures were the same or higher than the reconstructions and you wouldn’t be allowed to shoot left.
I”m exhausted (and disgusted) just READING about this! The level of duplicity is incredible. Practiced. Hat’s off to you Sir for unraveling this. Southern Hemisphere reconstruction – without a Southern proxy.
That isn’t an oversight, that’s a way of life.
I think it’s even worse than that: I think there’s a good chance that scientists working in the discipline actually believe it’s legitimate. Look at the furore that doesn’t accompany teleconnections; at the outraged total silence that followed Steig et al 2009 smearing temperatures over a continent; at the vacuum of protest over inverted Tiljander.
How small the jump from continent to hemisphere (and beyond), especially when the answer is “consistent with” the facts?
Next up on the front cover of Nature: how Narnia’s unprecedented rolling back of The Long Winter is correlated with urban development in Ankkh-Morpork, and Big Elf’s exploitation of Mithril in Middle Earth
I think there’s a good chance ‘scientists working in the discipline’ have different thoughts in their heart of hearts than they can afford to disclose publicly. This will come out when the political protection for the ‘way of life’ is removed. How that will happen is the really interesting question. Steve’s magnificent work here over many years is surely a necessary but not a sufficient condition of that.
Richard Telfort will not like this
Steve, Thank you for putting this into such detailed context.

Here are some actual figures from Australia, New South Wales, including some early temperatures from newspaper archives.
These are averages of mean temperatures converted where needed from degF to degC.
The point of the table shown here is the variation between estimates of Tmean at towns, at various times.
The range for a town can be as large as the total range shown on IPCC Figure 5.7, your first graph. These temperatures were measured with instruments. not with less accurate proxies.
………………..
Forgive me if I see a mostly manufactured signal swimming in a sea of noise as IPCC Figure 5.7.
To me, it means nothing scientific. Which, I guess, was your point.
Thanks, Steve. You’re in fine form.
Grammar nitpick: Should the sentence immediately preceding the CONCLUSION,
say instead “… the IPCC reconstructions in Figure 5.7 did not contain|include|use any Antarctic isotope data covering the medieval period.”
Well, Mr. McIntyre, I am wondering if you are slipping: More than once in your main post you used the term “remarkably similar” without accreditation to the trademark of climate science. I am just a little concerned.
Steve: in this case, they are remarkably similar. “remarkably similar (TM-climate science” applies in cases where there are two seemingly unrelated squiggles.
Here in Oz we know the problem only too well-
http://en.wikipedia.org/wiki/Reversed_map
Them uppity northern carpetbaggers. Long live the South!
There’s an episode in season 4 of The West Wing that includes a plot concering a group called Cartographers for Social Equality who demand that atlases be redrawn with the southern hemisphere on the top in order to foster a change in attitudes to that hemisphere. Is there now a group called Climate Scientists for Social Equality?
Yes, only it’s not called that, it’s simply called “climate scientists”
I read all the comments hoping for Nic Lewis – nada:)
The SH contributes “only” half of the world’s global temperature data, so what is all the fuss about. Anyway only a few climate scientists actually live or measure there so who cares?
/sarc off
Great place to up global temperatures “unseen” though.
Screw Teleconnections. There is more cross contamination between hemispheres than most people realize.
Heh.
“I tell this nation that, as things stand today, brains and brawn are better than even bets or beer.”
Australian Prime Minister Curtin on February 16, 1942.
H/t Cecil Brown.
==========
Thanks, Steve. A post to add to your all-time classics.
Isn’t this also a problem of the originating author declaring their proxy as unfit for temperature, taking it off the table out-of-the-gates regardless of what others looking at it might determine themselves? There have been several cores and the like that have suffered this fate. What then, short of publishing a reanalysis putting it back on the table in the literature, or even traveling to various locations and generating/validating ones own proxies?
I’m lost for words.
It seems lake sediments aren’t the only thing the IPCC can get upside-down- they even managed the magnificent, surely (Ig)Nobel-worthy feat of upending the planet!
I’m waiting for a comment from @MichaelEMann.
They know any casual reader is more likely to look at, remember, and be affected by the chart than the text. This is the kind of slanted view they constantly provide the outside world. Every little questionable decision and assumption seems to go only one way, and they all add up.
Thank you Steve, another excellent piece of work. What is an upside down pea called?
‘Oh, East is East, and West is West, and never the twain shall meet…’
‘If you can keep your wits about you while all others are losing theirs, and blaming you. . . . The world will be yours and everything in it, what’s more, you’ll be a Man my son’
(Rudyard Kipling)
—————–
Perhaps Keith may want to bring these snippets up to date?
Marcia Wyatt’s critique at Judith Curry’s blog included this nugget:
“From a few samples of long-dead moss exposed by a couple of receding ancient ice caps atop Baffin Island to the conclusion of unprecedented global warming due to mankind, the reasoning is intricate. Many assumptions made.”
Terse.
Re: Matt Skaggs (Oct 29 12:35),
Long-dead moss exposed.
The reasoning is intricate.
Many assumptions.
Marcia Wyatt: “…the reasoning is intricate.”
Ms Wyatt must be very bright. It’s not often that a useful new phrase is invented. I really love the concept of intricate reasoning.
And thank you, Matt for noticing it.
Rats, I just realized I posted this in the wrong thread. Wyatt was talking about Miller’s moss, not Mann’s morass.
Great work, Steve. Keep up the wonderful forensic work on IPCC and their “researchers”. You should get the Nobel prize for “truth in climate science”, when they decide to make such an award.
The figure caption shows that this is quite correct. See where it says “all latitudes”, etc.? This would of course also include xºS latitudes.
I found the following words at RealClimate in an old discussion of Mann 2008.
“You need proxies that are a) well-dated, b) have some fidelity to a climate variable of interest, c) have been calibrated to those variable(s), d) that are then composited together somehow, and e) that the composite has been validated against the instrumental record. ”
Does this mean that the proxies don’t need a relation to location of interest. I don’t think Schmidt meant that a proxie should be used without relation of where that proxie was obtained.
I think they first did an Eastern H recon, then a Western H recon, added the two together and divided by two to get the Southern H recon. Isn’t that OK?
No Don,
It’s an Argand diagram. The correct formula is (iWest – iEast)/2
Steve, assuming the IPCC reconstructions are those termed “composite” by Mann, I think there are actually more than five Mannian reconstructions contributing to Ma08eivl: those (“validated”, see below) SH reconstructions that used iCRU -target. iCRU is the same as the CRU target except the empty grid cells were Mannian interpolated before calculating the hemispheric mean.
However, I still think you are too kind here. Mann’s composite consists only those parts of the series that passed Mannian “validation” . AFAIK none of the “only SH proxies” -reconstructions passed “validation” before AD1300 (e.g., sh_shful_cru starts AD1300 and sh_shscr_cru starts AD1400)! In other words, using Mann’s terminology, “skillful SH reconstructions are not possible without NH proxies before AD1300”.
It is also funny to notice how “robust” these Mannian reconstructions are with respect to his own weird metrics: e.g. sh_glful_nodendr_cru starts AD500 but sh_glful_nodendr_icru didn’t “validate” before AD1500!
Re Chucks very pertinent question
“I am not an engineer or scientist but am I to understand that Mann used Northern Hemisphere proxies to construct a Southern Hemisphere hockey stick?”
Could we please have a yes or a no *did he use ANY NH proxy to construct SH HS?
Steve: yes. that’s what the post was about. He didn’t just use “some” NH proxies: the overwhelming majority of proxies in the SH reconstruction are from the Northern Hemisphere.
It is somewhat disappointing to notice that almost nine years after the comment IPCC has done exactly that to Mann’s reconstruction. Only seven months later that it was pointed out that the grafting was done in Marcott et al. On the positive side, they didn’t plot the uncertainties for the instrumental splice as Marcott did. Speaking of that, nobody answered correcly to my question. I’ll give the answer in a day or two so those interested can still (re)try to figure it out 🙂
Steve: I’m stumped. Glad that the tradition of Mannian confidence intervals lives on.
Exciting 🙂
I’ll have a punt. I’m guessing the uncertainties have been brought forward to 0BP along with the re-dated data. That gets to 1950 and then from there the uncertainty at that point is simply projected forward.
Its a guess but might inspire others to try 😉
They do look remarkably similar to the ones magicked up for MBH98.
Re: Jean S (Oct 29 17:22),
the answer is here.
There you say “Mann had screwed up with his CSV-files by extendind[sic] his AD1800 uncertainties over to the spliced instrumental (1850-2006). ”
Are you saying that he calculated uncertainties based on the instrumental data, as if it were part of the reconstruction data? Or that the uncertainties of the original instrumental data were used?
Re: James Smyth (Nov 1 10:33),
not really. This is more like a simple cut&paste mistake in Excel. The Mannian uncertainties are a single (2 sigma) value for all years in a reconstruction step. The last AD1800 step is for the years 1801-2006. But Mann doesn’t have the reconstruction in the spreadsheet column for the years 1801-2006, instead he has the reconstruction only for the years 1801-1849 and the target (instrumental splice) for the rest of the years. So when he copied the AD1800 uncertainty value to the spreadsheet, he should have only copied it for the years corresponding to the reconstruction (1801-1849) but instead he copied the value for all the years (1801-2006).
One really needs to understand the overly complicated Mannian calculations to spot this mistake especially in the original files. Apparently Marcott did not really understand Mann’s methods. I do not blame him for that … getting familiar with Mann08 is a work of weeks or months, not hours or days.
Jean: we are all grateful for you having spent the time. I’m not going to say “We are not worthy!”(hehe) but you have contributed great value to this blog and our understanding of these issues. Thank you very much.
Jean S: Thanks!
Mannian snowman: http://grandmaideas.com/wp-content/uploads/2012/12/Upside-down-snowman.jpg
Completely awesome!! It’s like measuring engine temperature by putting a faulty thermometer in the ‘boot’ and manually reading it with rose colored glasses.
One of the moderators disliked how I characterized Mann the other day, but the point still stands:
At some point those PhDs who intend to emerge from the climate-science slough of despond with something of a reputation will need to distance themselves from Mann’s work.
Oh Mann, what a piece of work art thou.
Jeremy, me thinks that the good mann read the two lines following “What a piece of work is man” and identified with them:
“How noble in reason, how infinite in faculty! In form and moving how express and admirable! In action how like an angel, in apprehension how like a god! The beauty of the world. The paragon of animals.”
Hamlet, Act 2, Scene 2 page 13.
Of course, we know how Hamlet ended.
Yes, editorializing but it seems so apropos.
Heck, if the IPCC can use bristlecone pines in the American southwest as a proxy for temperatures in the Southern Hemisphere for periods of time going back a thousand years and more, then surely I, Beta Blocker, can use Central England Temperature (CET), the longest instrumental temperature record we have, as a proxy for estimating rates of change in worldwide GMT between 1772 and 1975.
http://i1301.photobucket.com/albums/ag108/Beta-Blocker/CET/AR5-Figure-1-4–and–CET-1772-2013_zps02652542.png~original
The AGW alarmists I work with every day tell me this graph “has nothing to do with science.” I beg to differ, obviously.
You know I initially read that comment with GMT refering to Greenwich Mean Time. Time and Central England Temperature would be an odd comparison. Albeit one that seems entirely in line with Mannian statistics
Who knows what all might be included in Mann’s special version of RegEM.
Relativistic time travel, possibly?
So we have identified (thanks to Follow the Money) that PS04bore is also NH.
What about LO12glac ?
LO12Glac is actually SH. It comes from Leclerq & Oerlemans 2012: Global and hemispheric temperature reconstruction from glacier length fluctuations. Clim Dyn (2012) 38:1065–1079.
(http://link.springer.com/article/10.1007%2Fs00382-011-1145-7#page-1)
The shape of the curve shows that it is the SH reconstruction (based on 60 glaciers, none in Antarctica, compareed to 248 in the NH). However the amplitude is different and the mid-20th century plateu in the original seems to have disappeared so a certain amount of ‘adjustment’ has presumably taken place.
I have learned a lot about proxies from CA.
Now, I discover that the NH is a proxy for the SH! What a wonderful world.
We in the SH are relieved. Think of the money we’ll save on climate research.
Thanks, Steve.
Gergis, Karoly, et al. can re-brand themselves as Mann’s PR flacks….. oh wait, they already did so…..
how about another SH climate psycience rap video???
With the money we’ll save, we could run to a full length biopic about the saintly Gergis, Karoly, Flannery et al and have plenty of change left over.
Oh, and there’ll be no need to mention Antarctic ice, since Arctic ice explains everything. Being as how it’s a “proxy” and all.
I recently intercepted the following e-mail
From: RA@wishful_thinking.com
To: MichaelMann@Dream_the_dream.com
Dear Dr Mann,
In accordance with your recent instructions to find a beach propery in Tahiti I’m pleased to inform you that we have been successful in our search and have located what we believe is the ideal property with amazing sea scapes. It is located near Iqaluit in Nunavut, we assume however that given your tele-connection powers the property in question will meet your requirements, we await your instructions
Yours sincerely,
Roger Allcomers
Fix-em, Screw-em and Be’blowed
The “new age” real estate agency.
Steve your patienece and skill in uncovering these “slight mistakes” is so very much appreciated.
And so Mann confused the hemispheres….Mhmhmh: ignorance or stupidity?
OT but important. Someone slipped Donna Laframboise a draft of the IPCC WG 2 SPM. The links are at the end.
“New IPCC Leak – Working Group 2′s Summary for Policymakers
November 1, 2013 at 8:42 am
At the end of March next year, the Intergovernmental Panel on Climate Change (IPCC) will release installment #2 of its latest climate assessment.
An anonymous person has sent me a copy of the final draft of the Summary for Policymakers for that section. Dated four days ago, the IPCC believes this document should remain secret.
I think the public has a right to examine it. It’s important to be able to compare what IPCC personnel have written in this draft to what the final, non-draft version will say when it’s released to much fanfare next March.
In between, there will be another multi-day meeting in which this draft document will get re-written/sanitized/torqued line-by-line by diplomats, politicians, and bureaucrats. The media and the public will be excluded from that meeting yet representatives of activist green groups will be allowed to attend as observors.
This 20-page document is 7 mb and so may take a minute or two to download:”
(Sorry but you will have to copy and paste.R.)
Click to access wgiiar5-spm_fgdall.pdf
and
https://docs.google.com/file/d/0B3J65opoNdSuSnMzU1h2ZXVQSEU/edit?usp=sharing&pli=1
If you “print” a restricted pdf-document as “pdf”, the restrictions will be gone in the new document.
The use of black to represent instrumental temperatures is a trick that needs to be ended. It makes it impossible to read the end of the proxies, and gives the impression of runaway temperatures, which is the intended result. It looks like these proxies show an elevated Medieval Warm Period compared to modern temperatures, which is surprising given the source material.
Steve: high MWP-ness in this dset comes from Curtis’ lake sediments in central America, which sometimes gets weighted enough under Mannian RegEM regpar retention to countervail the bristlecones and contaminated Finnish sediments.
What is the point of having sh_glful and sh_shful networks? Doesn’t the sh stand for Southern Hemisphere?
Is he using teleconnections to say that Northern Hemisphere proxies are responding to temperatures in the Southern Hemisphere, and are thus indicative of Southern temperatures?
Steve: the sh prefix is the hemisphere being “reconstructed”. The glful network uses both NH and SH proxies (gl) while shful uses only SH proxies. It’s hard to see whether there was a thought out rationale for any of Mann’s procedures nor can it be assumed that the procedures are consistent. The idea that NH proxies can be used to reconstruct SH temperature would seem to require that climate experience globally synchronous changes. On the other hand, Mann argues that his work shows the opposite.
Didn’t he use nearest gridcell temperature for calibration?
So you need to know Northern temperatures to build Southern reconstruction.
I have a feeling there is a new censored directory that contains nh_shful and sh_nhful
Re: MikeN (Nov 4 16:32),
No, calibration is with respect to the target, i.e., the hemisphere mean instrumental series (after some mannipulation). Even screening is not using the nearest grid cell:
If someone wants to get into Mann’s screening, this is IMO a rather good starting point:
Notice from comments how the understanding what’s actually been done gradually grows in the comment section. A warning: apart from the problems mentioned in those comments, there were some additional problems in replicating the screening correlation calculations. If I recall correctly, even the grid cell selection (selecting two closest grid cells to the proxy location) was actually not working as intended.
What’s the physical basis for insisting that reconstructions are limited to a Northern and Southern Hemisphere?
I don’t mean this as a sarcastic question. Putting myself in the place of someone with zero knowledge on the subject (a vanishingly small adjustment), why is a split between NH and SH reconstructions de rigueur? Why aren’t reconstructions routinely based on longitudinal separation.
Is it mainly underlying physics / geography / long-standing features of the climate ala ENSO?
Is it long established historical convention, held to as a way of allowing some form of consistency so historical reconstructions can be compared?
I suppose my real question is, is there any reasonable physical basis for sticking proxies into buckets according to longitude?
I suspect it is because of the percentage land difference between the two continents, and also that Mann started with NH reconstruction for lack of proxies.
@MikeN
Thanks. Following in his footsteps then, no need to let an absence of data halt SH reconstructions, when you can snaffle them from the NH.
“Records like these don’t grow in trees – you’ve got to pick a proxy or two, boys”
Well, I’m waiting: I really prefer the kind of posts and comments on the Miller paper, where supporters showed up and did (IMHO) a pretty good job of defending the paper. Here there is nothing but silence? Have there been responses to it anywhere? It seems too egregious to be tolerated. If Steve’s criticisms are correct (I’m never competent to judge) why aren’t believers in AGW screaming to get this fixed in AR5? Do they want it to be a laughing-stock?