I’m going to Erice next week and will be talking about proxies over the Holocene, a topic that I’ve been studying for a few years, but not written much about. In today’s post, I’m going to discuss Greenland ice core d18O over the Holocene and comment on very inaccurate commentary from Skeptical Science about GISP2, which criticized errors by Don Easterbrook but made matters worse.
Vinther 2009
When trying to interpret proxies, if possible, I try to identify “good” proxies and use them to interpret lower quality proxies, emulating the practice of exploration geophysicists and geologists. I haven’t tried to codify how to tell whether a particular proxy is “good”, though it might be possible to extract criteria from the cases. A common law approach, so to speak.
Vinther et al 2009 (Nature) showed that the d18O series at the small glacier on Ellesmere Island (Agassiz) showed a much larger decrease in d18O values over the Holocene than similar series from the Greenland summit (GISP2, GRIP). Vinther argued that climate over the northern ice sheets was sufficiently uniform that it was not reasonable to armwavingly attribute this to “regional” variability – a common catch-all in the field. Vinther argued (very plausibly in my opinion) that the discrepancy arose from an elevation decrease of approximately 160-190 meters over the Holocene at the summit, with negligible change at the small peripheral glacier.
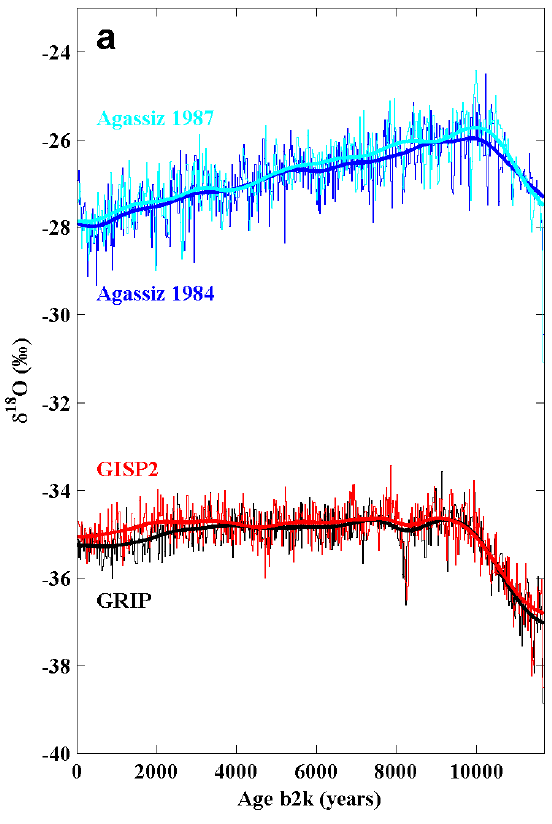
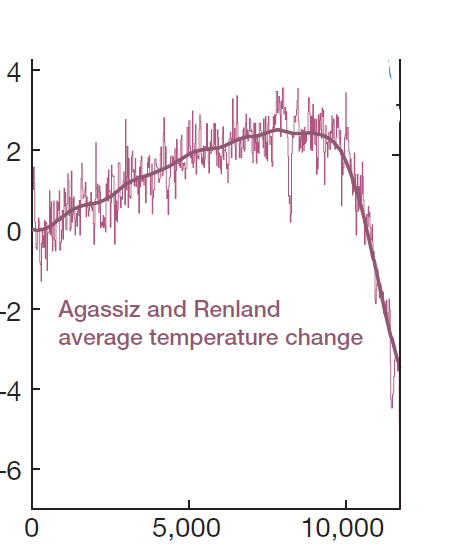
Vinther argued that elevation change at the Ellesmere Island glacier was negligible relative to the main Greenland ice sheet. Vinther noted that Ellesmere Island had experienced isostatic uplift over the Holocene, but this too was an order of magnitude less than the estimated elevation changes at the summit. Using independent data on uplift, Vinther constructed an uplift-corrected series at Agassiz. Vinther also observed that the Renland glacier, though in Greenland, was not part of the main icesheet and could be considered similarly to Agassiz. Vinther combined the two series to create a temperature estimate over the Holocene as shown below. The series appears to close with a slight retreat from a large uptick. The data is a 20-year series with the uptick at 1940 with a slight retreat to 1960 when the series shown here ends. Renland and Agassiz data both continue into the 1980s, so it’s natural to wonder at the behaviour of the data in the last half of the 20th century.
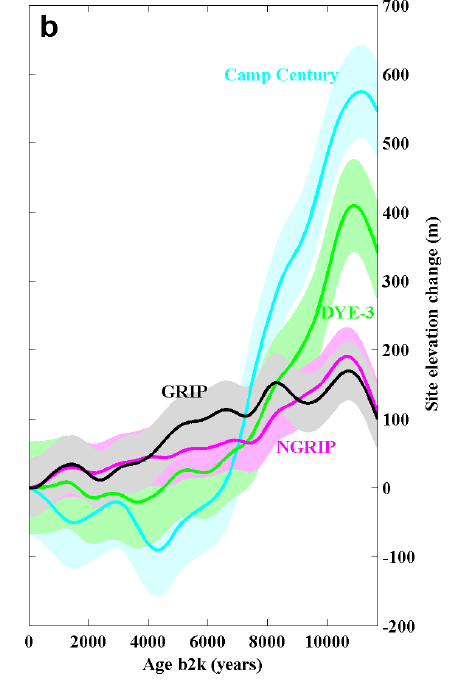
Vinther also estimated elevation changes at the main Greenland ice core locations, showing elevation decrease over the Holocene at GRIP (very close to GISP2) of nearly 20 m, with considerably greater decreases at more coastal locations of Dye-3 and Camp Century.
The data in for Vinther’s temperature reconstruction is archived here, a series with 20-year resolution, which has an uptick at 1940 with a slight retreat to 1960 when the series shown here. Renland and Agassiz data both continue into the 1980s, so it’s natural to wonder at the behaviour of the data in the last half of the 20th century. Both Renland and Agassiz data appear in various resolutions. Vinther et al 2009 worked with 20-year data (see here), but higher resolution recent data is available. For Renland, a 5-year version was archived in connection with Kaufman et al 2009 (see here) and annual data up to 1986 made available in connection with Kinnard et al 2011 and by Ljungqvist.
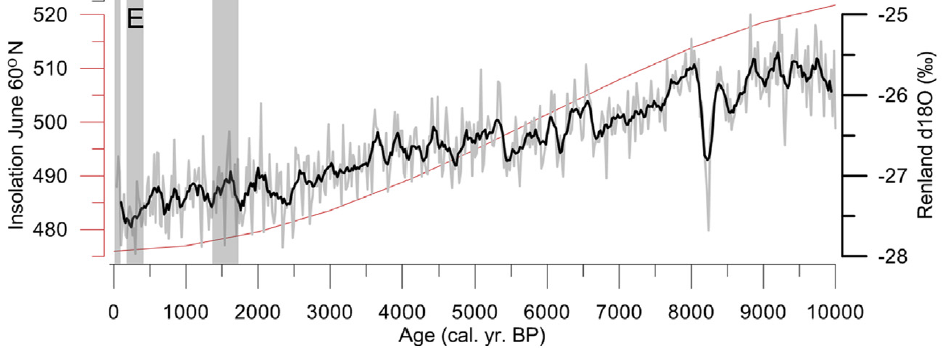
Figure 3 below shows Renland d18O values on three scales. In the left panel, the 20-year data, which ends in 1960, is shown. In the right panel, the annual data is plotted, with overlays of 5-year and 20-year data. The closing value of the 20-year series is shown as a solid red dot and the closing value of the 5-year series as a solid black dot. In the 25 years of data subsequent to the most recent value in the Vinther et al 2009 20-year series, d18O values have declined somewhat. I’ve marked the closing 5-year value back on the left panel 20-year data as a solid black dot to show that it hasn’t jumped up suddenly in the more recent values. Compared to the most recent values in the Renland series – and even compared to the high values around 1940 – late 20th century values remain lower than values throughout most of the Holocene.
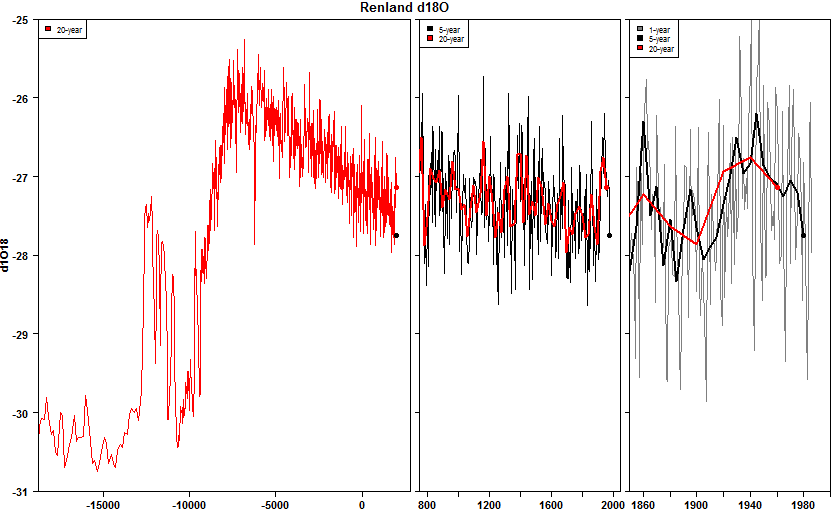
Figure 3. Renland d18O in three zooms, showing 20-year, 5-year and annual plots.
Incorporating more recent data, there appears to be a retreat from the closing uptick of the Vinther et al 2009 temperature reconstruction series, but, either way, there is no indication that Renland d18O values have departed from Milankowitch bounds. It would obviously be nice to have more recent d18O values from Greenland, but, to my knowledge – and I’ve searched diligently, there is not a single Greenland ice core d18O measurement archived value more recent than 1995.
GISP2 Versions
Like Renland, GISP2 was drilled in the 1980s and isotope data is available up to 1987. In 1998, Holocene data at 20-year resolution (ending in 1980) was archived here, accompanied by annual data ending in 1987 here. The 20-year data matches the GISP2 data plotted in the first figure of this post.
In addition to the isotope data, Cuffey and Clow (1997) published a temperature reconstruction from GISP2, which I discuss here because of subsequent controversy. They combined isotope data with inversions of horehole temperature. From time to time, I’ve discussed borehole temperature inversions, always noting that such estimates involve inversion of near-singular matrices and that they are FAR more unstable than recognized in the accompanying academic literature. I am very doubtful that combining borehole temperature inversions with isotope data is an improvement. Nor did Cuffey and Clow compensate for elevation changes. One sees that the Cuffey and Clow reconstruction is heavily smoothed relative to even the 20-year d18O data. In addition, it ends in 1855 AD (see bottom right panel). The highest 20-year average in the right panel is in 1940, with the 1980 value similar to 19th century values.
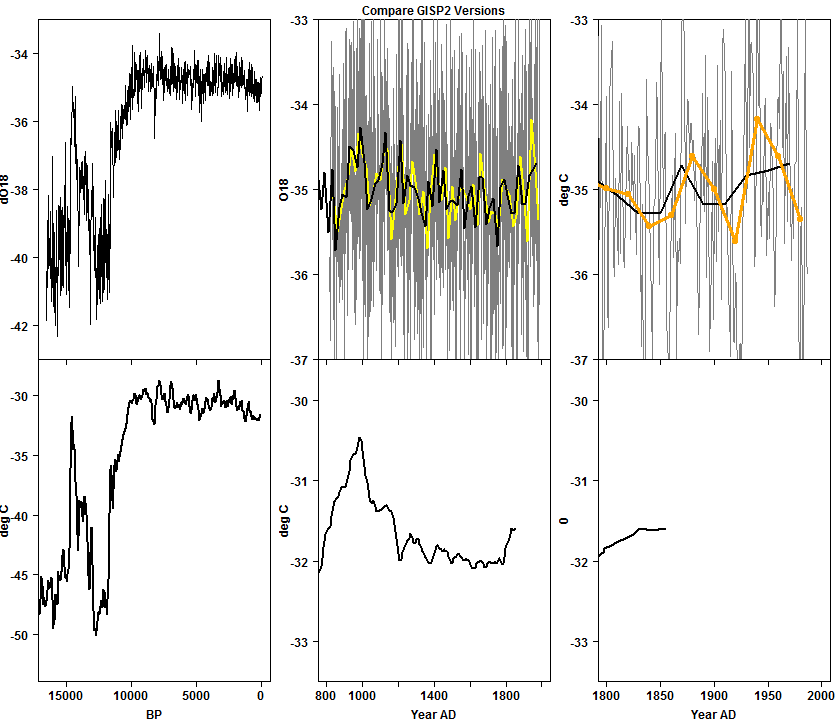
Figure ^. Comparison of GISP2 Versions. Top panels – GISP2 d18O data on three different scales. Bottom panels – temperature reconstructions of Cuffey and Clow 1997 on same scales. Yellow/orange in top panels is 20-year averages calculated from annual data, centered on 1980,1960,…..
Because these versions of GISP2 data do not adjust for elevation changes, they do not show a Holocene decline comparable to the Vinther temperature reconstruction – the conundrum that prompted Vinther et al 2009. However, if the isotope values were adjusted for estimated elevation changes, the data would (by construction) have the same long-term decline as Vinther et al 2009.
Skeptic and Warmist Controversy
For comparison of present-day circumstances to the Holocene, the Cuffey and Clow version of this data seems like a particularly poor choice, not least because its construction from the underlying isotope data is very obscure, making it almost impossible to compare to updated isotope data. Nonetheless, it has been a favorite among certain skeptics, who have further muddied matters by inaccuracies in their usage.
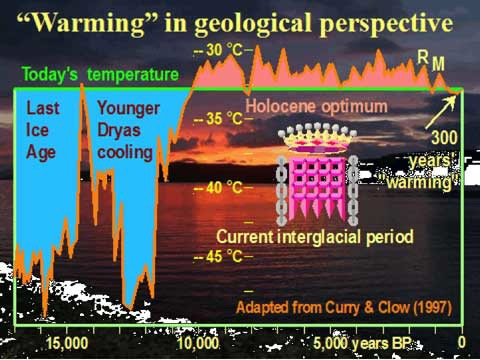
Don Easterbrook used this series in a 2010 WUWT post (and several other locations e.g. here), rendered in the following graphic. This transcribes the underlying temperature reconstruction but, in the absence of clear information in the archive, incorrectly interpreted “before present” as years prior to 2000, rather than years prior to 1950, moving the entire series 50 years too far to the present. The actual isotope data does not increase dramatically subsequent to the end of the Cuffey-Clow reconstruction, but Easterbrook’s diagram ought to be labelled years before 1950. Obviously, a reconstruction ending in AD1850 says relatively little about modern-Holocene relationships – one of the reasons why I considered this series to be a poor choice for such comparisons.

The same Cuffey and Clow series (incorrectly attributed to Curry and Clow, 1997) had been previously made into a singularly rococo version by Christopher Monckton (here), in which the close of the series was incorrectly shown as 0 BP, whereas it was 95 BP in the original series.
The erroneous dates in the graphics from Monckton and Easterbrook were quickly noticed by the warmist blog Hot Topic, who needless to say, sneered at the error e.g. here here here here here. However, Hot Topic’s understanding of the data was, if anything, even worse.
Hot Topic disregarded Easterbrook’s assertion that GISP2 data went up to 1987 (which it did), repeatedly stating that the data stopped in 1855 (the last date of the Cuffey Clow temperature reconstruction, but not the GISP2 data). Based on this incorrect belief, Hot Topic then committed a far more egregious misinterpretation. Notice the blade (uptick) at the modern end of the Cuffey-Clow temperature reconstruction, labeled “the hidden incline”.
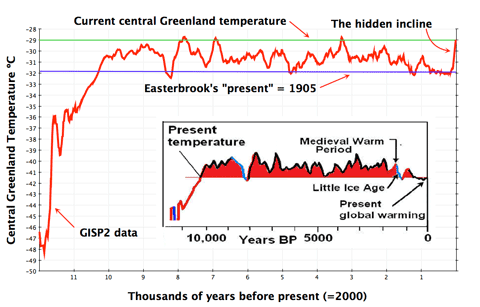
However, Gareth’s supposedly “hidden incline” doesn’t exist in the isotope data. Gareth created it (See here)by splicing instrumental data to proxy data which, in the Cuffey-Clow version ended in 1855 even though GISP2 isotope data was available to 1987.
The difference between the green and blue lines is the warming that Easterbrook wants to ignore. His statement that temperatures for almost all of the past 10,000 years have been warmer than present is shown to be complete nonsense. There are three points in the last 10,000 years when temperatures high up on the Greenland ice sheet were similar to today, but by no stretch of anyone’s imagination can it be said to have been warmer for most of the time. The incline he’s trying to hide is one of the largest and steepest in the last ten millenia…
CA readers will, of course, recall Mann’s notorious (and untrue) assertion shortly after the start of realclimate that researchers had never spliced temperature and proxy data:
No researchers in this field have ever, to our knowledge, “grafted the thermometer record onto” any reconstruction. It is somewhat disappointing to find this specious claim (which we usually find originating from industry-funded climate disinformation websites) appearing in this forum.
This claim later attracted renewed interest during Climategate since Mike’s Nature Trick included a splice of proxy and instrumental data to construct the smoothed series (readers need to take care to precisely describe the trick, since splicing is only part of the trick – consult CA here). Despite Gareth’s criticisms implied by the term “hidden incline”, Gareth’s “hidden incline” was actually constructed by the first stage of Mike’s Nature Trick -splicing instrumental and proxy data.
Conclusion
Returning to the underlying question of the Greenland isotope data over the Holocene,
From the perspective of the isotope data itself, d18O values into the 1980s have not escaped the Milankowitch bounds. Whatever the true relationship of modern temperatures to mid-Holocene temperatures
Gareth’s splicing trick (of 2.5 deg K) is even more egregious.
/


