In the wake of COP21, I thought that it would be interesting to compare the respective pathways of China and the U.S (and others) based on official data. I still plan to post on this topic, but obtaining official data on the pathways proved much more difficult than I anticipated. Leading into the COP21 conference on October 31, 2015, the UNFCCC Secretariat published its “Synthesis report on the aggregate effect of the intended nationally determined contributions”, the terms of reference of which were described as follows:
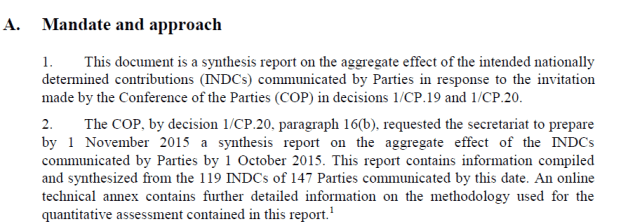
The UNFCCC Synthesis Report was 66 pages long. However, it contained zero information on the commitments of the individual countries or even regions. Searching for such information will be the topic of today’s post.
The only relevant quantitative information in the UNFCCC Synthesis Report was on global emissions for several past years and projected levels in 2025 and 2030 as follows:
 …
…
Not a shred of data anywhere in the Synthesis Report on commitments of individual countries.
Historical Data
The historical figures in Synthesis Report paragraph 191 shown above tie closely to the corresponding numbers in the IPCC WG3 Figure TS.1 for 1990, 2000 and 2010 (38, 40, 48 Gt) as shown below. So while there are a variety of accounting definitions of GHG emissions and one has to take care to compare apples to apples, the UNFCCC seems to have had the same unit in mind as IPCC WG3.

Figure 1: IPCC AR5 WG3 Technical Summary Figure TS.1. Total annual anthropogenic GHG emissions (GtCO2eq / yr) by groups of gases 1970 – 2010: carbon dioxide (CO2) from fossil fuel combustion and industrial processes; CO2 from Forestry and Other Land Use 4 (FOLU); methane (CH4); nitrous oxide (N2O); fluorinated gases5 covered under the Kyoto Protocol (F-gases). At the right side of the figure, GHG emissions in 2010 are shown again broken down into these components with the associated uncertainties (90 % confidence interval) indicated by the error bars. Total anthropogenic GHG emissions uncertainties are derived from the individual gas estimates as described in Chapter 5 [5.2.3.6]. Emissions are converted into CO2-equivalents based on Global Warming Potentials with a 100-year time horizon (GWP100) from the IPCC Second Assessment Report (SAR). The emissions data from FOLU represents land-based CO2 emissions from forest and peat fires and decay that approximate to the net CO2 flux from FOLU as described in Chapter 11 of this report. Average annual GHG emissions growth rates for the four decades are highlighted with the brackets. The average annual growth rate from 1970 to 2000 is 1.3 %. [Figure 1.3]
Note that “GHG” emissions reported as “CO2 equivalent” by the IPCC here also included methane, nitrous oxide, CFCs and CO2 emissions attribute to land use, land use change and forestry (LULUCF), shown above as “CO2 FOLU” (Forestry and Other Land Use). Emissions for the other gases are converted to “CO2 equivalent” according to their Global Warming Potential as estimated by IPCC.
The above totals tie very closely to historical data on emissions published by the EU – their Emissions Database for Global Atmospheric Research (EDGAR) – see here. This dataset includes historical data by country back to 1970, including separate estimates of CO2 from fossil fuel and industrial processes separately and an estimate of GHG emissions (as CO2 equivalent). The most recent data for overall GHG emissions is here; results to 2012 were published in November 2014. Data on CO2 emissions from fossil fuel and industrial processes, the largest component, is more up-to-date, with the most recent results by country up to 2014 here.
In the above graphic, I’ve overplotted the EDGAR v4.2 GHG results (red +- signs). This shows that, up to minor amendments, the IPCC TS.1 figure is showing the same thing as the EDGAR v4.2 GHG series (thus permitting the use of the EDGAR v4.2 data for more detailed analysis).
I’ve also estimated 2013 and 2014 GHG values from the corresponding CO2 (FFIP) data (magenta +-signs). The estimated 2014 value is 54.8 Gt (CO2 eq). In other words, virtually all of the agreed GHG increase to 2025 from the INDCs (to 55.2 Gt COE eq) appears to have already occurred by 2014.
UNEP Pledge Pipeline Dataset
The only recent collation of INDC pledges that I’ve been able to locate is published by UNEP – see here. Its current update (December 22, 2015) says that “160 INDCs (187 countries) are now submitted to UNFCCC”, up “from 119 until 1st October” when the Synthesis Report was issued. It links to a spreadsheet of commitments. Although the historic total for 2010 (48.9 Gt COE eq excluding LULUCF; 49.8 Gt COE eq including) reconciles more or less to EDGAR v 4.2 values, UNEP values for individual countries do not reconcile at all. In addition, there were many missing values, even where EDGAR had 2010 values.
There were some peculiar errors. For example, 2020 emissions from the Congo were projected to equivalent to India’s and only slightly smaller than the EU’s. However, this was due to a conversion error from Mt COE eq to Gt COE eq, in which UNEP incorrectly divided by 100, rather than 1000. Given that this particular error was the same order of magnitude as the projected yield of the INDCs, one naturally wondered whether it had any impact and, if not, how the corrective plug worked.

A plugged line “Not Accounted For” particularly caught my eye – this ought to ring red bells for any data analyst and one would have expected that one of the 40,000+ COP21 would have paid attention to it. The values of this were surprisingly high: over 11 Gt COE eq in 2010 (over 20%) of the total – an amazingly high value given availability of EDGAR v4.2 data. The values were suspiciously variable: why would the values decline by over 50% going from 2020 to 2030. Nor did the formulas for the plugged terms make any sense: I’ve highlighted the formula for 2020 incl LULUCF, which shows a plugged term of 10000 Mt CO2 eq less seven terms for individual countries, none of which made any sense. The corresponding term for 2020 with low reductions was completely different. (The values shown below come from a screenshot of the spreadsheet which shows selected rows and columns).

A couple of days ago, I notified Joergen Fenhann of UNEP of the Congo error, receiving a short thanking acknowledgement. I followed up on December 21 with questions about the plugged values:
The line item for Not accounted for has a plugged value from which some country values are deducted. Where does this plugged value come from? Why are some countries deducted but not others?
Fenhann did not reply to my question on December 21. However, this morning, I noticed that UNEP made major changes to their spreadsheet – without any notice of that a prior error had been corrected and, needless to say, without any acknowledgement. The 2020 MtCO2eq emissions (incl LULUCF) are now 63944 MT versus the former 58524 Mt, an overnight increase of 5.4 Gt.

The plugged values no longer contain the peculiar deductions for seemingly arbitrary countries and are now “explained” as “Data added in order to get the same totals as in UNEP Gap Report 2014”. In a future post, I’ll try to determine the impact of this plug.
Conclusion
It seems really odd to me that the UNFCCC Synthesis Report did not contain supporting information showing emissions by country. UNEP has a spreadsheet purporting to do so, but unfortunately it contains large plugged values, country errors and does not reconcile immediately to published historical data.
Nonetheless, it can be used as a basis for comparing the pathways between countries of interest, which I will do in a forthcoming post for China relative to the U.S. and EU, a post in which I’ll consider some of Naomi Oreskes’ attempt to divert attention away from Chinese coal consumption.


67 Comments
Through gridded teeth
He Who Must Not Be Named
Isn’t, nor the changes
He didn’t (of course) cause.
Lesser outfits would be concerned about preserving an audit trail.
This one has a higher purpose: to elimate the auditor trail.
(I think I’m done now. Greater minds and wordsmiths to follow.)
Thanks!
Glad you’re on this case.
I commented on this at Jennifer Marohasy’s blog using info from the USA govt’s EIA.
Neville December 20, 2015 at 10:41 am #
It’s interesting to look at the growth in HUMAN co2 emissions since 1980 to 2012 ( 33 years ) from Obama govt’s EIA.
In 1980 OECD 11.2 Giga tonnes- Non OECD 7.3 GTs.
In 1990 OECD 11.6 GTs- Non OECD 10.0 GTs.
In 2000 OECD 13.2 GTs- Non OECD 10.8 GTs.
In 2010 OECD 13.1 GTS- Non OECD 18.0 GTs.
In 2012 OECD 12.9 GTS- Non OECD 19.5 GTs. 2012 is the last available year.
The OECD is the developed western countries and the Non OECD are developing countries like China, India etc. But in the 33 years 1980 to 2012 the Non OECD has increased co2 emissions at a rate of over 7 times the OECD countries. OECD= 1.7 GTs per annum and Non OECD= 12.2 GTs per annum. Just shows you what nonsense we’ve been fed by pollies and the MSM over the last few decades.
OH and the EIA projections show that by 2040 human emissions will increase from 2012 32.4 GTs to about 45 GTs by 2040. And only about 1 GT pa of new emissions will come from the OECD and about 11.6 GT pa will come from the Non OECD 25 years from now.
http://www.eia.gov/cfapps/ipdbproject/iedindex3.cfm?tid=90&pid=44&aid=8&cid=CG6,CG5,&syid=1980&eyid=2012&unit=MMTCD
The warmist greens have a big problem approaching. CO2 will go up, but the developed world isn’t going to be the problem. “Naming and shaming” will have to be redirected …. to the developing worlf of China, India and Africa. Who are the supposed victims. How do the optics work with that?
Here are co2 emissions per country from 1980 to 2012 according to USA govt’s EIA.
http://www.eia.gov/cfapps/ipdbproject/iedindex3.cfm?tid=90&pid=44&aid=8&cid=CG6,CG5,&syid=1980&eyid=2012&unit=MMTCD
Steve: there are numerous datasets and I looked at many of them already. The problem is trying to find ones that tie into the UNFCCC and IPCC data. The US govt EIA data for CO2 emissions doesn’t necessarily match IPCC/UNFCCC GHG emissions for CO2 equivalent though it’s related. Also this doesnt tie in to UNFCCC projections. With tens of thousands of people in Paris, you’d think that some one would have prepared a coherent dataset.
Do homework? What does Steve expect? /sarc
Most of the times I dig into an eco-alarmist claim I find they don’t do their homework, or worse.
(Worse being slicing and dicing areas and species until they can claim a problem.)
Steve You probably realise the figures for CH4 are BS. CH4 is no more of a greenhouse gas than NO see for example Table 5-9 in Perry’s chemical Engineering handbook or my post https://cementafriend.wordpress.com/2015/09/ The IPCC assumes that CH4 burns in the atmosphere (it does not plain to note by its existence) and counts the H2O formed when the IPCC assumes H20 is not a greenhouse gas. The whole CO2 equivalence is nonsense beside the radiation absorption of CO2 (when plugged into Prof Hoyt Hottel’s equation (P-CEH equation 5-154) is insignificant or unmeasurable) No one at the IPCC including advisors has any understanding of the basics of heat&mass transfer.
I don’t suppose that they were “working back” from a previously “established” value and just filled in where appropriate to get the desired total?
Looking at these EIA graphs it would seem that total Non OECD ( China, India and developing countries) will account for over 90% of future human Co2 emissions until 2040. The OECD countries have been almost flat- lining for decades and will probably only increase by about 1 bn tonnes pa by 2040. See page 21 at this link.
Click to access sieminski_07252013.pdf
Yes, that was what I’m planning to write about.
Working hypothesis: the lack of a consistent, centralised dataset of estimates of the root cause of “the greatest challenge humanity’s ever faced” is precisely because nobody wants this 90% non-OECD contribution to be easily discoverable and referenceable. Because, given the “Annex 1” and “Annex 2” division of countries coming out of Rio and Kyoto, it makes the clear the futility of global emission reduction and the irrelevance of the tiny, though already highly expensive, reductions by the western nations.
It took a LONG time for Wikipedia to have its list of countries by CO2 emissions show China as the top emitter. Then some commenters complained about how biased the page was for showing this.
At the beginning of summer 2009, Wikipedia was showing 2004 emissions.
The implications of that make me think that science will move towards the B&R theory, where temperature increase is based on growth in CO2 emissions and not actual level.
This is why I gave up trying to follow emissions 7 years ago and began focusing on energy consumption. Emission counts are too easy to game and energy consumption is more accurately measured.
FWIW I show energy consumption rising from 523 quads in 2010 to close to a thousand by 2030-2035. OECD energy consumption rises very slightly while developing countries rise by 4.19% annually. (My estimates are an outlier. the EIA estimates 819 quads by 2040, the IEA and BP quite close to theirs.)
Although warming is a ‘gobal’ (regional, actually) issue, the solution is not. The top 5 emitters will account for 404 of the EIA’s 819 quads by 2040 and 41% of all emissions by 2040, while the second 5 will account for 11%.
Thomas, considering the required amount of emissions cuts is about 90%, that would make it a global issue.
Hiya MikeN,
That may be ‘required’, but it isn’t feasible without societal collapse this century. What can be done is Fast Mitigation this half century while developing nuclear and other alternatives.
In any event, if China, the U.S., India, Russia and Japan don’t go all in on the issue, there is no point in Mali or Madagascar doing anything at all.
China alone accounted for 30% of global CO2 emissions while India tallied only 6.5% or about one fifth of the former in 2015. Hong Kong is always listed separate in these kind of statistics strangely. Still, PR China stays the darling of the CC crowd as it produces lots of solar panels and promised the Moon. These same people want to deny India its Industrial Revolution although it has about the lowest CO2 emissions per capita on this planet.
Click to access pbl-2015-trends-in-global-co2-emisions_2015-report_01803.pdf
I have also tried to look at the makeup of the total UNIPCC and UNFCCC figures by country. There are a number of sources of estimates, and with the PledgesPipelineToWeb.xlsx you have provided another.
For the historical figures, I assumed that the UNFCCC would use their own data. For all the major countries they have provided a briefing, which was published with the INDC submissions. These can be found by searching “UNFCCC Country Brief xxxxx“. These can differ from the other data sets and from the data within the INDC submissions. The discrepancy with the country submissions is likely to reason for not providing a detailed breakdown by country. The most extreme discrepancy I found was for Indonesia for 2005. The broadest measure of GHG emissions for 2005 in MtCO2e is UNFCCC 2826, Edgar 1171, WRI CAIT 2.0 1584 & Indonesian Govt INDC 1800. Now UNEP comes up with a figure of 1791.4. So the Edgar data may be approximately the same in total, but in some cases is widely different from the UNFCCC country briefs. Table, with links, is here.
Steve: interesting parsing of Indonesian data. In one sense, it illustrates the problem in trying to arrive at consistent data. But surely the tens of thousands of people working on these issues would have some consistent data somewhere.
According to the media China had underestimated its emissions by 17%. The latest total for China from the EIA for 2012 was about 8.1 billion tonnes pa.
So 17% added to that would be about an extra 1.3 billion tonnes pa.
http://www.eia.gov/cfapps/ipdbproject/iedindex3.cfm?tid=90&pid=44&aid=8&cid=CG6,CG5,&syid=1980&eyid=2012&unit=MMTCD
Here is the NY Times report on China’s undisclosed burning of an extra 17% of coal.
For a breakdown of individual countries the nearest I can find is climateactiontracker dot org. A briefing published on 1st October 2015 states
The 2030 estimate is pretty much in line with UNFCCC’s 53.1 to 58.6 GtCO2e when you allow for the different historical measurement basis – probably from the WRI CAIT 2.0 data. CAT does provide country analysis for 32 countries. Of note is the analysis for India. The current estimate of 2030 GHG emissions from CAT is far lower than that derived from India’s INDC (linked to from the CAT page), particularly deriving estimates from GDP forecast on the table on page 5, and allowing for reductions in emissions per unit of GDP.
Reasons for not providing emissions estimates with policy pledges include the different measures of emissions; the lack of clarity in the INDCs; and the likely lower marginal impact of policy pledges on global emissions than that estimated.
Steve: I didn’t see anything in the link that showed a breakdown by country.
Steve, did you try the pdf “CAT INDCs warming” at the top? It provides another link to their assessment of the INDC by country, with further links.
Steve: I don’t see any consistent dataset here. If you believe that this site contains a dataset with consistent historical and projected data, please provide me a precise link.
Steve,
If there is some consistent data I have yet to find it. To control global emissions needs a standard. I would have thought that the UN would have set one but even the UNFCCC and UNEP seem to be working from different estimation methods.
As usual, according to paragraph 191, these are all estimates not measurements and there are no error bars. This is not science recognizable to anyone in the physical sciences and engineering.
Steve: At this point, I’m simply looking for consistent estimates. I’m not sure how one would put error bars on them and this is of lesser concern to me. In 1990, could you have put error bars on estimates of Chinese CO2 emissions in 2015?
What do they stick into the models? Are they real measurements?
I was working with a top climate model in 2002, that had an economics component built in. One thing that struck me in model runs was how China becomes the big emitter, with about 40% of emissions. It became a leading emitter around 2016. They missed by a decade for something that was just a few years away.
Steve: interesting parsing of Indonesian data. In one sense, it illustrates the problem in trying to arrive at consistent data. But surely the tens of thousands of people working on these issues would have some consistent data somewhere.
That a consistent, coherent, supportive data set(s) can not be readily located would seem to support the argument that CO2 and global warming is almost entirely a political argument. Indeed, I would prefer that such a data set is readily located. The contrary is just so cynical!
It looks like James Hansen was right, this COP 21 agreement is BS and a fraud. There is no chance of mitigating their so called CAGW when one side is nearly flat-lining until 2040 and the other side is emitting as much as they please.
https://imgflip.com/i/w9sl8
This trade market that UN has established about GHG emissions is a complete nonsense. But, of course, no one in the UN is going to clarify anything to you Mr. McIntyre. (If UN officials send you emails talking transparently about UN business: they will be fired).
We ought to have a central data base with easily accessible history and forecast by individual gases or particulates.
By the way, I have tried to estimate future emissions based on my own estimated fossil resources. This requires a breakdown of the liquid hydrocarbon streams. But I wonder if the IPCC RCP models can differentiate between say asphalt and ethane?
I cannot find “Figure 1” as “IPCC AR5 WG3 Technical Summary Figure TS.1” Maybe I’m looking at the wrong docs. But the same graph appears as “Figure SPM.1” in the Summary for Policy Makers.
The optics that jump out at me is, first, you are right EDGAR data is used. Second, on what basis do the graphical artistes base all the CO2 perturbations to the theoretical “CO2 FOLU” source? FOLU = Forestry and Other Land Uses. Look at the peaks in the EDGAR readings at about 1998, 1992, and backward. Each corresponds with an increase in man-sourced CO2 FOLU–nothing else. What account for this? Does EDGAR project contain such information? What’s the game here?
They list Edgar only occasionally as a source. What are NC1, NC2, and UNFCCC?
The UNEP pledge pipeline spreadsheet (three last images in the post) has another major incoherence: the total CO2eq emissions are basically the same with and without land use. In fact, for 1990 and 2005 emissions are stated as higher EXCLUDING land use – an obvious absurdity, though it’d be great news if farming and deforestation actually reduced emissions.
For 2010 they have the contribution of land use approximately at one additional Gigatonne CO2eq, or 2% of emissions. And for 2020 this jumps to 4Gt, which is an additional 7.5% compared to the excluding-land-use figure; put other way, land-use is slightly under 7% of the total emissions.
Weirdly enough, after your email they changed the numbers for all the years but the pattern persists:
-1990 and 2005 have higher emissions excluding land use than including it
-In 2010, land use adds about 2% to emissions
-In 2020, it adds about 9% (so land use is about 8% of the total)
(I just checked and at least this part of the spreadsheet hasn’t been updated since your post)
Notice that even the 2020 contribution from land use appears to be too low compared to the IPCC figure – the former has land use as making up 11% of total emissions in 2010, presumably not down much by 2020. So while the UNFCCC spreadsheet uses similar total values to the IPCC and EU/EDGAR, the way they arrive at this total is much different.
Regarding the ‘not accounted for’ figure, I find their update hilarious: quite simply, they needed to get the same figures as other researchers and so they plugged in a bunch of numbers. My guess is many or most countries submitted incomplete emission counts, perhaps accounting only for emissions from fossil fuel use and failing to ‘estimate’ the more tenuous methane, land use and nitrogen dioxide categories. But on the other hand, if anything I’d have guessed that countries would try to overstate their current emissions, not understate them, so that future ’emission decreases’ (or decreases in the rate of growth!) would take less effort.
‘Notice that even the 2020 contribution from land use appears to be too low compared to the IPCC figure – the former has land use as making up 11% of total emissions in 2010’
That should read THE LATTER, meaning the IPCC, meaning the first chart in the post.
“a post in which I’ll consider some of Naomi Oreskes’ attempt to divert attention away from Chinese coal consumption”
This scientist is making nifty side business out of the CC variety of Apocalypse scenarios: http://www.collapseofwesternciv.org/
In her new science fiction/ horror story amazingly China comes out best on Earth after 2093 “thanks” to Mao´s old adagio that political power comes from the barrel of a gun. By single-mindedly focusing on CO2 she neglected the enormous Chinese NOx and PM 2.5 emissions which are actually killing thousands of Chinese since years. http://www.motherjones.com/environment/2014/07/inquiring-minds-naomi-oreskes-collapse-of-western-civilization
Another good article from Dr Judith Curry looking at the temp record since 1850 and what influence could be attributed to human co2 emissions. She asks what caused the warming from 1910 to 1945 ( 40% of warming since 1910) and the cooling from 1945 to 1976?
http://business.financialpost.com/fp-comment/unnatural-consensus-on-climate-change
Also Dr Lomborg’s peer reviewed study showed that the COP 21 agreement would show no measurable difference to temp by 2100. In fact just 0.05 C in 85 years time and at a cost of endless trillions dollars for no measurable difference to global temps. Here’s part of his analysis ————
Dr. Lomborg’s research reveals:
The climate impact of all Paris INDC promises is minuscule: if we measure the impact of every nation fulfilling every promise by 2030, the total temperature reduction will be 0.048°C (0.086°F) by 2100.
Even if we assume that these promises would be extended for another 70 years, there is still little impact: if every nation fulfills every promise by 2030, and continues to fulfill these promises faithfully until the end of the century, and there is no ‘CO₂ leakage’ to non-committed nations, the entirety of the Paris promises will reduce temperature rises by just 0.17°C (0.306°F) by 2100.
US climate policies, in the most optimistic circumstances, fully achieved and adhered to throughout the century, will reduce global temperatures by 0.031°C (0.057°F) by 2100.
EU climate policies, in the most optimistic circumstances, fully achieved and adhered to throughout the century, will reduce global temperatures by 0.053°C (0.096°F) by 2100.
China climate policies, in the most optimistic circumstances, fully achieved and adhered to throughout the century, will reduce global temperatures by 0.048°C (0.086°F) by 2100.
The rest of the world’s climate policies, in the most optimistic circumstances, fully achieved and adhered to throughout the century, will reduce global temperatures by 0.036°C (0.064°F) by 2100.
Here is a link to his PR study————–
http://www.lomborg.com/press-release-research-reveals-negligible-impact-of-paris-climate-promises
Interesting that Lomborg exposes a problem with the optimistic forecast of Christiana Figueres Ex Sec of the UNFCCC . He makes the point that to limit the temp rise to 2.7 C would take co2 reductions of 3,000 GTs, but her own UNFCCC claims reductions of 33 GTs. Wishful thinking indeed. Here’s his quote————
“Figueres’ own organization estimates the Paris promises will reduce emissions by 33Gt CO₂ in total. To limit rises to 2.7°C, about 3,000Gt CO₂ would need to be reduced – or about 100 times more than the Paris commitments (see figure below). That is not optimism; it is wishful thinking.”
Happy New Year, Steve.
Thanks, Tom. I’ve been very sick for the past few days. It started with a cold on Christmas. Got some over-the-counter remedies: Benadryl All-in-One. Then I got what was later diagnosed as a bacterial ear infection. I was up all night coughing. I’ve been sick from time to time, but do not remember seeing each 10 minutes pass all night. Went to the clinic and the doctor prescribed an antibiotic for the bacterial infection and a once-per-day nose spray. Was up all night once again, saw every 15-30 minute interval all night. Was now really exhausted, went back to the clinic. The doctor said that I now had a tertiary bronchial infection, prescribed a stronger antibiotic and a prescription (hydrocodone) for the cough. It settled the cough down really well but had very unsettling mental side-effects on me. My mind wouldn’t stop racing. It was quite troubling. Once again, I was unable to sleep though the intervals were up to about 50 minutes. It turns out that others have experienced this with hydrocodone (and more generally as a component of sleep disorder). The internet is great for locating such common experiences. So I stopped the hydrocodone after one day. The aching pain of the ear infection has subsided, but I’m fatigued beyond imagination. Usually days seem to pass fairly quickly, because I’m working on things, but today seemingly passed very slowly in 15-minutes. I’m hoping that I can finally get something resembling a sleep tonight.
I’ve never experienced anything remotely like this before. On other occasions, the flu might not have been any fun, but the night didn’t pass in 15 minute increments.
I think I used it once when it was prescribed after I went in with what I thought was pneumonia. Experienced something similar.
For stuffy nose, just use Sinex. I usually go with the Robitussin chest and cough if it is serious otherwise just use hot soups.
From my first day of Pharmacology … a drug is a poison that may have beneficial side effects.
Happy New Year, Steve. Please get proper rest.
The Concordia University study found that there has been a warming of 0.7 C linked to Co2 emissions since 1750. They found that the top 20 countries were responsible for about 82% of that warming. Here is a list of those countries and the warming contribution since the start of the Industrial revolution. EG Australia contributed 0.006 C and Canada 0.013 C .
http://berc.berkeley.edu/ranking-global-warming-contributions-by-country/
Here is the Concordia study link. http://iopscience.iop.org/article/10.1088/1748-9326/9/1/014010/pdf;jsessionid=7452CF9C7135E5CE0070EEEF21762EF7.c2.iopscience.cld.iop.org
Here is the abstract from the study———
Abstract
There is considerable interest in identifying national contributions to global warming as a way
of allocating historical responsibility for observed climate change. This task is made difficult
by uncertainty associated with national estimates of historical emissions, as well as by
difficulty in estimating the climate response to emissions of gases with widely varying
atmospheric lifetimes. Here, we present a new estimate of national contributions to observed
climate warming, including CO2 emissions from fossil fuels and landuse
change, as well as
methane, nitrous oxide and sulfate aerosol emissions While some countries’ warming
contributions are reasonably well defined by fossil fuel CO2 emissions, many countries have
dominant contributions from landuse
CO2 and nonCO2
greenhouse gas emissions,
emphasizing the importance of both deforestation and agriculture as components of a
country’s contribution to climate warming. Furthermore, because of their short atmospheric
lifetime, recent sulfate aerosol emissions have a large impact on a country’s current climate
contribution We show also that there are vast disparities in both total and percapita
climate
contributions among countries, and that across most developed countries, percapita
contributions are not currently consistent with attempts to restrict global temperature change
to less than 2 C above preindustrial
temperatures
Retired 2 years.
Each 5 mL of Benadryl Chesty Cough & Nasal Congestion contains 30 mg of pseudoephedrine hydrochloride as the active ingredients. ALL IN ONE CONTAINS 60 mg of pseudoephedrine hydrochloride . This amphetamine like drug may be what was stopping you sleeping and making you feel upset [besides the illness]
I would try to get some prednisolone [steroid] tablets 5 mgms bd for a few days from your GP.
Could also make you to awake but in a much gentler way and takes away blocked nose cough and muscle ache.
Good to settle eustachian tube blockage re ear infection works over 24 H.
Not good in diabetics or if cataract problems.
Codeine type tablets muddle the thinking and make you tired sand constipated. Stick to the paracetamol.
Ear infections in adults can take 2 weeks to settle. CXR if coughing a lot and feeling worse
Have a better new year
thanks for this.
I had also been prescribed mometasone as a nasal spray. The first doctor said to take it once a day. The second visit upped the dose to three times a day. Does this do something similar to the steriod that you suggested.
In any event, things are considerably better today after finally managing to get some sleep.
Interesting that the ear infection can take so long to clear up. I have an antibiotic prescription for 2 weeks.
Didn’t know about the higher aphetamine in ALL-IN-One. The cough has hugely subsided though still there. What would you suggest just for the cough.
Sorry to read about your health tribulations!
As you noted, many/most of the cold/cough over-the-counter remedies contain combinations of active ingredients. Personally, I like to have the active ingredients separated into individual medicines so I can tailor the active ingredients to my needs at the time.
Some useful info from the familydoctor.org website:
“What types of OTC cough medicines are available?”
“Over-the-counter (OTC) medicines are medicines you can buy without a prescription from your doctor. There are 2 types of OTC cough medicines: antitussives and expectorants. A common antitussive is dextromethorphan … The only expectorant available in OTC products is guaifenesin …
How do OTC cough medicines work?”
“Antitussives are cough suppressants. They relieve your cough by blocking the cough reflex. Expectorants thin mucus. This may help your cough clear the mucus from your airway. Drinking extra fluids also helps keep mucus thin.”
The site goes on to note that pseudoephedrine and other decongestants may actually make coughing worse, with their drying effect thickening the mucus. (I’ve also had the “racing” effect from pseudoephedrine-type decongestnts and now stay away from them)
When I’ve had a cough that interfered with sleeping, I’ve had good results using either a 4-hour or 12-hour (extended release) dosing of OTC guaifenesin, which thins the mucus and for me greatly lessens the coughing episodes on its own.
Of course, your mileage may vary — hope you find something that works for you. As a side note, lack of sleep is known to negatively affect the immune system’s function as well as other aspects of health, so if you feel persistently tired, you might consider having a sleep evaluation done in a “sleep lab”. Basically, you get instrumented and sleep in a lab for a night so the doctors can spot whether there’s some obvious (and treatable) physical or health issue that’s causing problems with your sleep.
The explanation of the various components has been very helpful. The worst of this has definitely passed though I’m not better.
Yesterday, I took an antihistamine (Reactine) and a Tylenol. Night was hardly perfect: I had to get up to cough 3-4 times, but I seem to have slept in between and am moderately refreshed today. The residual problem seems to be the one that you describe: I’m going to try the OTC guaifenesin as well. I guess the end product will be to reconstruct the original thing minus the pseudoephedrine.
Yes, I need to go to a sleep clinic. I definitely have sleep apnea. I got a prescription for a sleep clinic a couple of years ago, but never followed up. I will this time.
Steve: I am sorry to hear of your sleep and health tribulations. As for sleep studies, you can get the basic diagnostic equipment and assessment on line for a fraction of the cost of an in-hospital study – if such a study is not covered by your health program. My own experience with a formal sleep study was underwhelming. They made me go to bed too early and I was wired up to the nth degree. I asked for the data they used for their assessment and they said they couldn’t share it! Very strange.
I’m sorry you’ve been unwell Steve and I hope you get better soon. There is nothing worse than infections and not being able to get a good nights sleep. I’ve been there before and know what you are going through. All the best and a speedy recovery.
Steve, I’ve never posted here before, but I follow your blog avidly. Get well soon and warmest regards to you and your family. We need you fighting fit!
Had a much better night last night. After three nights of virtually no sleep, I was very fearful.
During the day, I googled “mind racing unable to sleep”. One site had a post entitled How to get to sleep when your mind won’t stop racing. (http://bodymindconspiracy.com/how-to-get-to-sleep-when-your-mind-wont-stop-racing/). One of its sections read:
Exactly.
He had a meditation for sleep (http://bodymindconspiracy.com/guided-meditation-for-sleep/) that he recommended for racing mind.
Went to bed about 10:15, working hard to stay up despite the fatigue. I put the meditation on my phone and connected the ear buds and hoped for the best. Tried the relaxation. There was a cough tension that was irremovable, but could feel relaxation in other muscles. Went through about 4 cycles, then had a coughing fit. But it was 12:40 by then so I was encouraged. One more session. Next coughing fit was 2 a.m, but wasn’t too bad. I think that I had one more coughing fit that I didn’t time. Woke up again with another coughing session. I checked, fearing the result, but it was 6:40 am. I’d not only slept, but, for the first time in days, had probably had some proper sleep.
I don’t sleep well normally. I usually deal with mind racing by working on problems in my head, but have been tired for years. Until this incident, I’d never thought about mind racing as a problem, but I understand now that it is something that can probably be dealt with
well, you do tend to run rings round your critics 🙂
The side of my face is paralyzed from removal of my facial nerve. Ear and eye infections were a regular occurrence as my body was unable to naturally deal with them.
Over the years the best solution for the ear has been crushed garlic in olive oil. This is administered by drops into the ear at the first signs of infection and to date (about 4yrs) infections have all failed to materialize.
Prior to this antibiotics were gradually becoming less effective and infections started to develop regardless.
The only downside is the aroma you will carry around with you:)
Sorry to find you were unwell, Steve. Your condition sounded literally nightmarish, and it’s a good to know you’re doing better.
I’ve had a few ear infections, and have found that they can be cleared up in a few days using triple antibiotic on a small piece of cotton put right into the ear.
In the US, triple antibiotic is available over the counter in a petroleum gel, and includes bacitracin, neomycin, and polymyxin. It’s been very effective.
The cotton bit can be small enough so that you don’t really feel it. That makes it physically non-irritating, so that it can be kept in place during the day and night.
The cotton insert can be refreshed every 12 hours or so. The antibiotic charge typically gets absorbed during that time. I usually keep up the treatment until 2-3 days after the symptoms completely disappear. One wants a 100% cure so as to not cultivate antibiotic-resistant bacteria.
If one wants to make the antibiotic stronger, a capsule of prescription antibiotic can be mixed into a 1/4 cubic inch (4 cc) glob of triple antibiotic. Mixing can be done using the stick-side of an ear swab, or a martini swizzle-stick if you’re inclined to celebrations. The augmented glob can be conveniently stored in a small pill box, and kept in the refrigerator.
This method has the advantage of putting the antibiotic right near the locus of infection. One then needn’t put up with systemic effects, including killing off most of one’s intestinal flora.
To help sleep, one might try 5 mg of melatonin at bed time. Melatonin is native to the brain, and produced by the pineal gland. It signals the brain for time of sleep onset, and typically induces drowsiness. It’s likewise available over the counter in the US.
Melatonin is also a first-rate antioxidant, and likely protects the brain against certain degenerative consequences of oxygen metabolism.
I have been in touch with Prof. Russ Reiter about melatonin supplements. He researches the field.
I asked him whether taking melatonin might cause degeneration of the pineal gland. He replied there were no known negative consequences. His complete reply was, “I know of no reliable data showing that the pineal gland declines in function or degenerates when melatonin is used as a supplement. I subscribe exactly to the ideas of Bruce Ames. In that regard, melatonin has very specific actions in the mitochondria to protect them from oxidative damage.”
Bruce Ames, by the way, has spent much of his career studying the effects of antioxidants on cell function. Ames also wrote the classic paper, “Dietary Pesticides (99.99% all natural),” showing that naturally occurring pesticides, made by plants in their eternal war against insect predators, hugely dominate the human diet and are every bit as toxic as human-produced synthetics. The green irony of that bit of intelligence seems right up your alley. 🙂 Our edvolutionary sophisticated liver typically detoxifies them efficiently.
Anyway, best wishes for a successful and healthy 2016.
I, too, have had sleeping problems (largely associated with age). The best help I’ve found is a Tylenol PM and a 3mg time-release melatonin. My experience has been that this combination at bedtime added about an hour’s sleep, a precious amount for me. I find the time-released melatonin was more effective in keeping me asleep. I have been using this combination for nine years with no apparent side effects. Oh, BTW, I think you’ll find the melatonin may cause “technicolor” dreams. Not nightmares, but perhaps a bit more vivid.
Steve, let me add my best wishes as well to the list of those who value you and all your work.
Hi Steve,
I have had extreme sleeping issues episodes that appear to be substantially different than yours, but just in case my experiences might help, I will give them.
1. I had a minor cough during a visit to Beijing that wouldn’t stop. I literally went three days without sleeping at all because the cough just wouldn’t stop. (Believe it or not, I couldn’t find any Benadryl in Beijing, and my fiance, who was a Chinese doctor, gave me valium, which was not a good experience.) When I got back to the US, I found out that I had acid reflux. Omneprazole (sp) took care of the problem.
2. This is different from your non-sleeping issue, but it is something you may want to consider in looking at the big picture. 15 years ago, I had something close to migraines every day, and I had to rest for 2 or 3 hours every day to get rid of them. I started exercising regularly (exercise bike and weights) and they went away for about 12 years. About 4 months ago, I would tend to get nasty headaches every Saturday. I changed my weight-lifting from 1 day to 2 days a week (7days a week exercise bicycle) and have had zero headaches since then. I sleep very well, but when I need to I can get by on 4 or 5 hours sleep now. In the past, 4 or 5 hours of sleep meant an almost automatic nasty headache. My basic point here is that exercise appears, in my case, to be very good for the brain.
3. It used to take me 20-40 minutes to relax and go to sleep even when I was very tired. Now I listen to programs I like without commercials,( right now “House” on Netflix.) I cover my eyes while listening to the program on my tablet. I go to sleep in about 3-4 minutes. The idea here is to distract yourself from thinking about sleeping. What works for me is listening to programs I like on the Internet. I don’t think about sleeping at all, and I go to sleep very quickly. You might want to give it a shot.
Hope that some of this provides a little bit of help to you. Good luck dealing with this nasty problem.
JD
Steve: thanks. Your three days in Peking without sleep must have felt like mine. It’s comforting somehow to realize the issue isn’t necessarily uncommon. I agree that exercise really helps. I haven’t been playing as much squash this year and have done a little gym work to compensate, but need to do it regularly.
Arggh… to complicate things and this is worrying, this incident has affected my hearing quite a bit. My wife noticed that I had the TV volume on really high – at about 30 versus the 13-15 that I usually have it at. I’m not hearing softly spoken language at all. I hope that this is temporary because of the ear infection. Maybe Anthony will know. It’s amazing how he’s superceded his hearing disability.
One of the most positive pieces of news of the last 18 months in climate, broadly defined! (I was going to say 2015 but Google saved me.) Surely a temporary problem in your case Steve.
Sorry to hear of your illness Steve.I agree with Angech, that the culprit is likely pseudoephedrine. I have had exactly the same experience as you after taking an oral decongestant with pseudoephedrine- totally wired and unable to sleep.I avoid the all-in-ones now and just stick with individual meds to address specific symptoms- ibuprofen or acetaminophen for aches/pain/fever, nasal spray for congestion and antihistamine for runny nose/nasal drip(only at night since it makes you drowsy). The chronic nasal drip frequently irritates the throat and causes coughing, so antihistamine usually resolves this as well. Good luck and look forward to you getting better and to your next post!
I have taken 5 milligrams of Melatonin for years (I am 79 now) and find that I sleep very well. I also take 200 milligrams of Gabapentin for a problem I have with restless leg syndrome. Works like a charm.
Had an ear infection two months ago Antibiotics cleared it up in about ten days. Very painful. I would stay the hell away from hydrocodone. Bad stuff.
I’ve followed your column for many years (decades?) now, and I really appreciate your efforts. I read through the comments to your latest post in hopes of determining the meaning of “plugged” values in a spreadsheet, and, to my surprise, the conversation drifted into your recent, and hopefully soon-to-be-cured, health problems. Even more surprising were all the helpful contributions your readers made for possible cures, ranging from medicines to meditations.
From the context, I take it that “plugged” means to insert a value into a cell that ensures the remaining data is internally consistent, say satisfying some conservation of mass criteria. Or, in the case of AGW enthusiasts, establishing a needed trend over some period of years to support a fundamentally flawed analysis. We called this cheating 50 years ago, but spreadsheets were still 20 years in the future, and with the passage of time, cultures stumble.
The health notes were quite revealing. I appreciated a previous comment by rovingbroker … “a drug is a poison that may have beneficial side effects.” But the meditation link was really interesting. I have recently, say for the last three years, been experiencing the restlessness you described. The need to deal with the Pavlovian aspects of my response was a valuable insight.
I began solving Sudoku puzzles in a serious way about four years ago, just to reassure myself that I could still learn things, (I’m at an age where such concerns raise their ugly heads,) and so far I continue to make progress. When I get up due to restlessness, I usually read something or hack away at some project, but then I finish up with a puzzle or two. I find that if I’m ready to sleep, I usually doze off in the middle of a puzzle, and awakening ten or fifteen minutes later, so go to bed. But now I find that if I don’t have Hard puzzle solved within a normal amount of time, I’m liable to nod off! Pavlovian! I’m glad I didn’t use driving my car around the neighborhood as my cure to restlessness!
Just to throw in more random unprofessional medical advice/personal anecdotes. I have struggled with both sleep apnea and insomnia for many years.
1. Get tested ASAP. Until you research it, it’s hard to appreciate how dangerous and disruptive sleep apnea can be to ones’ well being. I knew I had sleep apnea for over 25 years without dealing with it.
I never realized how serious it was and I had never looked into it. Now that I treat it, I am a completely different person. It is quite painful to realize that I lost a huge part of my life, living in fatigue, depression, and with nervous tension when I did not have to.
When I left the sleep testing center five years ago after the split test, where the second half of the evening was used to calibrate the CPAP, the world seemed in sharper focus. The difference in having experienced my first deep REM in years was striking.
2. I’ve always been a night owl and do not receive a healthy dose of sunlight. For the past couple of years I have been going to a tanning salon once or twice a week for natural Vitamin D generation. It has noticeably improved my ability to sleep longer hours.
short comments
Otitis media which you had is an inner ear infection, much more common and shorter in children, less common in adults but when bad takes time to clear.
Ignore any ear drop advice. That is for otitis externa, not related to viral or bacterial respiratory infections. Put nothing in the ear.
Sleep apnoea? see a sleep physician, usually need to lose weight, lose patients saying this but better than the other treatments.
Trouble sleeping? no easy answer either. More exercise, 1/2-1 hour walk a day helps sleep and weight loss, need to persist.
It may just be normal for you, The pseudephedrine exacerbated the symptoms and you may be alright when your health improves. Sorry to stir up a medical debate and thanks to all who offered help. best to leave it to Steve and his doctors though and concentrate on the post.
Please feel free to remove my comments/advice as not blog related and too personal, sorry
I am very interested in seeing the updated if not final version of this evaluation. Best of luck with the study. Do you have any idea when you will publish it?
And good luck with the inner ear and sleep problems, I have heard that it can result from too much serious thinking about global warming, which many of us have experienced too.
2 Trackbacks
[…] https://climateaudit.org/2015/12/23/cop21-emission-projections/#more-21573 […]
[…] reached our target! To get an idea of the level of confusion surrounding this issue check out this dissection of the UN’s data on per-country emissions. (Even after the revisions, as I pointed out in the comments section, it still absurdly shows more […]