In today’s post, I’m going to examine Gergis’ dubious screening out of the Law Dome d18O series, a series that has been of long-standing interest at Climate Audit (tag).
Gergis et al 2016 stated that they screened proxies according to significance of the correlation to local gridcell temperature. Law Dome d18O not only had a significant correlation to local temperature, but had a higher correlation to local instrumental temperature than:
- 24 of the 28 proxies retained by Gergis in her screened network;
- a higher t-statistic than 19 of 28 proxies retained by Gergis;
- a higher correlation and t-statistic than either of the other two long proxies (Mt Read, Oroko Swamp tree ring chronologies);
Nonetheless, the Law Dome d18O series was excluded from the Gergis et al network. Gergis effected her exclusion of Law Dome not because of deficient temperature correlation, but through an additional arbitrary screening criterion, which excluded Law Dome d18O, but no other proxy in the screened network.
This is not the first occasion in which IPCC authors have arbitrarily excluded Law Dome d18O. CA readers may recall Climategate revelations on the contortions of IPCC AR4 Lead Authors to keep Law Dome out of the AR4 diagram illustrating long Southern Hemisphere proxies (see CA post here).
Law Dome d18O is intrinsically an extremely interesting proxy for readers interested in a Southern Hemisphere perspective on the Holocene (balancing the somewhat hackneyed commentary citing the Cuffey-Clow reconstruction based on GISP2 ice core in Greenland). The utility of Law Dome d18O is much reduced by inadequate publishing and archiving by the Australian Antarctic Division, a criticism that I make somewhat reluctantly since they have been polite in their correspondence with me, but ultimately unresponsive.
Gergis et al 2016 Screening
In my previous post, I criticized the data mining of Gergis et al 2016 for “significant” correlations, a technique that is aptly characterized as data torture (sensu Wagenmakers 2011, 2012), since so many possible combinations of lags and gridcells were examined. Such data mining became necessary for Gergis following the retraction of Gergis et al, 2012, since they could not obtain a network with more than a handful of proxies using the the reported screening criterion of Gergis et al 2012 and the reconstruction using that handful appears to have had a different appearance than the reconstruction reported in Gergis et al 2012.
In their attempt to salvage the earlier article within the constraint of detrended correlation, a constraint which they sought to abandon but which appears to have been rejected by the Journal of Climate, Gergis’ main tactic was a switch to correlations with local gridcells as a target, rather than the Australasian regional composite previously used in Gergis et al 2012.
Gergis et al stated that they then carried out detrended screening over the period 1931-1990, determining the “significance of the correlations” between detrended proxy and detrended gridcell temperature using a t-statistic allowing for autocorrelation. (They carried out such calculations over multiple gridcells and lags, but this data mining is not relevant to today’s issue).
For predictor selection, both proxy climate and instrumental data were linearly detrended over 1931-90. As detailed in appendix A, only records that were significantly (p <0.05) correlated with temperature variations in at least one grid cell within 500km of the proxy’s location over the 1931-90 period were selected for further analysis. For predictor selection, both proxy climate and instrumental data were linearly detrended over 1931-90…To account for proxies with seasonal definitions other than the target SONDJF season (e.g., calendar year averages), the comparisons were performed using lags of -1, 0, and +1 years for each proxy…
The significance of these correlations was determined using a Student’s t distribution, with the degrees of freedom adjusted for autocorrelation at lag 1 using the method of Bretherton et al. (1999).
For Law Dome d18O over 1931-1990 for the central gridcell at lag zero i.e. without any Gergian data mining or data torture, using the HadCRUT3v version on archive, I obtained a detrended correlation of 0.529, with a t-statistic of 4.71 3.65 (for 37 degrees of freedom after allowing for autocorrelation using the prescribed technique) [updated Sep 10, 2016]. This was one of the highest t-statistics in the entire network, higher than 24 19 of 28 proxies selected into the screened network and higher than both long proxies included in the network. It also met any plausible criterion of statistical significance.
So how (and why) did Gergis screen out Law Dome?
Gergis excluded Law Dome through the following, seemingly innocent, additional screening criterion:
This comparison [of detrended proxy to detrended instrumental data] was only performed for cells containing at least 50 years of data between 1921 and 1990.
Because a t-statistic test already allows for the number of observations in determining significance, there isn’t any need for this restriction. The choice of 50 years excluded Law Dome d18O, but did not impact any other proxy included in the G16 screened network. Gergis did not provide any justification or explanation for the choice of 50 years (as opposed to 60 years or 35 years), nor am I aware of any principle that would justify this particular choice.
In addition, because the Law Dome d18O series is available up to 2007, there is actually more than 50 years available – just not between 1921 and 1990. If Gergis really believed that additional measurements were needed to pass the relationship between Law Dome d18O and gridcell temperature, then why didn’t she use data up to 2007? Or even 2001?
Because the Gergis reconstruction has only two proxies with values prior to AD1100, inclusion of the Law Dome series would have a material impact on early values of the reconstruction. In addition, Gergis also reported results from her “R2” and “R3” reconstructions, consisting of only two and three proxies, results which would be materially impacted by inclusion of Law Dome over their entire record.
The New Law Dome d18O Series
The Law Dome d18O series, which is included in the Gergis et al 2016 prescreening archive, has interesting points of similarity and difference to the prior version (archived in 2010, after prior use in Mann and Jones 2003). The two versions are compared in the diagram below: the earlier version in the left panel, the more recent version in the right panel.
Both versions show a noticeable decline over the past 1500 years, with relatively low values in the late 20th century values and in the early 21st century in the more recent version. Late first millennium values in the version archived in 2016 are noticeably less than in the version archived in 2010. This is more than a little puzzling since both versions use the same DSS core. It’s hard to understand how the earlier sampling could lead to such different results in this earlier period. Because neither version has been formally published, there is no explanation on the record. Nor is there any explanation in any of the articles which have used or considered the new version (Neukom et al 2012, PAGES2K, Neukom et al 2014, Gergis et al 2016).
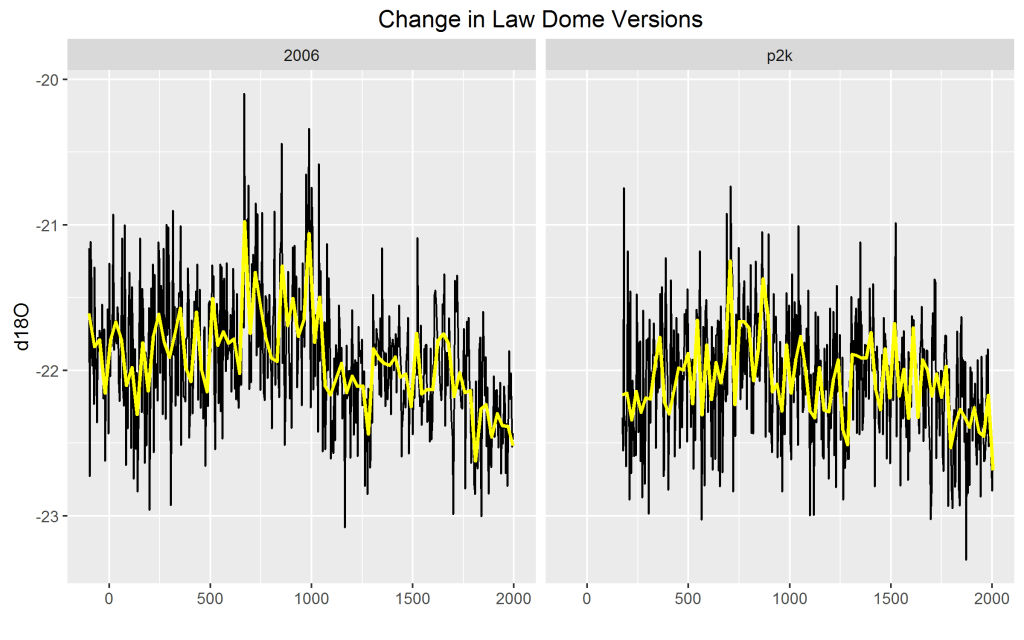
Figure 1. Law Dome d18O versions. Left – version used in Mann and Jones 2003, archived in 2010 data. Right – version used in PAGES2K. Near identical shorter (1000 on) version in Gergis et al 2016. In the right panel below, annual data is converted to 4-year averages to make comparison more direct.
Re-visiting AR4
Unfortunately, this is not the first occasion where IPCC authors have arbitrarily excluded the Law Dome series. In a previous CA post here, I discussed an earlier dispute, on which further light is shed by the present analysis.
The Second Draft of IPCC AR4 included a figure showing Southern Hemisphere proxies for the past millennium. It showed the Mt Read and Oroko Swamp tree ring series (also used in Gergis et al 2016) even though the Oroko series had been screened out of Mann and Jones 2003, but didn’t show the Law Dome d18O which had been used in Mann and Jones 2003.
In June 2006, as an AR4 reviewer, I asked that they include Law Dome d18O in the diagram. In an email to fellow AR4 authors, Tim Osborn of East Anglia, aware of the high early values of the Law Dome d18O series, reported that “sceptics wanted us to show this [Law Dome] for obvious reasons”.
Conversely, Osborn and fellow IPCC authors clearly didn’t want to show Law Dome in their diagram also, to borrow a phrase, “for obvious reasons”.
While each side may have had “obvious reasons” for wanting to show or hide this series, at the end of the day, the decision ought to be made on scientific grounds. As a supposed rationalization for exclusion of Law Dome, Osborn stated that its interpretation was “ambiguous” on the grounds that he thought, but was “not certain” that “some authors” (here citing Souney et al 2002) had interpreted it as an index of atmospheric circulation changes:
Jones/Mann showed (and Mann/Jones used in their reconstruction) an isotope record from Law Dome that is probably O18 (they say “oxygen isotopes”). This has a “cold” present-day and “warm” MWP (indeed relatively “warm” throughout the 1000-1750 period). The review comments from sceptics wanted us to show this for obvious reasons. But its interpretation is ambiguous and I think (though I’m not certain) that it has been used to indicate atmospheric circulation changes rather than temperature changes by some authors (Souney et al., JGR, 2002).
Osborn proposed that they add a reference to Law Dome in the fine print, but not show the series in the figure itself (thus “hiding the decline” in the Law Dome data.
None of the IPCC authors appears to have bothered checking out Osborn’s speculations about Souney et al 2002. Had they done so, they would have immediately discovered that Souney et al did not consider Law Dome isotope data at all; they considered sea salt (Na+) in the Law Dome core. Nor in a Southern Hemisphere context are “atmospheric circulation changes” independent of temperature changes: changes in temperature are invariably associated with atmospheric circulation changes, particularly with movements of the southern westerlies towards and away from the equator.
Coordinating Lead Author Overpeck, who was eager to minimize anything to do with the Medieval Warm Period, quickly agreed with Osborn’s recommendation, also sneering at the non-“expert”-ness of the suggestion that the Law Dome series be shown to readers:
your suggestion to leave the figure unchanged makes sense to me. Of course, we need to discuss the Law Dome ambiguity clearly and BRIEFLY in the text, and also in the response to “expert” review comments (sometimes, it is hard to use that term “expert”…). Ricardo, Tim and Keith – can you take care of this please. Nice resolution, thanks.
best, Peck
It is interesting to re-visit this exchange in light of the correlation and t-statistic reported above. The correlation (and t-statistic) between Law Dome d18O and gridcell temperature is exemplary- far better than the two tree ring series accepted by AR4 authors. There was never any valid reason for IPCC authors to exclude the Law Dome series from their diagram of Southern Hemisphere proxies.
Law Dome in a Holocene Context
Law Dome is one of the very few sites where data is available for both the early 21st century and through the Holocene. Such sites are of unique importance for assessing whether modern temperature increases have escaped the Milankowich boundaries -an issue that I regard as central to practical interest in proxies. It also provides a welcome Southern Hemisphere perspective to a topic dominated by Northern Hemisphere proxies (and, for “skeptics”, far too much by the Cuffey-Clow temperature reconstruction from GISP2 e.g. recent WUWT discussion here).
Although the deep Law Dome core was drilled between 1987 and 1993, the record is still frustratingly incomplete. The figure below combines available elements (see below figure for explanation):
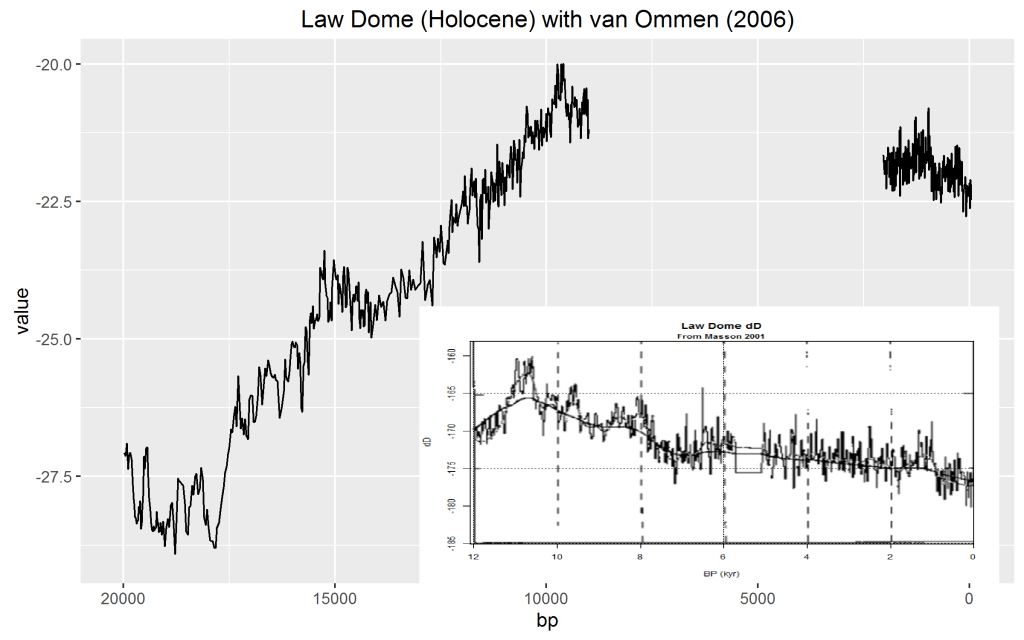
Figure 1. Law Dome d18O series (Morgan et al 2002; Tas van Ommen, email 2006, archived 2010); insert – dD from Masson et al 2000.
The main panel shows d18O values. The deglacial portion (left) shows a more or less continuous increase in d18O values from low values around 18000BP to a maximum around 9500BP. Values over the last two millennia are less than those in the early Holocene. In this figure, I’ve used the older (2010 archive version of recent d18O data since the shape seems to me to be more similar to the recent portion in the dD series in the insert figure (from Masson et al 2000). The (unarchived) Masson et al dD series also shows peak Early Holocene warmth with a gradual decline through the Holocene, with low values in the 20th century. The early Holocene maximum in the Masson et al dD series is somewhat earlier than the early Holocene maximum in the d18O series (Morgan et al 2002), but I presume that this difference in timing arises from differing dating systems for the same core. (In any event, it is not material to this post).
As a caveat on the interpretation of Holocene scale d18O series, Vinther et al 2009 convincingly showed that decreases in ice cap elevation led to long-term relative increases in d18O values (GISP2, GRIP) relative to those observed in locations with more or less constant elevation (Renland, Agassiz). A Law Dome series adjusted to have constant-elevation would therefore show an even larger decline in d18O values over the Holocene.
Conclusion
The Law Dome d18O series has a stronger correlation to gridcell temperature than 24 of 28 “passing” proxies or either of the long tree ring series used as long proxies in Gergis et al 2016. It was excluded from the Gergis et al network based on a additional arbitrary screening criterion that excluded Law Dome without impacting any other proxies in the screened network. It is not known whether Gergis et al intentionally added the additional screening criterion in order to exclude Law Dome or whether the criterion had been added without fully understanding the ramifications, with the exclusion of Law Dome being merely a happy coincidence. In either case, the exclusion is not robust. And because the Gergis et al 2016 reconstruction (R28) is based on only two proxies in its early portion, neither are its various reconstructions. The impact will be particularly felt on the R2 and R3 reconstructions, which have only two and three proxies respectively.
Just another day of data torture by the paleoclimate “community”.
The new analysis also sheds new light on AR4’s decision not to show Law Dome d18O to readers. In retrospect, it seems very clear that they didn’t want to show the decline in Law Dome d18O for fear that, to borrow a phrase, they might “dilute the message” or give “fodder to skeptics”.
Law Dome is an important location, since it is one of relatively few proxy datasets in the world which has results both through the late 20th century (actually up to 2007) and through the Holocene. I am increasingly of the view that there is relatively little purpose in examining proxy data over the last one or even two millennia without placing it in a Holocene perspective. While there is obviously ongoing “skeptic” interest in a Holocene perspective, such commentary (e.g. recent WUWT posts) is far too often limited to a Northern Hemisphere (Greenland) perspective and, in particular, to the problematic Cuffey-Clow temperature reconstruction from GISP2 (which ends in 1855, though GISP2 isotope data is available to 1987).
Because precessional forcing over the Holocene is opposite for the two hemispheres, both Southern Hemisphere and Northern Hemisphere should be shown. The Law Dome series is instructive for such comparisons. It yields an entirely different perspective on the relationship between modern and early Holocene values than the bogus Southern extratropic reconstruction of Marcott et al 2013 that has been credulously accepted by many academics.
Unfortunately, use of Law Dome d18O is compromised by inadequate publication and archiving of Law Dome d18O data by the Australian Antarctic Division. Tas van Ommen is a polite and cordial correspondent, but that only goes so far when nearly 30 years has passed without a proper publication of Law Dome d18O results.
Source Code
See: http://www.climateaudit.info/scripts/multiproxy/gergis_2016/gergis_cor_final.txt
References:
Masson et al, 2000. Holocene climate variability in Antarctica based on 11 ice-core isotopic records. Quaternary Research.
Morgan, V., M. Delmotte, T. van Ommen, J. Jouzel, J. Chappellaz,
S. Woon, V. Masson-Delmotte, and D. Raynaud. 2002. Relative Timing of Deglacial Climate Events in Antarctica and Greenland.
Neukom and Gergis, 2011. Southern Hemisphere high-resolution palaeoclimate records of the last 2000 years. The Holocene.
Neukom, Gergis et al, 2011. Multiproxy summer and winter surface air temperature field reconstructions for southern South America covering the past centuries. Climate Dynamics.
Postscript
The failure of the Australian Antarctic Division to properly publish this data is really quite puzzling. Ironically, I first sought this data in August 2003, leading to multiple promises to publish the data, none of which were fulfilled. I haven’t previously documented these efforts and do so below.
In August 2003, shortly after the publication of Mann and Jones 2003 and before anyone had heard of me, I asked Tas van Ommen of the Australian Antarctic Division for the Law Dome d18O data used in Mann and Jones 2003 as follows:
dear Dr. van Ommen, I’m studying the Mann and Jones GRL [2003] article carrying their projections back to 200 AD. Your Law Dome dO18 dataset features prominently in the compilation. I have not located this dataset at NGDC and was wondering if you could direct me to an FTP location or otherwise email me the dataset. Thanks, Steve McIntyre
Van Ommen refused to provide me the data that he had provided to Mann and Jones, politely refusing, but refusing nonetheless on the grounds that they expected to submit an article on the data “in the coming few months”:
As you may have detected in the Mann and Jones article from the way the Law Dome data was cited (acknowledged, to be more correct) Mann and Jones were using unpublished data. We are nearing completion of a fuller treatment of the Law Dome d18O dataset for publication – it has only recently reached its present state of calibration and dating. We expect to submit it in the coming few months. Once it is accepted, we will release the data. So, I am happy to provide the data but I must postpone delivery until that time.
In February 2004, six months later, I asked for a second time, once again being put off by van Ommen, who said release of the data was controlled by a paper then being finalized:
I [van Ommen] am finalizing a paper that will allow me to release the isotope record more widely. It is this next paper that controls the timeframe for release to you and archives.
The following day, the Climategate dossier shows that Van Ommen notified Phil Jones about my inquiry. (In subsequent FOI requests, various universities have claimed that they regard correspondence as confidential, but no such deference was given to my correspondence which was immediately broadcast among the Team.)
What you will find below is (in reverse chronological order) an email interchange between Steve McIntyre and myself. He has been asking for LD data for a while (since your GRL paper came out) and to my chagrin, I have put him off once already, for reasons I spell out below. For your information, I am close to submitting the full LD isotope record, which I hope to present at SCAR Bremen, along with some interesting spectral analyses and comparison to EPICA Dome C.
Jones, who forwarded the correspondence to Mann, indicated his plans not to cooperate with such requests, while Mann vehemently urged that no data be provided to me.
The following year (February 2005), I once again asked van Ommen for the Law Dome data:
Dear Tas, is the dO18 information for Law Dome supplied to Jones and Mann [2004] available yet? Thanks, Steve McIntyre
Once again, van Ommen declined to provide the data:
I will get back to you shortly on this. It has been a busy summer – field trip to Antarctica and then some vacation and I have been out of the office a lot. More soon.
The following year (March 2006), I repeated my annual inquiry for the fourth time:
BTW could I get a digiital version of the Law Dome data about which I inquired a couple of years ago and which was supplied to Jones and Mann.
This time, I was partly successful. Van Ommen finally sent me the requested data, but only on a confidential basis pending publication, which was supposedly “getting near, and along with that, a full open release of the data”:
My apologies for not following that up – things have been rather hectic.
The data set I am sending is, I am displeased to report, still within my internal “mill”. In the interim, I have been involved in a further Antarctic field trip and the publication of the isotope data has been slowed somewhat. Particularly since we have been able to get extra material that will bring our record up to 2004AD (eventually at seasonal/quasi-monthly resolution). You will appreciate more than many that an extra several years greatly improves our statistical power for meteorological calibration (given the shortness of the instrumental record in Antarctica). So, I really wanted to hold off until I had the longer set to work with. This being in place, and analysis nearly complete, publication is getting near, and along with that, a full open release of the data.
Until then, I give you the data that Jones used, for your own purposes. Please do not distribute the data itself.
Van Ommen’s observation that the additional data “greatly improves” statistical power for calibration is an interesting point in connection with Gergis et al 2016, of which van Ommen is listed as a coauthor.
In 2011, Neukom, Gergis and others published a supposed compendium of Southern Hemisphere proxies (Neukom et al, 2011. Clim. Dyn.), which was later relied upon for the Gergis et al 2012 and Gergis et al 2016 networks prior to screening. In January 2011, I asked Neukom to provide the unarchived data, one of which was Law Dome d18O provided to Neukom as a “pers. comm.”(see CA here):
Dear Dr Neukom,
I notice that your recent multiproxy article uses a number of proxies that aren’t publicly archived. Do you plan to provide an archive of the data as used in your study? If not, could you please send me a copy of the data as used. Thanks for your attention.
Regards, Steve McIntyre
Even though there had been a “consensus” post-Climategate that data in multiproxy studies be archived, Neukom refused.
Thanks for your interest in our work. Most of the non-publicly available records were provided to us for use within the PAGES LOTRED-SA initiative only and I am not authorized to further distribute them. You would need to directly contact the authors. I am sorry for that.
This was precisely the sort of daisy chain chase that I had long objected to. My position – both before and after Climategate – was that multiproxy authors should be required to have obtained permission from original authors to publicly disclose data before considering it in a multiproxy study or else not use it. To its credit, Nature has adopted this policy, but many paleoclimate journals (e.g. Holocene) acquiesce in data obstruction.
Subsequently, I asked Journal of Climate to require Gergis et al (in connection with Gergis et al 2012) to provide the
The compilation of this database represents years of our research effort based on the development of our professional networks. We risk damaging our work relationships by releasing other people’s records against their wishes. Clearly this is something that we are not prepared to do.
We have, however, provided an extensive contact list of all data contributors in the supplementary section of our recent study ‘Southern Hemisphere high-resolution palaeoclimate records of the last 2000 years’ published in The Holocene (Table S3)… This list allows any researcher who wants to access non publically available records to follow the appropriate protocol of contacting the original authors to obtain the necessary permission to use the record, take the time needed to process the data into a format suitable for data analysis etc, just as we have done. This is commonly referred to as ‘research’.
We will not be entertaining any further correspondence on the matter.
Though I obviously rejected Gergis’ refusal, I followed up with van Ommen about the publication promised many years earlier:
Dear Dr van Ommen,
Some years ago, you wrote me as follows saying that you were anticipating
“The data set I am sending is, I am displeased to report, still within my internal “mill”. In the interim, I have been involved in a further Antarctic field trip and the publication of the isotope data has been slowed somewhat. Particularly since we have been able to get extra material that will bring our record up to 2004AD (eventually at seasonal/quasi-monthly resolution). You will appreciate more than many that an extra several years greatly improves our statistical power for meteorological calibration (given the shortness of the instrumental record in Antarctica). So, I really wanted to hold off until I had the longer set to work with. This being in place, and analysis nearly complete, publication is getting near, and along with that, a fullopen release of the data.”
Has this been published yet? I notice that the data in Schneider et al 2006 came to 1999, but not to 2004. How far back were you able to extract annual values?
Regards, Steve McIntyre
Van Ommen replied that the papers were “just submitted or about to be in coming week”:
We have not published any further Law Dome d18O results since we last corresponded, with the exception of a study of the last deglacial period (ca. 20ky-10ky BP) for which those data are archived publically.
Our research focus has been on trace chemistry work, snowfall rates and also for me an excursion into ice sheet work.
This will shortly change with papers either just submitted or about to be in coming weeks. These will benefit from improved dating arising from the trace chemistry studies and annual values back to ca. AD170. As soon as any of the publications are accepted we will be archiving the corresponding data set.
I then asked van Ommen for the data that he had provided to Gergis:
Gergis et al cited a newer version of the d18O data, which they considered in their study, which refers to a start date related to the salt studies. It looks very relevant to their conclusions. Could I get a copy of the data that they were sent for the purpose of commenting on Gergis et al. Regards, Steve Mc
Van Ommen had been corresponding with Gergis about my data request. In order to frustrate my request for the data prior to screening, he had suggested to Gergis that I only be provided with the 1921-1990 portion of the data, only enough to check their screening. He followed this tactic in his reply to me:
As you know, the Gergis study rejected the Law Dome d18O series as a non-predictor. It was not significantly correlated (detrended, as described in the paper) to the instrumental target series over the period 1921-1990. If you wish to check the rejection correlation, then you can do so. The data set through this time period is “as archived” from the 2006 Schneider and Steig paper and publicly available. To save your effort, I reproduce the 1921-90 portion below.
1990 -23.43
1989 -21.91
1988 -21.22
1987 -23.07 ….
I then asked van Ommen about an apparent discepancy between the d18O series of Jones et al 1998 and the more recent versions:
Tas, maybe you can clarify something. In the graph below, I’ve compared the annual data from the Law Dome O18 data used in Jones et al 1998 (red) to the data in the LD2.1kyr file (blue) that you sent me a number of years ago (which, as you observe, matches the Schneider average in the last 2 centuries.) The values of the two versions match closely from about 1600-1840, but diverge quite sharply after that. I haven’t seen any discussion of this and I was wondering what caused the difference in results in the 20th century? Regards, Steve McIntyre

van Ommen politely answered as follows:
I believe we covered some of this in our exchange back in 2008. I noted that we haven’t published on the data set that Phil used in 1998 and didn’t wish to archive it publicly as it was a very early product that might have been state of the art at that time, but which was superseded by data coming on line in subequent years: noteably the LD2.1kyr data set and the Schneider and Steig data sets (both archived).
Anyway, to the matter of why they are different, I did make some passing comment in 2008 – gaps, newer cores and a refinement of dating and calibration were mentioned. Specifically, the Jones 1998 data uses the upper part of the initial DSS core, thermally drilled in 1987, and analysed in new mass spectrometry facilities. There was a section of core when drills were changed (corresponding to the ~1840-~1880 gap) that was in bad condition and so we didn’t have a series through that portion. These were the early pioneering days, and since then we have improved all aspects of our operation end-to-end, with better technology, calibrations and replicate cores (dry drilled rather than thermally, which helps) over the period in question. That is why the records that we are releasing are different.
I hope that helps – please don’t hestitate to continue the dialog if you have further questions.
I responded as follows:
Thanks for the clarification. I have experience in drilling cores (though in the mineral business) and understand that mechanical vagaries occur under much less demanding circumstances than you’re experiencing.
Given both the importance of d18O as a proxy andIt Law Dome as a high resolution site, I’m surprised that publication of Law Dome O18 results has been so sketchy to date. BTW contrary to your email, I’m not aware of the LD2.1 dataset being archived anywhere. It’s not at NOAA nor did it turn up in a AADC search under “law dome”. If I’m mistaken, the location isn’t easy.
Van Ommen responded by pointing to metadata record at AADC which did not actually contain a public archive, but a direction to manually request the data. Van Ommen reflected on this overnight and decided to make the data available online after all:
I just checked this out again and on consideration I will just have the data opened for automated access – should happen within a day. Although my intent was to be constructive rather than obstructive with access, and I have no evidence that anyone had complaints, I reckon this is a better option.
In this exchange, van Ommen also made the prescient comment that studies using Law Dome as a temperature proxy had assessed correlation to local temperature (which was high), whereas Gergis et al 2012 had assessed correlation to an Australasian regional composite (which was low). So at least one Gergis et al 2016 coauthor was keenly aware of the strong correlation of Law Dome d18O to local temperature:
One point you may want to consider in your view of various uses of the proxy data – some, like Mann and Jones, or Schneider et al., have assessed Law Dome for its correlation to _local_ Antarctic temperature. We know for isotopes in polar precipitation that this is to be expected. Gergis et al were assessing the correlation to very distant temperatures in the Australasian sector – their finding: not much. In the absence of a particular teleconnection, this is also expected.
In 2016, the Australian Antarctic Division archived their official Law Dome d18O version over the past two millennia (see here), still without a covering academic publication.
In August 2003, van Ommen had said that they expected to “submit it in the coming few months”. Thirteen years later, the long and multiply promised article remains unpublished.


154 Comments
The Australian Antarctic Division moves at a glacial pace.
I received the strong impression that it was Tas van Ommen who was sitting on the Law Dome data (and the Mills Island and Porpoise Bay data), and that his refusal to release it was not according to policy of the Division, but through his own discretion. Is this impression incorrect?
We Australian taxpayers have been agitating for CSIRO funding for Antarctic research and the provision of a fully funded ice ready research vessel.
According to reports this is happening.
The corollary is that the CSIRO makes available raw data.
There are great pressures on the Antarctic division.
http://www.heraldsun.com.au/news/national/decision-to-close-aad-research-station-on-macquarie-island-reversed/news-story/f4c461a85a5857b90e70375abc84d397
It would be fitting that raw data be archived and made available on the web.
Only then will there be wide scientific consensus that such research is worth the cost.
Other wise new researchers will be unable to look at data with new insights, while the old breed are tempted to hoard data that may come in useful for a killing paper later on in their career.
The Antarctic Division is a heavily publicly funded body.
It must remain no one’s plaything.
Steve, this is a disgraceful tail of obstruction.
How do you keep your cool when repeatedly confronted with such obvious deceit?
On a more specific point, it is patently clear that the Law Dome data has been suppressed because it doesn’t tell the “correct” story.
“When you are making cherry pie, you have to pick cherries”, springs to mind.
The most frustrating part in all of this is the existence of two separate and very, very different records, both of which claim to be Law Dome at its finest. Well, no, actually that’s not the most frustrating part.
The most frustrating part is the pathetic public apathy, lack of comment, and even active support of far too many mainstream climate scientists in the face of this kind of skullduggery. I mean, if there were two competing versions of the genome of the same sample, microbiologists wouldn’t sleep until they figured out which one was correct. But in climate science, people are only interested in the story, and the shameful lack of archiving gets no press. In addition to the existence of “gray” versions of the data, as you point out there is often no explanation for the difference between two or more “gray” versions of the same underlying physical measurements.
Grrrr … luckily not much of my work depends on the Law Dome, but others may not be so lucky. How can scientists be so actively obstructionist?
In trying to understand their actions, I can only fall back on one of my many rules of thumb. This one states:
If you see that a man is hiding something … it’s because he has something to hide.
Regards, and thanks as always for your fascinating and invariably impeccably cited research.
w.
I agree.
As a outsider looking in and not hindered by any detailed knowledge on the subject, :-), my conclusion when seeing this unwillingness to make the raw data available is that something fishy is going on. Period.
The only valid explanation I have heard up to now is
-Phil Jones email Feb. 21, 2005
‘Nuff said.
“…Something to hide.”
###
Yep but, unfortunately for the Cause, van Ommen has released enough data for Steve Mc to post cogently and convincingly on the subject. Gergis et al must have bitter regrets concerning this because the Law Dome data that is available make it clear that, as a proxy dataset for Southern Hemisphere temperature trends, the Law Dome data is superior to others. More importantly, Law Dome data overturns the conclusions of Gergis,et al, 2016.
I assume that all of the funding used for the collection of said data originated from the public purse. This is what pisses me off the most. They have zero rights to withhold the data regardless of any “pending” publications. Data should be made available on open forum upon completion of the QA/QC and not on a “for your mates only, not for anyone else” basis. Completely unacceptable. Steve, your patience is unbelievable.
In figure 1 for the law dome used by Mann Jones 2003 shows a much warmer period circa 800 ad -1050Ad (or so). Any insight as to what extend the law dome was used in MBH 1998 and subsequent Mann recreations and how much weighting was attached. thanks for any info
Steve: not used in MBH98. Wouldn’t have mattered anyway since Mann overweighted bristlecones. Used in Mann and Jones 2003 SH reconstruction, which was not discussed much. Mann et al 2008 reverted to an antique Law Dome version from the 1980s that had been circulated in a grey version. It was short and irrelevant.
Actually it’s the anonymous Willard who invented the climate ball game. Willard is ATTPs moderator and from having read many many of his comments seems to have no scientific or mathematical qualifications. Willard spuriously thinks he admires Bertrand Russell and specialties in obscurities that are mostly irrelevant. He apparently, Steve, has been making fun of you for many years. He has some info on his web page about “the auditing sciences” which is of course denigratory but cleverly couched to be a bit humorous
Willard is a Canadian academic philosopher who has an unhealthy obsession with Steve. Yes, he love to post his tedious “climate ball” (as he termed it) dissections on mainly spurious points, mostly struggling to impress readers with his pettifogging cleverness. No, he does not have any scientific or technical qualifications.
I really don’t understand what can motivate someone like that except personal animus, a personality defect, or perhaps political prejudice and hatred. I would have expected him to be involved at some specialist philosophy blogs. Perhaps there aren’t any interesting ones. Does he really think he is making a contribution that will do anything other than gratify his ego and obscure the important issues?
Steve, as you know, stats, graphs and (post-modern) math are definitely not my forté. But as I was reading through your meticulous chronicle, all I could think of (and not for the first time on the CliSci/IPCC fronts) was Joni Mitchell’s Circle Game.
In this instance, please forgive me while I take a few liberties with her … well … iconic lyrics:
And the seasons they go round and round
And the tainted proxies go up and down
We’re captive on the carousel of Clime
We can’t return we can only look
Behind from where they came
And go round and round and round
In the circle game
And go round and round and round
In the circle game
Steve: ATTP celebrates the obstruction as Climateball.
Steve,
It is my understanding that indeed the Law Dome d18O data are closely related to local temperatures which is heavily influenced by the nearby ocean. Inland ice cores d18O derived temperatures reflect more the overall SH (ocean) temperatures.
As far as I remember, there was a compilation of d18O derived temperatures around Antarctica which shows a tightly coupling with the Antarctic Oscillation, while the Peninsula shows the opposite trends.
As with most proxies, I think that this one shows mainly local climate, which isn’t necessary the same as the average of the whole hemisphere, even may be opposite. The same for the GISP2 core of Greenland, as Greenland’s climate is heavily influenced by the NAO and in general opposite to what happens in NW Europe… But that remark is also applicable to the records that Gergis retained in her compilation or any compilation…
FerdiEgb – “As with most proxies, I think that this one shows mainly local climate, which isn’t necessary the same as the average of the whole hemisphere, even may be opposite.”
All the more reason to just use the bristlecone pines and dispense with all the others.
(Sarc)
Thanks for yet another piece of actual investigation and science in progress Steve!
Hi Steve
Steve, just wondered when you state –
“In August 2003, shortly after the publication of Mann and Jones 2003 and before anyone had heard of me, I asked Tas van Ommen of the Australian Antarctic Division for the Law Dome d18O data used in Mann and Jones 2003 as follows:”
then the bit about –
“Jones, who forwarded the correspondence to Mann, indicated his plans not to cooperate with such requests, while Mann vehemently urged that no data be provided to me.”
why would before anyone had heard of you “Mann vehemently urged that no data be provided to me”
I assume it all goes back to the request to Jones from Warwick ?
Jones/Mann/etc wasn’t from the August 2003 inquiry. As the text states, it was “…In February 2004, six months later…” after Steve had made a follow-up attempt with van Ommen.
…and while Mann was being a @#!% to Steve as he/Rutherford were giving Steve the wrong info long before “anyone had heard of” Steve as far as the general public was concerned, Steve’s first publication with Ross McKitrick was in 2003. So obviously by 2004 Mann would have clearly been in fetal position mode, and Steve had been “heard of.”
The excuses for excluding Law Dome d18O seem as lame and transparent as van Ommen’s excuses for being unresponsive.
Could you post the data you used for this? I’ve been having trouble replicating these results.
This is very well written. Thank you.
Seems like there is no good reason not to use the Law Dome data.
Any idea if this is going to get fixed for the PAGES 2K update which will supposedly occur this year?
d180 appears to be a very important proxy having the capability of documenting over 20,000 years! of climate. Law Dome d180 seems to be one important data point, so sorely needed in the reconstruction of Southern Hemispheric reconstructions. Like most of you, I don’t seem to get why it is not being used. Great detective work as usual.
Law Dome data show a cooling signal. Gergis and her co-authors were only interested in warming signals. As Steve McIntyre showed in his preceding post, the authors could not produce a warming trend except by spurious manipulation of the data. Inclusion of Law Dome data, a dataset of quality superior to those used in Gergis et al 2016, would have negated the conclusions of their study.
This also further illustrates that there is no homogeneous warming, or cooling, etc. Each locale has its own trends, and lumping them all into one single line on a graph is disingenuous at best.
Does anyone really believe these reconstructions? The result always appears to depend on the statistical methodology applied, what data sets are and are not included and so on. There is no a priori way to determine which statistical methodology is “correct.” Or which data sets to include or exclude for that matter. Then there’s the reported precision and accuracy claimed in the result. I just cringe at this nonsense. In the clinical trial world, we never get to analyze trial data results. It has to be outsourced to an independent third party. Seems like Climate Audit serves that role for paleoclimate reconstructions.
+1
The ‘rather hectic’ and ‘too busy’ excuse is very common. I’ve lost count within mining companies how many people were ‘too busy’ to provide data, only to give it to someone else as soon as they asked. You have to be within an inside ‘team’.
Steve Mc:
Am I understanding correctly that LD d180 in Gergis(2016) is a third version? How many versions are known? Who gets to create new versions and how often? If one has multiple versions to cherry pick from, and choice of local or regional climates to match up to, are these choices reflected in the correlation p-value?
Steve: there are “good” reasons for new versions. They analysed the core with more resolution. There are no good reasons for not publishing the results or for giving the data to pals and not to perceived critics.
Ken Stewart updates the UAH V 6 data every month and shows graphs of the world’s regions. The south polar region temp has been declining slightly since Dec 1978. Here is the June 2016 update.
“In 2016, the Australian Antarctic Division archived their official Law Dome d18O version over the past two millennia (see here), still without a covering academic publication.”
When the actual data tells a story which is different from the story you favor, then you don’t publish the data, nor make it available for people who might use it to refute your favored story. Another of the many examples of what is wrong with climate ‘science’.
Steve McIntyre,
Would a direct comparison of the now archived Law Dome data and the Greenland ice core data be informative? Claims that the MWP was a mostly ‘local’ northern hemisphere event would seem clearly refuted if the two data sets correlate closely over the last two millenia.
Steve: in a Holocene context, the MWP is not a loud signal. the more surprising thing is that neither is the modern period. I’ve done a lot of work on this issue, but am buried in data.
“but am buried in data”
Can others help?
A crystalline ball
Our murky past;
You can see it all,
If only you’d ask.
=========
With apologies to Hurricane Smith:
“Have we a hope, or half a chance,
To have a look or just a glance at trends? Yoo hoo
Would you treat us or just rudely turn away?
Would there suddenly be data showing climate yesterday?
Ommen, what would you say?
For there you sit, brave scientist,
With data to remove the mists, of time. Of time.
Just to plot the numbers in a simple trend,
To archive it, to preserve it,
To be science’s best friend,
Ommen, what would you say?
Just so, maybe you know,
We know you’re starting to look amiss,
And we see how you continue to dismiss,
Polite requests for the one thing that you seem to hold so dear.
But anyway, what would you say?
SNIP
Steve: longstanding blog policy discourages attempts to resolve the existence or non-existence of CAGW in a few sentences or paragraphs on blog threads with specific topics. Else all threads become identical.
snip –
sorry. see comment on blog policies
Not bad suggestions in and of themselves. However, as fifteen years experience has repeatedly shown, the “other side” will simply ignore your questions and continue business as usual.
Phil
Steve wrote:
“Nor in a Southern Hemisphere context are “atmospheric circulation changes” independent of temperature changes: changes in temperature are invariably associated with atmospheric circulation changes, particularly with movements of the southern westerlies towards and away from the equator.”
and:
“The correlation (and t-statistic) between Law Dome d18O and gridcell temperature is exemplary- far better than the two tree ring series accepted by AR4 authors.”
Eric Steig has endorsed the same point about Antarctic temperatures being driven by prevailing circulation. So Law Dome is more than just an important proxy. In a normal-science attempt to detect an AGW signal, The Law Dome data would be used to reduce the error in the “forced” temperature record introduced by circulation changes.
SM,
An excellent and entirely dispiriting article.
Paul,
Why dispiriting? The machinations of the paleo-climatologists have been pretty clear since at least the UEA email trove. I prefer to think Steve has (finally) motivated the Aussies to release ice core data which should have been released a decade+ ago. That is progress. Are they now going to turn into model scientist-citizens? Heck-no! But finally seeing the Law Dome data is progress.
Steve,
I say with no sarcasm that I am glad that you can find some comfort from this tale.
A key dataset has been archived 29 years after it was first acquired. One small step for man, but one – even smaller step for paleoclimatology. I am not celebrating yet for several reasons, some of which I will try to pose in the form of questions to SM.
I agree that the machinations are unsurprising in light of the ignoble history of some key individuals in paleoclimatology, but I still cannot view them with anything other than distaste. Temperature reconstruction is a desperately hard problem. If the real problems are ever going to be resolved, an open and truly multidisciplinary approach is essential. What is clear to me is that the scientific world can never reach intelligent closure on the key questions while the subject remains under the tight control of a relatively few individuals with limited intellectual reach and a common agenda which has nothing to do with achieving scientific objectivity. The jealous guarding of reputations and data through secrecy, suppression of adverse results and outright mendacity is the diametric opposite of what is called for. What makes me profoundly pessimistic is that I still cannot hear the voices of other scientists within and outside paleo-climatology calling for a different behaviour. Where do we look to see the forces for change?
The hand of change
Is that of man;
Encased in fate
The velvet throbs.
=======
This blog is one of the forces of change. I agree of course that there is too much very bad behavior, and even more bad science, in paleo-climatology. And yes it is a very hard problem, and maybe an intractable one. All the more reason to be open and honest with data and analysis. We can hope that some in the field will read Steve’s sad ‘reconstruction’ of this sorry episode and note that similar things should not happen again. I don’t know if the field can ever generate truly robust findings, but I do know it will not so long as rubbish like arbitrary exclusion of data which ‘tells the wrong story’ continues to be accepted by other scientists and journal editors.
I find that silence more disturbing than the individual scientists using wrongheaded approaches in doing temperature reconstructions. Individual scientists or groups scientists as coauthors of papers on reconstructions might be forgiven for their actions because they are merely following the lead and works of those who authored preceding papers. These papers tend to feed off one another and once a method and/or data get published through peer review it can be referenced as though it were the unwavering truth. I suspect that there are individual authors of reconstruction papers who are not particularly interested in taking a path of originality and digging deeper into what is required to obtain or test proxies as reasonable thermometers of the past climate and who are also not particularly interested in educating themselves in these matters. How will any of this change? I believe that is difficult to predict.
How long did it take to see studies questioning low fat diets, salt intakes and benefits of flossing?
kenfritsch:
For me, the profound ignorance and arrogance of the entire paleoclimate community is staggering.
For example, they routinely use test statistics developed by Irving Fishe,r the father of modern macroeconometrics, who was…an economist, but deride the training and background of economists who dare to opine on the community’s misuse of tools developed for the econometric community to begin with.
Issues of Autocorrelation, of ex post section of data, of spurious correlations, The difference between a statistical significant relationship, and a meaningful one…all of the crap a competent undergraduate student majoring in statistics would understand by their third year…all of these issues confound the community.
In no other field of endeavor…academic, commercial or medical would a statement like:
“if you want to make a cherry pie, then you have to pick cherries” be allowed to stand unchallenged, and the person who uttered it certainly wouldn’t remain a respected member of the community.
kribaez,
It is dispiriting. Paleoclimate is a pretty small and insular field which perhaps explains part of its ability to resist change. Medicine is a huge field and its simply impossible to keep such a large number of smart people behind a party line when its clearly wrong or even questionable. The public also is engaged in medicine to a far higher degree than with climate science and can help increase accountability.
However, there is an element of individual culpability as well. Individuals do have choices when they write a paper or decide to release or not release data or to exclude information from their publication that might contradict their hypothesis. I understand young researchers feeling vulnerable and wanting to please the big names in the field. Those who are well established have a special responsibility to the field to try to improve it and raise standards of transparency and accountability.
Given the general recognition in science of the replication crisis, it is indeed culpable that climate science seems so in thrall to “science communication” pseudo-science. The public needs above all else honesty and transparency, not another layer of pseudo-scientists trying to shape the message.
However, as SteveF points out there are a few good signs. The recent paper on model tuning was a step forward. Even there, there is culpability in that climate science seems incapable of acknowledging that people outside the field might have documented some of these things (or known them) a long time ago. There is some evidence that Hanson’s original proposal to use weather models for climate met some strong skepticism when reviewed. There is a singular insularity to climate science that is striking. I personally believe that is partially because its methods have particularly weak theoretical support compared to even fields like CFD.
SteveM has personally suffered particularly in a way that is just inexcusable and unethical. There is only one way to improve science or any human institution and that is to insist on high standards and not be satisfied with crumbs. Steve has stubbornly insisted on it and that is a sterling contribution.
One more point that deserves to be highlighted.
We know exactly what progress in improving science looks like. In medicine reforms have been going on for at least 15 years and have had some real positive effects. Here is documentation of that:
http://journals.plos.org/plosone/article?id=10.1371/journal.pone.0132382
At best, climate science is where medicine was 25 years ago. One reason for that is the professional apologists for climate science in the business of “climate communication.” I won’t even go into those who have blogs like ATTP, Gavin Cawley, who simply publicly maintain that there is not a problem, or at least not one worth taking action on. That’s really a personal failing that they need to think about some peaceful evening. It is also true believing junior members of the science establishment suffering from selection bias.
Two questions I ask myself whenever I notice that David Young has made a comment on a blog:
1. Does it mention me?
2. Does it make a claim that is untrue?
Although the answer to both these question is not always “yes”, it is “yes” far more often than not. Just an observation, mind you.
aTTP,
Just a quick observation/question. You note that he’s not always wrong, but you still never address the issue.
1. If it doesn’t mention you, who cares?
2. If the claim is true (or you think otherwise), address it!
Just an observation, mind you.
Don’t fall for it. Don’t answer it. Bite your damn tongues (metaphorically speaking) – bite your typing fingers.
ATTP stick to bemoaning that Steve is not publishing his destruction of Gergis et al 2016. Sohpistry is your domain, that and dancing around salient points on your blog.
As Steve pointed out earlier in this thread:
I’d missed that. I thought you were the only person who said things about me that aren’t true. Seems I was wrong. I guess you’re on the right site, though.
Truth in the eye of the beholder I guess which leads me to ponder what kind of mirror you might be using. Tin foil comes to mind.
Jeff Norman … is this the mirror? https://www.facebook.com/870726596345956/videos/1034423369976277/
DPY6629
I think they are way behind where the applied statistical analysis community was 25 years ago.
For example:
The concept Bonferroni corrections, applied to meta analytical studies was first articulated in 1959, By Olive Jean Dunn.
I didnt know this, but it it took about 30 seconds to find out.
However, I was aware that people conducting meta analysis were applying this correction when determining relevant measures of significance for studies that combined years ago.
Years ago…like decades.
When the issue is clearly articulated as kenfritsch has done, the issue is so obvious intuitive and accessible that the only way someone involved in meta analysis could avoid this correction is simply because that person didnt want to utilize it. (because it makes one results, on average seem less significant, because they are, less significant)
am aware that macroeconometric modelers have, since the 1950’s been dealing with the very same issues that paleoclimatologist seem so willfully ignorant of today
Noisy autocorrelated datât sets, systems that one suspects are characterized by lags….problems of reliability of data… spurious correlations, heteroskedascity…all of this crap, generations of knowledge ignored as these woefully inept people suck up all of the oxygen in the funding universe…
Absolutely indefensible study design, data selection, statistical analysis are the rule, not exceptions.
This is stuff that mature professionals simply shouldn’t have to be taught, convinced of, cajoled into doing or anything.
The practices simply have to be disavowed, and the practitioners who use them should be ostracized and shunned, until they start to use acceptable procedures.
Yes, its an excellent point david. To be credible in medicine, people need to involve professional statisticians at the very beginning of the study and have them on the team. Seems like an excellent idea in climate science as well.
dpy6629:
I have an extended family member who is an incandescently bright biologist, a geneticist who has been involved with the human genome project for over decade.
He travels all over the world quite regularly, to lecture; his articles have been cited thousands of times.
The lab he works with has been credited with discovering a gene responsible for low LDL blood levels, and was responsible for the latest general of cholesterol lowering drugs.
Now, the point here is the way they discovered this gene was by designing the data collection part of their research with a great deal of forethought.
Every time they got a blood sample from an individual they ran a routine blood chemistry analysis of the sample, looking at things like lipids, blood sugar, H1c level crap like that.
They also collected data from the individual donors.
Stuff like pulse rate, weight, height, (for BMI, maybe) blood pressure. all off this data was associated with the genetic profile of the donor…
That way, they could search for phenotypic expression, and link it to the genotype of the individual.
Seems like common sense. out no one else thought to collect that type of data from each individual at the time of getting the blood sample.
He and his lab routinely employ a professional statistician to assist his lab when they design studies and when they analyze the data they collect.
Of course he’s interested in solving problems, and improving the lives of others.
Thats how you behave when things like that are important to you.
When you refuse to share data or to publish data, when you celebrate data mining, ex post, ad hoc selection of data, when you refuse the counsel of those who developed the very tools you are currently accused of misusing, its clear that whatever you stated goals might be, going valid insight into the phenomena you are studying isn’t one of them.
No one is within this tiny, insular, inbred community is willing and able to stand up and say:
“This is crap. Theses practices are wrong, we’ve known, or we should have known that they were wrong for decades.
Stop”.
I know. It’s frustrating. Tiny field. Unethical leaders in that field. Medicine is huge and far more tolerant of controversy. Also some enforcers trying to silence dissenters too in climate I fear
Steve
FYI – a comment you might appreciate at
http://joannenova.com.au/2016/08/greg-hunt-orders-csiro-to-hire-back-scientists-needed-to-win-debate-that-is-over/#comment-1824129
“Drapetomania
August 6, 2016 at 12:55 pm · Reply
Now with all these funds they can supply the Australian Antarctic Division with resources to publish and archive the Law Dome d180 series…
Thank god for post modern “science” and choosing different narratives for the sheepeople.. 🙂
“…In August 2003, van Ommen had said that they expected to “submit it in the coming few months”. Thirteen years later, the long and multiply promised article remains unpublished…”
https://climateaudit.org/2016/08/03/gergis-and-law-dome/“
Some of Law Dome’s data now surfaced in a new study in Nature Geoscience of 25 July 2016 “Low atmospheric CO2 levels during the Little Ice Age due to cooling-induced terrestrial uptake” discussed in a Guardian article https://www.theguardian.com/environment/planet-oz/2016/jul/29/antarctic-ice-core-study-has-probably-just-made-the-job-of-cutting-fossil-fuel-emissions-even-more-urgent
Carbonyl sulfide (COS)measurements for the LIA period fitted the 97% consensus narrative. To find this in the mountain of Law dome data must have taken quite some time and effort.
And here I was thinking that 97% consensus narrative said the LIA wasn’t a globally distributed climate cooling event, I mean how could it be because that would have to mean the global climate had been warmer prior to that.
Steve,
Given your profound knowledge of Holocene climate proxies, your ample statistical knowledge, and the pitiful lack of a reliable Holocene temperature reconstruction, wouldn’t you attempt to make and publish a better Holocene temperature reconstruction? That would be a very significant scientific contribution, and in my humble opinion much more worth it than slaying some climate alarmist dragons that constantly contaminate the paleoclimatology with sloppy science. Perhaps some of those silent paleoclimatologists might start using it if it better serves to support their real science. Best wishes.
When you add the matter of the reconstruction ‘where?’, the question becomes nearly intractable, the problem not quite insoluble. Note the ‘nearly’ and the ‘not quite’. Hark for’ard!
============
John Harrison springs to mind. Funny that that case and this case are both bound together with gears of ‘where’, though they be ‘wheres’ of clashing colors. I suspect seeking through paleoclimatology the understanding that so many desire may be akin to trying to use lunar observations to determine longitude.
============
Javier,
Given the number and distribution of available Holocene proxies for making any kind of regional, hemispheric or global reconstruction, one would have to believe you can make a silk purse out of a pig’s ear. Consider the ability to create a surface temperature record from the temperature data we actually have now.
Steve: there is much to criticize in the handling of proxies and station data, but no need to over-editorialize either. We know about ice ages from “proxy” data. While I have some frustration with how temperature data has been handled, it’s not an issue that I’m overly concerned about. Please don’t take this comment about temperature data as an invitation to debate it on this thread as it is O/T.
Steve,
You have a vastly better comprehension of proxy data than me or probably most anyone else who reads your blog. If I made you think that I believe proxy data is valueless then it is poor communication on my part. Of course we know about major climate changes from proxy data. That is the only way we could have known.
My concern is separating the wheat from the chaff. Finding the golden proxy trends in the hay stacks. Attempting to create a prehistorical climate reconstruction with the accuracy and precision claimed by those who have published previously.
My concern is that your devotees believe you could create the ultimate climate reconstruction.
Your detractors desperately hope you will attempt a reconstruction so they can audit it to death.
Sounds like the Life of Brian. Oh well, look on the bright side of life.
Jeff:
there is little doubt that some proxies may reflect gross changes in the local climate in which they exist.
The problem is that whatever temperature signal they carry is of questionable resolution, and is commingled with whatever myriad of other factors that influence coral growth rates,or the relative populations of differing microfauna, or Isotope ratios in dissolved gases trapped in ice, or the growth rate of trees…
None of these issues would lead any rational person to view the application of these proxies in determining climatological fluctuations on the order of fractions of a degree celsius annually.
Really, thats the issue.
As for finding a needle in a haystack, if one is wiling to discard enough proxies, one can always find some data set that appears to emulate climatic variance.
“Appears” is the operative word however.
davideisenstadt,
Yes, which is why I responded to Javier the way I did and leaves me perplexed about Steve’s admonition.
Jeff
Indeed – when proxy variability and problems are not only exaggerated but deliberately maxed up by publishing papers with a deliberate inclusion of many unreliable and contradictory proxies to flatten climate records (Shakun, Marcott), the alarmist camp is in creationist territory – “you cant trust fossils”.
OT, but CA readers may be interested in my new blog post proposing a $6.50/ton carbon tax, in exchange for elimination of EPA restrictions on C, “the Carbon Tax: Welfare Triangle or Welfare Obelisk?”, The Beacon, http://blog.independent.org/2016/08/07/the-carbon-tax-welfare-triangle-or-welfare-obelisk/ .
Please direct any comments there, not here.
Link below: From Isotopes to Temperature
Univ Washington Vu-Graph showing how d18O isotopes from Antarctic cores (Law Dome et al) go to temperature over the last 65 kyrs.
Click to access icecore_temp_uwinhs_schoenemann_draft_lowres.pdf
should it not be a task for reviewers to store the data they reviewed for a report?
Otherwise this lame exercise happens over and over again and everybody is treated differently
Reviewers rarely if ever ask to see the data or code nor do they try to replicate the results. If I remember correctly a response Steve got years ago when asking for data was that nobody had ever asked before.
Steve: that was at the very beginning of my interest in climate. I had been asked by Stephen Schneider, editor of Climatic Change, to review a submission by Mann. I asked for data. Schneider said that no reviewer had previously asked for data in his entire 28 years of editing the journal and that he needed to consult his editorial board. Their reactions are in the Climategate dossier, since Phil Jones was on his editorial board, and are a very interesting read. Peter Gleick, then unknown in “skeptic” community, also participated.
No doubt the ethics of the response were of Gleickian standards.
Steve:
I think that your experience says much about why actual progression the field has been so slow…
At least in the macroeconometric community, the data sets were public property, aggregated and maintained by the BLS, among other sources.
The construct that data is proprietary, when the vast majority of the relevant research is funded by the government, is simply astounding.
The issues that Wegman identified and articulated are still ignored…
Steve,
Could you (or anyone else)direct those interested to the climategate dossier where the statement “in 28 years no one has asked for the data” was made? Is there a link?
Steve: it’s not in Climategate. It was in an email to me from Schneider.
Steve: “… no reviewer had previously asked for data in his entire 28 years of editing the journal…”
This is still an amazing happenstance. Did these folks think there was no need to examine the actual data? Only the results that supported their (predetermined) conclusions were needed?
This is not normal science. Or really, science of any kind. Well, *political* science.
Good grief.
As an experienced reviewer, it should not surprise anyone that standards for peer review are so loose. Being a reviewer is a volunteer activity and does not make much contribution to your career. The system needs incentives for people to agree to be reviewers and to really spend quality time doing it in a more rigorous way. This is an area where science needs real reform. In my opinion, there needs to be real career incentives to do reviewing and real monetary compensation.
When I have my manuscripts reviewed internally before release, they review is far more thorough.
At the very least, governmental bodies should be prohibited from citing a publication in a policy-justifying manner unless it has been reviewed the way that Steve Mc reviews things, not the way that MBH 1998 was ‘reviewed’.
+1 eloris
For interest re: archiving. I just saw this announcement but I’ve not time to read the details at the moment:
++++
Research Data Policies
At Springer Nature we want to enable all of our authors and journals to publish the best research, which includes achieving community best practices in the sharing and archiving of research data. We also aim to facilitate compliance with research funder and institution requirements to share data. To help accomplish this we are introducing a set of standardised research data policies that can be easily adopted, and are developing supporting tools and services.
These new policies and services aim to:
improve author service and experience by standardising research data policies and procedures between journals where appropriate
improve reader service by providing more consistent and useful links between publications and research data
improve editor and peer reviewer service by providing more consistent guidelines and support for research data policies, and increased visibility of data in the peer-review process
encourage publication of more open and reproducible research
increase growth and innovation in research data sharing, and associated tools and services
provide a dedicated Research Data Support helpdesk for Springer Nature authors and editors
This project is part of a number of Springer Nature activities to help ensure that the data at the heart of scholarly research are appropriately archived and, where possible, widely accessible.
http://www.springernature.com/gp/group/data-policy/
++++
Newly published paper by Jan Esper (et 16 others).
Ranking of tree-ring based temperature reconstructions of the past millennium
Quaternary Science Reviews 145 (2016) pp134-151
https://www.blogs.uni-mainz.de/fb09climatology/reconranking/
That links also provides access to data sets for all 39 ranked proxies.
Includes the Oroko Swamp and Tasmanian series.
Thank you MikeS!
Javier:
Steve, whereas your personal dedication and contribution to audit of climate science is universally understood, as well as the conflicts and unfair play you’ve endured to expose truth to those with open eyes, the logical step of putting your unmatched skill to create a reconstruction has crossed many minds.
David Verardo, head of paleoclimatolgy funding for the National Science Foundation comment on 9-25-2015 regarding Steve Mc and Climateaudit.org
David Verardo was Mann’s handler at NSF, who told him in 2003 that he didn’t have to provide data to Steve – that Mann was entitled to his view of climate and Steve his. Considering this the above comment 12 years later was quite a tribute.
If NSF grants could be influenced by US citizen petitions — well? what would you say Steve?
Ron, Your suggestion is a good one. However, I would understand Steve’s reticence given the overwhelmingly hostile reception any such work is liable to get. He may feel that documenting it here is the best approach.
In addition, it could be that a properly done reconstruction simply has such high uncertainty that it doesn’t tell us much that is relevant. That possibility has already been debated in Annals of Statistics and I considered it a draw with both sides scoring some points. Of course the track record of Mann, Schmidt, et al didn’t inspire my confidence in their honesty, so on that basis I gave the decision to McShane and Wyner. But its still a question where there is lots to be done.
The problem for Steve, I suspect, is that to enter this debate would probably take a dedicated multi-year effort. Really publishing a high quality paper on such a broad topic takes a lot of effort and a lot of time.
DY, I understand and agree about the hardship. However, if I were the head of the NSF’s paleo-climatology funding I would want to commission an independent statistical panel to arbitrate protocols and scope (so as not to be exploratory) and then equally fund concurrent competing multi-proxy studies that would report at a specified deadline. The result should produce a very focused and refined debate that could again be overseen by the same independent panel. Ultimately the dream would be a paleo reconstruction with confidence intervals upon which future study could universally be relied upon. If this were to happen I think the only way it could happen is if Steve were one of the two lead investigator captains.
Could this happen? I don’t know.
“But I lament that we are wasting our collective talents instead of getting to the bottom of the issue.” -DV
I often help my 10 year old son with his homework and when he makes a mistake I point it out to him and have him correct it. Similarly I don’t think Steve M is under any obligation to redo do the work that several paleoclimatologists are already doing. He is only asking that they clean up their methodology and show their work.
CBB, I agree Steve continues to make a major contribution to science at his own expense and long effort, as the NSF’s David Verardo acknowledged. Steve’s success through perseverance, however, has placed himself into a uniquely credentialed position, in my opinion, that deserves public funding should he choose to continue. It should be all of our hope that he does and I was simply searching for a way show support to rally such an effort.
On the other hand, if you were head of NSF’s paleo-climatology funding, you might have to think long and hard before funding such a study. It could be pretty damn dangerous for your future employment. You’ve probably got a wife and kids to think about.
Phil
The takeaways:
Steve:
“the exclusion [of Law Dome] is not *robust*”
Willis:
“If you see a man hiding something … it’s because he has something to hide.”
I never expected this absurd shell-game to go on so long. But now, thee are powerful financial and political forces that would *strongly prefer* to maintain the alarmist case for putting (respectively) money/votes in their pockets. This is a difficult combination to overcome, with the thin reed of scientific inquiry.
As always, Steve, thanks for the perseverance, and scientific chops, to continue putting feet to the fire….
Sometimes they can be tested against artificial data. The statistics are not just a “matter of opinion” but are to protect against subjectivity, agendas, and spurious results.
These new policies and services aim to:
improve author service and experience by standardising research data policies and procedures between journals where appropriate
Source code posted up here: http://www.climateaudit.info/scripts/multiproxy/gergis_2016/gergis_cor_final.txt
That appears to be using hadcrut3 not hadcrut3v (variance adjusted). Mistake?
It does appear to be the case
Using the variance-adjusted dataset makes a huge difference for some series and almost no difference for others:
This file contains hidden or bidirectional Unicode text that may be interpreted or compiled differently than what appears below. To review, open the file in an editor that reveals hidden Unicode characters.
Learn more about bidirectional Unicode characters
gistfile1.txt
hosted with ❤ by GitHub
Results are at the bottom.
Something also interesting..
Lawdome location is a land location.
That means it will have a value in both crutem and hadcrut.cause hadcrut just adds ocean….
BUT they differ so hadcru, hadcruv, crutem, crutemv for law dome all look different.
I have located a cru research archive of old crutem3 going back….. jan, feb, mar, apr, aug, nov of 2012… havent found old hadcrut yet.
I’ll post the code up for downloading all these versions and extracting all the data.
its short.
Cool to see alternative code shared like this.
All I did was post a Github Gist link, and it just worked(tm). I guess WordPress has a Github plugin.
JonA, Sven, there is no doubt Steve McIntyre used the wrong data set. While there are many issues which can be related to the choice of data set one uses which would be worth discussing, one simply cannot claim things about a papers’ results are true when they are only true if you use a different data set than the authors of the paper used.
Not Sure, indeed. In our initial e-mails, I told Steve I couldn’t get results anything like his using the HadCRUT4 data set. I couldn’t use the HadCRUT3 data set at the time because some of the data had been corrupted (turns out my downloads were getting interrupted due to a network problem). My thought, which I believe I expressed at the time, was it should worry people if simply moving to a newer version of a data set has significant impacts on one’s results. I would argue that should cast doubt on the process.
But still, I think the most important point at this moment is this post was written based upon Steve having used the wrong data set. It’s disappointing this error has been made perfectly clear yet it hasn’t been acknowledged, much less corrected.
Note, however, that the Law Dome series still shows higher correlation than the Mt. Reed series even using the variance-adjusted data set.
Not Sure, remember though, correlation score isn’t everything. The t-value is more informative in that it takes into consideration the number of observations being used. A correlation of ~0.37 may seem more impressive than a correlation score of ~0.32, but if the former is based on ~35 data points while the latter is based on ~50 data points, the latter is actually more significant. That’s why Mount Read’s t-value is ~2.6 as opposed to Law Dome’s t-value of ~2.3. Interestingly, Steve even made a point of t-values being more informative than correlation scores when discussing this topic.
Also of note, Steve’s calculations use years that have any amount of (summer) data. That means a single month of data is enough for his code. A person might reasonably think you need more than a month of data to use a year in your calculations. If you require two months of data, the results change. If you require a full summer’s worth of data, then the results disappear completely as the variance adjusted data doesn’t have a single full year’s worth of summer data.
An alternative requirement one could consider would be that years must be relatively continuous. That is, you shouldn’t include data that is separated from other data by five to ten years. In this case, I believe that would mean excluding four years worth of data (I’d have to check the exact number).
One might claim all of these standards for data inclusion are “arbitrary,” but the decision Steve made is just as “arbitrary.” It’d be pretty weak tea to say, “They arbitrarily excluded this Law Dome proxy because they required it have more 20% data in years for those years to be included!” Or maybe that number should be 40%. I forget just what “arbitrary” data retention rules lead to “significant” correlation scores.
I blame that on the fact Steve still hasn’t even acknowledged he used the wrong data set. It’s hard for me to move on to other issues in the discussion when we can’t all seem to agree we should at least try to look at the same data the authors used.
Brandon:
The bigger point is just how unreliable measures of correlation are for small sets of data.
For example, with a sample size of around thirty to fifty, its not at all unusual for two sets of random numbers to show correlations in the range that you cite.
Thats two sets of RANDOM data.
It would be more unusual if they exhibited no correlation at all.
“It’s disappointing this error has been made perfectly clear yet it hasn’t been acknowledged, much less corrected.”
Jeepers. Given that McIntyre has posted nothing since Sept. 10, when he posted his code, it’s hard to hear what could be “disappointing”. You’re disappointed that he has other things to do besides replying to your comments?
miker613, Steve commented multiple times on my site to suggest I was wrong, including to share code and results. When I pointed out his code proved he had used the wrong data set, he promptly stopped responding. He did, however, respond on Twitter a number of times over the next couple days without ever acknowledging he had used the wrong data set. It’s not like he was simply inactive at the time his error was pointed out so he wasn’t aware of it. Plus, I had raised concerns about these very results a month and a half ago, before the post was written, again when the post was written and again a couple weeks later.
Given how simple and clear the issue is, yes, I am disappointed Steve hasn’t at least taken 60 seconds to add a note to the post saying something like, “Concerns have been raised about what data set was used for this post. You can see them discussed here. I’ll try to discuss them when I have time.” Or anything at all. He knows he used the wrong data set, he continued to talk about the topic, but for whatever reason, he chose not to say anything about his error. That’s his prerogative, but being disappointed with his decision is mine.
Hadcrut3v downloaded 5-18-2012
Hadcrut3v 5-18-2012
http://www.mediafire.com/download/78f6wx4z7qb1itg/HadCRUT3v-5-18-2012.nc
Steven,
Is that the version used in Gergis et al.(2016), or just a snapshot of the dataset which you saved?
One can find other versions in the Wayback machine (archive.org) by searching for http://www.cru.uea.ac.uk/cru/data/temperature/HadCRUT3v.nc or http://www.metoffice.gov.uk/hadobs/hadcrut3/data/HadCRUT3v.nc .
Harold
That is a version I downloaded on May 18th 2012 for some work I was doing helping a friend with his paper.
I also found an archive of crutem ( not hadcrut) .. recall that hadcrut is basically adding the ocean
to crutem. For Law dome area it appears that Crutem versions are stable through time
So I would expect hadcrut to be stable.. with a may 2012 version you can look at that.
Richard Drake, that is Steve’s code which he fortunately posted. You can see code I offered to allow for examining the issue in my post written several several days ago. My code is nowhere near as well-written, but I think it helps show how people can easily resolve questions about discrepancies in their results if they show their work/cooperate. Anyone can use my code or Steve’s code on both data sets and clearly see the choice of data set is what causes the discrepancy in our results.
Well, we are talking about Steve McIntyre here, not Michael Mann. I am pretty sure he wouldn’t have posted some code with the right file blatantly commented out and replaced with the wrong one if he was planning to pull a Mann (not that he could). Probably just figuring out how to address it.
I’m sure there is no nefariousness involved. On the other hand, I think much of the obstinance of climate scientists isn’t because of nefariousness either. That I don’t think people are being nefarious doesn’t mean I have to think they handle all disagreement fairly or appropriately. Given I’ve been raising this same concern for a month and a half now, I do think it is unfortunate it still hasn’t been resolved.
And not that it matters, but the right file wasn’t commented out. Only the wrong file was listed.
Nefarious?
Depends on motivations. We have clues concerning the motivations behind such scientists as Gergis or Mann. Or Phil Jones. Or Keith Briffa. Et cetera.
One could excuse these types if one were so inclined. But their practices are not justifiable except in terms of advancing the Cause.
“And not that it matters, but the right file wasn’t commented out. Only the wrong file was listed.”
Without knowing a darn thing about this coding language specifically, what else are these two lines?
loc=”http://www.metoffice.gov.uk/hadobs/hadcrut3/data/HadCRUT3.nc”
#loc=”http://www.metoffice.gov.uk/hadobs/hadcrut3/data/HadCRUT3v.nc”
Brandon, you mention that you’ve been raising “this same concern for a month and a half now”. Unfortunately, despite your earlier comments, I didn’t realize until recently that there was a variance-adjusted version of HadCRUT3, as well as a “regular” version, and so I didn’t understand what your point was. I apologize for that. I’m not arguing that you had not made the point, only that I didn’t understand the point at the time. Also, I didn’t spend much time on trying to figure it out at the time, as I get tired quickly and was trying to work on other topics and I only have so much time and especially energy.
Once I understood the issue about two versions of HadCRUT3, I re-calculated the results on HadCRUT3v. Having done so, I am firmly of the view that, while the t-statistic for Law Dome is less under HadCRUT3v than HadCRUT3, it still easily passed the t-statistic significance test and thus none of the conclusions of the post are impacted.
As an empirical point, do you agree that the Law Dome t-statistic is significant even with HadCRUT3v?
Nah Steve, you just CANNOT have Brandon Shellenberger wait that long and expect that excuses will be accepted without a thorough scrubbing and hose down…
I see my mistake now, that wasn’t Steve Mc’s code but “Not Sure’s”.
“Nah Steve, you just CANNOT have Brandon Shellenberger wait that long and expect that excuses will be accepted without a thorough scrubbing and hose down…”
Yup..
eloris:
That isn’t in the copy of the code I have or the code I see currently posted by Steve. I’m not sure where you got that from, but I suspect you’re using the code Not Sure posted. My understanding is Not Sure modified that code to test what effect Steve’s mistake had. That’s probably why you found the line but I do not.
Steve, first, I apologize for the slow response. I have been having strange internet problems since last weekend where some sites work and others will not (the inventory changes over time). It appears to be a problem related to the compression a proxy server my ISP is using. It’s weird. It’s not that I can’t connect to the sites. I just can’t get any HTTP traffic to work. I can still ping the servers or access them via FTP/SSH, and if I tunnel into another device off my ISP’s network, I can access the sites just fine.
Yes, I know people probably won’t care about that. I’m mostly wrote it on the off-chance somebody who sees this comment has some insight into the matter. It’s been very confusing. For everyone else, I just want to say I don’t know how responsive I’ll be able to be on any particular site. Twitter and e-mail are sure-fire ways to get a response though.
In any event, while I understand you didn’t recognize the mistake earlier, people have made several remarks about when I’ve commented to call for a correction to this post. I wanted to make it clear I did make multiple attempts to resolve this issue before calling for this post to be corrected.
No. As I’ve said several times before, whether or not it passes screening depends on how one handles missing data. Under at least one plausible approach, requiring a full summer season of data for each year, the proxy would never pass screening as there wouldn’t be a single year of data in the grid cell that could be used.
That has been my position since I discovered the mistake, and I imagine it will remain my position unless or until we can know how Gergis et al handled missing data in this portion of the3ir analysis. If I had to bet, I’d bet Gergis et al used a methodology that would have led to the proxy passing the screening test (absent the 50 year requirement). We do not have anything to establish that supposition as true though, and as long as that remains the case, I cannot agree with your statement.
In fact, I will say it is wrong and misleading as I have several times before. Making that statement without warning readers it requires we make an unverifiable assumption about the Gergis et al methodology is not acceptable.
Sorry not to have commented for a few days, as I’ve had some other things that I’ve had to look after.
In emulating G16, I downloaded data from the (now obsolete) HadCRUT3 webpage http://www.metoffice.gov.uk/hadobs/hadcrut3/data/download.html, downloading the HadCRUT3.nc version described as “Best estimate temperature anomalies”. I hadn’t taken note of the fact that Gergis et al 2016 had used the “variance adjusted” version, which, for Law Dome, is somewhat different than the “best estimate” version.
I don’t know what HadCRU do in their variance adjustment or what the supposed benefits of this adjustment are. For an isolated site like an Antarctic station near Law Dome, I’d be surprised if the variance adjustment has any actual benefit.
To the extent that Gergis et al purport to have any robustness to their results, their results should obviously not be sensitive to small decisions like whether one uses HadCRUT3 or HadCRUT3v as a target for screening. So even if I inadvertently used a different version in my emulation, one would hardly expect valid results to be unstable to such a choice.
In any event, I re-ran an identical analysis based on (1) HadCRUT3 and (2) HadCRUT3v. As I mentioned to Brandon on twitter, Law Dome easily met a t-test criterion for correlation under either dataset. Using the HadCRUT3 version, it actually had a conspicuously high t stat. The correlation and t-statistic were lower using HadCRUT3v, but still well above the screening criterion. I’ll try to post this revised code up when I get a chance.
To fix the post, I therefore need to add a couple of sentences to the post setting out results using the HadCRUT3v t-statistic/correlation as well as the HadCRUT3 t-statistic/correlation and will try to get to this.
I try to replicate results as accurately as I can and I regret not noticing that they used HadCRUT3v, rather than HadCRUT3. As noted above, I am unconvinced that there is any pressing scientific reason for using HadCRUT3v and can think of reasons why HadCRUT3 might be more accurate.
One additional issue is that we don’t have the HadCRUT3v version actually used by Gergis et al. There are details of Gergis screening which are thus far impossible to replicate using either version and it is possible that the answer lies with some past version of the data.
But the key point of the point is completely unaffected by this issue. Law Dome met the correlation criterion under either version and, in order to exclude it, Gergis added an ad hoc and unnecessary 50-year criterion, which had the effect of excluding Law Dome, but no other tree ring or coral series. Because there are so few “long” series, this arbitrary exclusion had a particular impact on medieval-modern relationships. Further, as I demonstrated in the post, arbitrary exclusion of Law Dome was an issue in IPCC AR4 and the parties in question are all aware of its properties.
The temperature dataset contains missing data. Gerg says “Mean SONDJF data for each
year from 1900 to 2014 were area averaged over the study domain”. As an attempt to interpret this, I took an average of available data using na.rm=T, thus making an average even if there was only one value. Brandon objected to this procedure, but G16 does not say how they handle the situation and this was a simple way of proceeding. However, if, for example, a minimum of three values was required, the precise value of the t-statistic changes a little, but not the significance.
Brandon was also concerned that my line of argument was trying to “get” Law Dome into the screened subset. However, as CA readers are aware, I have a longstanding antipathy towards ex post screening out of proxies. My longstanding preference is that specialists do not exclude proxies by ex post screening against temperature. My issue is with ex post exclusions, not ex post inclusions.
I submitted a comment which I believe contains an error. Unfortunately, the comment isn’t visible to me to verify. I believe I made a mistake I first made earlier today and only just now caught. Namely, I quoted a criteria used for handling missing data in instrumental verification as being used for the proxy screening step. If so, I apologize and would like to make it clear that is not correct. I accidentally jumped between two sections of text when looking up things in the paper without realizing they were far-removed.
That said, Steve has also quoted text from one section as applying to another:
As one should be able to tell by the fact the text refers to taking mean summer data and area averaging it over the study domain, this is a reference to the authors creation of the domain (area/regional) temperature field. It is not a reference to any aspect of the local correlation testing. I don’t think the difference is particularly relevant, but the timing seemed humorous.
Anyway, on the issue of handling missing data, I should point out something I’ve highlighted a few times in the past. Because Steve’s approach uses data for any year with any summer data, he uses several years with only a single month’s worth of data. As a result, he uses data for 1947, 1948 and then 1956. Whatever one feels about each of these years having only a single month’s worth of data, I think it is reasonable to say we shouldn’t calculate linear trends over 37 points of data when 2 of those points are separated from the rest by 8 years.
But yeah, I mostly wanted to correct that mistake I think I made. In the future, I need to remember to check things more thoroughly before talking about them in public. Especially if I’m going to write 3000 words about a different topic on that same day.
Brandon, I checked and was unable to locate any comment in inventory.
Because Gergis et al did not provide code, in cases where their methodology isn’t clear, one has to interpret. They didn’t say how they handled missing data in their calculation of summer temperatures. You say: “Whatever one feels about each of these years having only a single month’s worth of data, I think it is reasonable to say we shouldn’t calculate linear trends over 37 points of data when 2 of those points are separated from the rest by 8 years.”
You say that such an approach is not “reasonable”, but we don’t know how Gergis handled missing data. I think that it is entirely possible that they used a na.rm=T option in their algorithm without thinking about it based on the fact that didn’t mention a protocol for handling missing data. That’s why I reported this variation, I also checked requiring a minimum of 3 months and, for the purposes of the significance of the Law Dome t-statistic, the precise handling of missing data doesn’t impact the point, as I observed previously.
If you are concerned about whether their procedures were “reasonable”, there are many topics, even whether it was “reasonable” to use the variance-adjusted temperature data, as opposed to actual temperature data, a point on which you quite strongly asserted that my implementation was “wrong”, though it might well have been more “reasonable”.
Steve, it’s strange about the comment. It’s also funny though, as I mention in my comment above. In any event, I have absolutely no problem with reporting the results one gets with variations of methodologies. I think examining how Gergis et al’s results change based on what data set you use is a good idea. You might remember I myself was using HadCRUTv4 for a while during our discussions. If I wanted to do a thorough job, I’d probably even go so far as to look at how results hold up when using GISS or perhaps some other data set.
Similarly, I have absolutely no problem with examining what results one gets when they test different data handling processes. I would certainly want to know the results with the condition which I say isn’t reasonable. After all, I’m not going to assume Gergis et al made entirely reasonable choices. We already know they didn’t since they used the 1921-1990 period for their correlation tests while claiming to use the 1931-1990 period (and thus they used the overlapping 1901-1930 period for verification).
The issue I have consistently raised is not in what choices one makes. The issue I’ve raised is that one should not attribute choices to the authors if we cannot know the authors made those choices. When we make assumptions about the authors’ methodology we cannot verify, we are obliged to say so so people are aware of potential areas in which our attempts to replicate the authors’ methodology may differ. You say you “reported this variation,” but you fail to acknowledge you did nothing to indicate it was merely a potential “variation.”
And as I’ve said practically since I first discovered your mistake, if one requires full seasonal summer data, the proxy does not pass correlation due to the amount of missing data.
You portrayed yourself as replicating the Gergis et al methodology. That obliges you to use their methodology, even if it isn’t reasonable. Looking at potential variations on the Gergis et al methodology which might be better is fine, but when you do it, you need to distinguish it from replicating the Gergis et al methodology itself. You certainly shouldn’t make claims about what the Gergis et al methodology itself would show if those claims are, or at least could be, due to changes in the methodology you’ve made.
Brandon:
Steve attempts to replicate, he doesnt “replicate”
Replication is impossible when authors refuse to share code and methods.
thats the point.
” I accidentally jumped between two sections of text when looking up things in the paper without realizing they were far-removed.”
go figure..
RE: Brandon Shellenberger: “In the future, I need to remember to check things more thoroughly before talking about them in public.”
Words to live by . . . I mean for everyone.
“check things more thoroughly before [publishing them] them in public.”
Words for peer reviewers.
You have to watch some people.. they will savage others for making mistakes, while excusing themselves for the same thing.
Its too funny.
Sometimes all you can do is laugh.
Shollenberger at Lucia’s comment #150356
“And oh, wow. I really should have read JD Ohio’s last comment in its entirety.” See http://rankexploits.com/musings/2016/does-hillary-clinton-have-serious-health-problems-a-real-question-not-an-accusation/
JD
ATTP
Brandon acknowledged his mistakes that he discovered himself swiftly and honestly. How many times have we seen you doing this?
Or Mosher
Sven,
I’ve no idea how many times you’ve seen me do it. Made plenty of mistakes; acknowledge all of which I’m aware – of course, I do mean mistakes, not “things you disagree with”.
Sven:
In an interesting twist, I actually corrected my mistake before the mistake was published. As I mention in the comment with the correction, my initial comment got caught in moderation. The comment with the correction did not. The result was for a little while, you could see the correction before anyone saw the mistake. I’ve long said people should promptly acknowledge their errors, but I had never considered preemptively acknowledging them 😛
As for the question you ask, an interesting follow-up is how do various people react to having errors pointed out. It is interesting to see who gets whiny/petulant, who puts little to not effort into understanding the criticism and who actively listens to those who point out supposed errors.
In this case, if people want to criticize my for making a very stupid mistake, I can’t blame them. While some people might wish to pretend I hold myself to a different standard, the reality is I fully accept that I made a very stupid mistake. Harsh criticism would be justified.
I mean, yeah, I’m not going to put much effort into posting comments on blogs to beat myself up. That’s not excusing my mistake though. It’s just recognizing I have better ways to beat myself up for my screw ups.
I seem to be having a lot of trouble getting comments to land where I want them on this site. I’m not sure what’s up with that. I thought I clicked on the right Reply button.
In any event, I just saw Steve says he doesn’t see the comment I submitted with the mistake I made as being hung up in moderation. I also don’t see it as having ever gone through. I’m not sure what’s up with that. It’s pretty funny though. Since the comment isn’t there and appears to have never been published, I guess nobody will ever see it (I didn’t keep a copy). You do get to see my comment acknowledging the mistake though.
I felt it was amusing when I thought I only preemptively corrected my mistake. Now, it’s hilarious. I didn’t just acknowledge a mistake in advance of anyone seeing it, I acknowledged a mistake nobody will ever see! And apparently some people think that paints me in a negative light. My life is strange at times.
Hi Brandon,
Maybe you can keep it as a credit in case you ever make another mistake.
jferguson, I don’t know. It seems like I’d be better off not admitting any mistakes (unless absolutely forced to). Not only does that appear to be acceptable to climate scientists, but as we see here, it seems acceptable to skeptics as well. It’s been two weeks since the error in this post was clearly demonstrated, and our host has even acknowledged it. He hasn’t made any note in the post to warn people though, and nobody seems to mind.
I get Steve thinks the error “doesn’t matter,” but… come on. How long does an error everyone participating in the discussion knows about get to stay uncorrected? If I wouldn’t make an issue of it, I bet the answer could be, “Indefinitely.”
Then again, I guess it might not really matter. Because of how long a delay there’s been, it’s unlikely many people would even notice an update to this post which acknowledged the error.
Do you think the goal is to kill the Law Dome d18O series?
ptolemy2, if I were trying to be a “successful” paleo-climatologist I would want as many series as possible. A chef does not throw away rarely used spices in case just the right occasion might arise.
Ron
I agree 100%
The point of my question was to imply that it would be very very bad indeed, corrupt and oppressive, for the climate establishment to burn Law Dome for its politically incorrect message.
The fact that this was not clear, that it was plausible to interpret my post as somehow assenting to such a burnning, paints a dire picture of the politics of climate change (this is no reflection on you personally of course).
Yes – climate science needs the Law Dome data.
Hiding it and killing it would be bad, not good.
https://www.statnews.com/2016/09/21/chronic-fatigue-syndrome-pace-trial/
Very interesting, especially the “vexatious” defense of the university to a FoIA request, followed by an ICO ruling and eventual release of the requested data. At each stage, foot-dragging was maximized.
Yes, it’s very interesting and disturbing. In order for science to get better people must admit there’s a problem. Turning a blind eye to the replication crisis seems particularly strong among those alarmed about climate change.
Wikipedia gives the Chancellor of Queen Mary College as HRH Anne, Princess Royal (daughter of Elizabeth II).
One has to wonder if she takes any interest in the affairs of this college or if she is content to be a figurehead. Presumably, she has the intelligence to comprehend what has been done.
Steve Mosher posted a similar link at ATTPs and within a few hours there was a new post doing damage control. It is yet more evidence that climate alarmists tend to be apologists for the current science establishment and to be particularly sensitive to anyone asserting that climate science, dealing with very small deltas in a very complex system, might be subject to bias. It is really more proof that suspicion is justified.
I do not judge that getting into personalities on these issues such as Gergis 2016 and post fact selection have much bearing on the issue at hand which is what will a sensitivity test using other criteria for post fact selection of proxies reveal about the arbitrariness of the method and in effect showing the inappropriateness of the post fact selection method. I would suspect that the authors of Gergis 2016 are simply following the precedent established from previous temperature reconstruction of using the post fact selection without questioning, or perhaps understanding, the statistical problem in using that method. I think once post fact selection is accepted the further torturing of the data can readily follow and without any limitations. If using other temperature data sets such as Had CRUT3v or HadCRUT4 or using annual instead of seasonal data or using only a 5X5 grid of instrumental temperatures in which the proxy location resides or using the longest possible period for which instrumental and proxy data have common points yields very different results then I would think that perhaps that even without understanding the basic problem of using post fact selection the weakness of the process is revealed and certainly the arbitrariness of post fact selection is certainly revealed. Even the presentation of the data can be arbitrarily altered by changing the smoothing of the reconstruction series.
kenfritsch:
The authors of Gergis et al (2016) used HadCRUT3v so it cannot be an example of “using other temperature data sets.” I believe your point should say HadCRUT3. I was going to suggest you should make sure you’re using the right data set for your analysis of the paper, but I see you’ve chosen to use HadCRUT4 instead, so I guess that’s not an issue. That did make me notice this remark of yours though:
Which is just wrong. Many proxies are well known to not represent annual temperatures, but rather, seasonal temperatures. Comparing such proxies to annual temperatures is simply wrong. On another issue, I see Steve wrote:
I hadn’t noticed the issue in that comment from two months ago until now since at the time he wrote it I didn’t know he had actually downloaded HadCRUT3 instead of HadCRUT3v. I made the seemingly natural assumption that he used the data he said he had used. I suppose this is yet another argument for publishing data and code with one’s claims, or at least when those claims are questioned. It’s now been over two months that this error has been “on the record” despite it being questioned.
Not only does that seem bad on principle, it also kills any interest I have in examining this paper further. Why should I bother doing real work if I know untruths would work just as well as truths?
What is of most important interest in a temperature reconstruction for climate scientists is the annual temperature and changes in that temperature over time. If the annual temperatures do not correlate with a proxy growing season response over time then the proxy response is not a good predictor of annual temperatures. I believe that the instrumental record shows that there is a very good correlation of seasonal and annual temperatures for the Australasia region. I doubt very much that there is independent data showing that the temperatures for the months SONDJF are optimum for temperature to proxy response for all the tree ring, coral and speleotherm proxies used in Gergis 2016. The arbitrariness of that post fact selection criteria should be checked with a sensitivity test consisting of looking at other monthly combinations.
If the claim of the paper is going to be about about annual temperature changes and unprecedented warming and not confined to a claim about SONDJF then I would think annual temperatures should be used for the (incorrect) post fact proxy selection criteria.
Ken, not only does your comment make a lot sense, it highlights the omission by Gergis of supplying or citing the correlation between SONDJF and annual temp. for the Australasia region. And, as Steve Mc pointed out, there needs to be a stated logic of why one record series is preferred over another and the effects of that choice on correlation scores.
Kenneth, while you may feel entitled to dictate what people should and should not care and write papers about, I would suggest you at least read the papers you condemn so you don’t go around saying obviously untrue things. I’ve suggested this in regard to this paper before, but unfortunately, you seem to have still not read the paper as you say:
Even though the authors explicitly compare their results to the warm season in the modern instrumental record. You can cry and moan all you want about this and that being “post fact selection,” but the reality is this paper’s stated purpose is to reconstruct summer temperatures. It considered many proxies with an expected or even known relation to summer temperatures, such as tree rings whose growing season is during those months. This is a perfectly normal approach.
All you are doing is changing the standards after the fact while not even bothering to examine the reasons for the ones the authors used (or even read the paper) and defending this by claiming the authors used “post fact selection” when all that really means is they didn’t do what you’d have liked them to do.
This paper is garbage, but your comments do nothing to demonstrate that.
Ron Graf:
Yes, his comment highlights an omission which is completely unremarkable as the authors looked at summer temperatures, not annual ones.
Perhaps you should suggest to Steve he apply this standard to his post on the Law Dome proxy. In the meantime, you might consider the primary literature on many of these proxies identify them as being proxies for summer temperatures. Additionally, you might take note of how the authors even used correlation to winter temperatures in determining which proxies to treat as proxies for summer temperatures.
I had some time to compare the correlations of standardized proxy response (orientated in the proper direction for proxy type) for the 28 Gergis selected proxies to the corresponding 5×5 grid HadCRUT4 mean temperatures from KNMI for the months September through February and for the months September through August. I used the time period 1881-2001 where the proxies and HadCRUT4 grids had common data.
The linked results below show no statistically significant difference in average correlations for these two different selections of months.
I’ll show results for this comparison with detrended residuals next – after I return from an afternoon visit to IL farmland.
I looked at the detrended series for correlations between the 28 post fact selected proxies (standardized by centering and scaling) from the Gergis 2016 paper and the corresponding HadCRUT4 5×5 grids corresponding to the proxy locations. I have linked those results below. I used several monthly HadCRUT4 series for the correlations. As the results show none of the average correlations for the various monthly series are even close to being statistically different than the months used in the Gergis paper and namely the series in the table for Sep-Feb. That series did have the highest correlation but the difference was was not statistically significant. Most of the difference, albeit not significant, between the Sep-Feb and Sep-Aug series correlations are due to 4 coral proxies as shown in the table. I find it of interest that the 3 month series for Dec-Feb which should be the warmest in the southern hemisphere had the lowest proxy response to HadCRUT4 grid correlation of all the monthly combinations that were calculated. The correlation of the HadCRUT4 grids for the Sep-Aug to Sep-Feb months detrended series was 0.82.
It should be noted here that the monthly HadCRUT4 grid series always preceded in time the standardized proxy responses. For example, if the monthly HadCRUT4 series started in 1900, the proxy response series would start in 1901. Also to be noted is that using Sep-Feb correlations for HadCRUT4 5 x 5 grids (and not HadCRUT3v as Gergis 2016 used) gave 2 more proxies (Great Barrier Reef and Havannah) that passed the incorrectly used correlation post fact selection test than when the Sep-Aug months were used.
The time period for the correlations was from 1881 to 2001 for all the common data points for the proxy response and HadCRUT4 grid temperatures.
3 Trackbacks
[…] https://climateaudit.org/2016/08/03/gergis-and-law-dome/ […]
[…] something I probably should have written up a while back. You see, over a month ago Steve McIntyre wrote this about the recent Gergis et al […]
[…] Do the changes matter? Maybe, maybe not. That's up to each individual to decide. They just can't make an informed decision if McIntyre hides his errors from them. And hides them he does. You see, the error leading to these changes has nothing to do with the issue I raised. After he updated his post (without me realizing the extent of the change), I wrote several comments at his site (and more on Twitter, to which responded) pointing out his code clearly showed he used the wrong data set. Four days after I initially demonstrated this, McIntyre commented: […]