Gifford Miller’s most recent study on radiocarbon dates of Baffin Island moss has attracted recent publicity, including covers at Judy Curry, WUWT and Jim Bouldin, due to its claim to have demonstrated that the present is the warmest in 44000 years.
Over the past decade, Miller has been taking radiocarbon dates on moss exposed from receding glaciers/ice caps on Baffin Island. Up to his most recent study, these dates have been used to develop a chronology of ice expansion and recession. Miller’s sampling protocol focuses on “ice caps” rather (moving) glaciers and on short-lived moss (rather than longer-lived macrofossils). Miller assumes (reasonably enough) that the moss was engulfed by ice cap expansion – the expansion indicating a decline in temperature – and that the moss has not been subsequently exposed (since it degrades relatively rapidly upon exposure).
Miller’s article reports on 145 radiocarbon dates from recently-exposed moss, the vast majority of which are dated to the past two millennia, as shown in the histogram below of radiocarbon ages for the 135 Holocene dates (plus 10 pre-Holocene dates.)
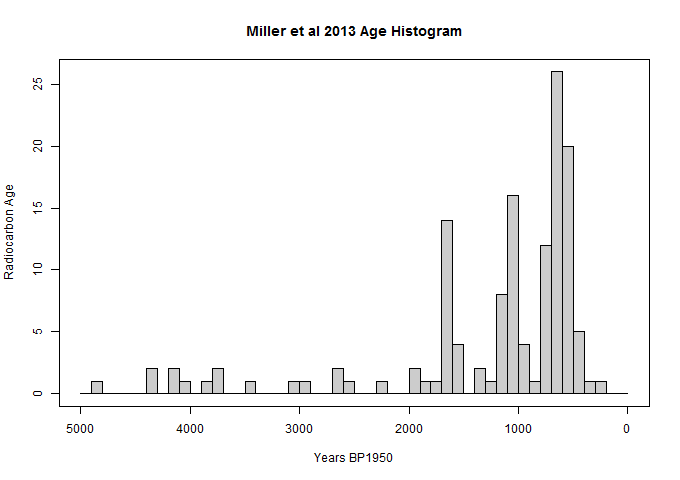
Figure 1. Histogram of Radiocarbon Ages from Recently Exposed Baffin Island mosses (Miller et al 2013 GRL). Note: y-axis label is wrong. This is a histogram and y-axis is counts.
At the majority of locations, receding ice is exposing moss that was engulfed by Little Ice Age glacier expansion. At a sizable minority of locations, receding ice is exposing moss that was engulfed by earlier glacier expansions (especially first millennium AD and first millennium BC). These Holocene glacier expansions are consistent with other millennial evidence e.g. treelines moving south, ice core melt and oxygen isotopes. In an unpublicized part of Miller et al 2013, Miller estimated a secular lowering of glacier of 129 m/ 1000 years, with a 19th century low about 200 m below 20th century levels.
From the lowering of glacier lines, Miller estimated a reduction of about 2.7 deg C in summer temperature over the past 6000 years or so. Miller observed that estimates from CMIP5 climate models were much lower – about 1.1 deg C – from which he deduced that things were worse than we thought.
Some of the exposed samples are increasingly earlier in the Holocene, with the earliest Holocene sample at 4285 radiocarbon BP (calibrated 4900 BP). It should be noted that these dates do not coincide with peak Holocene warmth, dated to ~6000-7000 BP on much other evidence.
In addition to the 135 sites where Late and Holocene mosses have been exposed, Miller sampled 4 sites (10 samples) where the mosses were dated deep into the LGM or at or near the radiocarbon detection limit (~44000 years). It was on the basis of these samples that the warmest in 44000 years claim arose.
Curiously, this claim is remarkably similar to claims made by Lonnie Thompson in 2005 at Quelccaya (see CA discussion here, here here). In this case, “remarkably similar” means remarkably similar as normally understood, rather than as used in climate science. Thompson also based his claim on radiocarbon dates from moss (Distichia) exposed by receding glaciers. As in Baffin Island, the vast majority of Quelccaya radiocarbon dates were from the 4200BP and later, but there was at least one at the radiocarbon detection limit. Like Miller, Thompson hypothesized that this moss was evidence that temperatures were the warmest since the Eemian.
Since Thompson’s 2005 news release, there have been a couple of academic articles on the Quelccaya moss with Holocene dates, e.g. here which reported:
In this case, we can infer that not only one species but a community of plants occurred at a high-elevation location ∼5000 yr ago under likely warmer conditions.
However, I haven’t seen anything further about Thompson’s “Eemian” moss. If anyone knows anything more, I’d be interested. The outcome of Thompson’s “Eemian” moss seems like it would be relevant to the appraisal of Miller’s Eemian moss.
Miller et al provided the following helpful photo of the location from which one of the “Eemian” samples was taken. Miller commented that the moss is observed only in the immediate receding vicinity: the rock quickly becomes barren.
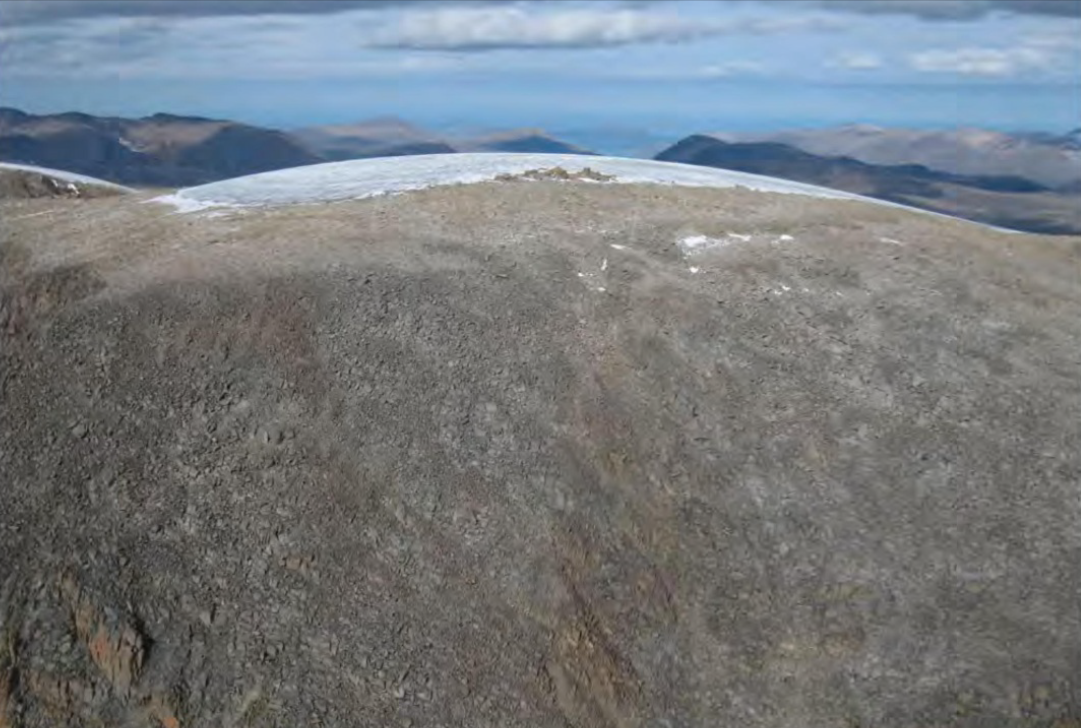
Figure 2. Photo of site of samples M10-B231v and B232v, dated at or near detection limit.
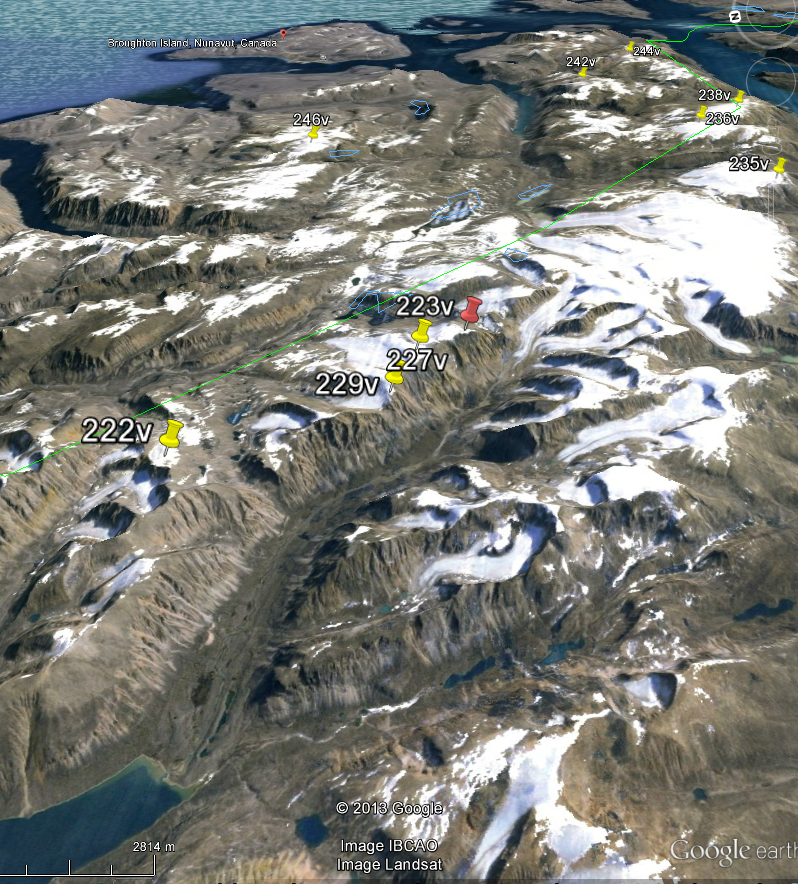
There are a couple of nearby locations at which the exposed moss from receding ice caps at slightly greater altitudes merely has Holocene dates. “Eemian” sample B231v is at 1395m altitude. However, samples B223v and B226v are both slightly higher and located nearby (with a km or two) along the same ridge, but the exposed moss is merely Holocene (~4200 BP). A question: How does one reconcile the supposed in situ continuity of the little “ice cap” in the vicinity of sample M10-B231v (1395 m) since 44000 BP with recession in the vicinity of nearby higher M10-B226v (1438 m)?
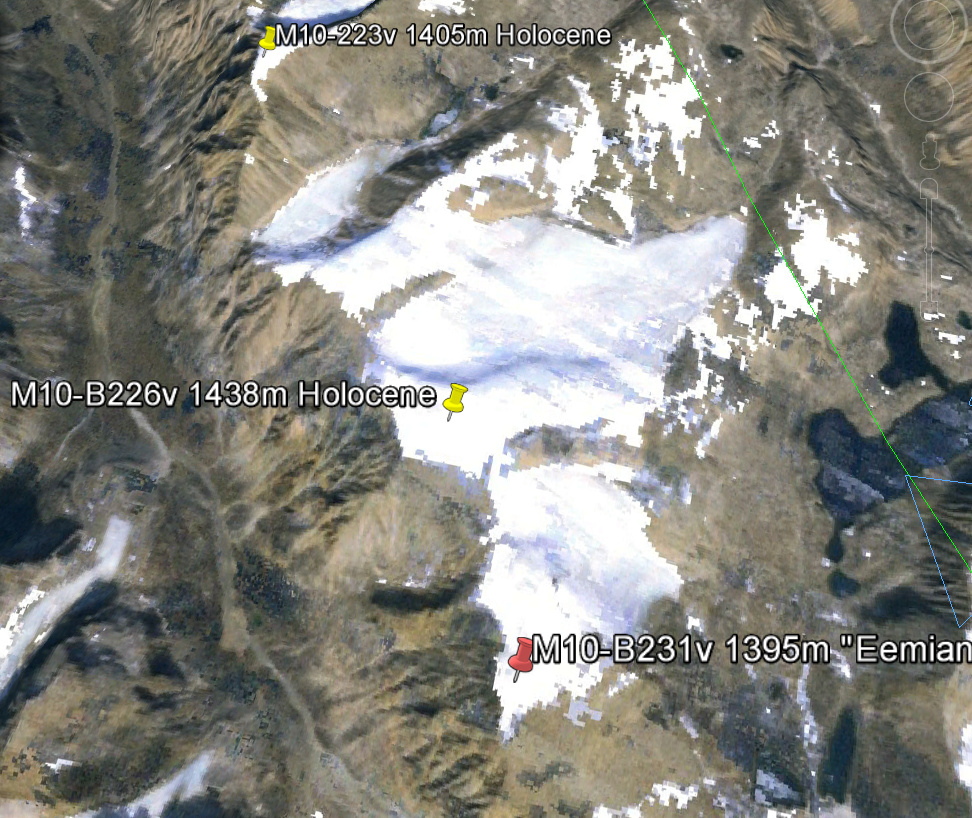
Figure 3. Google Earth map in area of M10-231v.
Postscript: I’ve covered Miller’s work (relatively favorably) in the past – see here and here. Miller is a reputable scientist whose work rises above the data snooping, data mining and regression against increasing trends of self-opinionated verbiage (to borrow Briffa’s phrase) that is too prevalent in the field.
Much of Miller’s work has been the articulation of Late Holocene glaciation, up to and including its relative maximum in the Little Ice Age, from which numerous Baffin Island locations are still emerging in his recent study. Miller was coauthor of the Hvitavatn (Iceland) sediment series, with Miller attributing the Little Ice Age maximum of this proxy to cold, rather than warmth, and conversely for the Medieval period. As I noted in my coverage of PAGES2K, Kaufman and the PAGES2K authors used Miller’s series upside down, thereby attributing its 19th century maximum to warmth rather than cold. The PAGES2K Arctic reconstruction does not stand or fall on this error. However, it is one of relatively few series that show any Stick-ness and the other Stick contributors also have serious problems (e.g. contaminated sediments.)
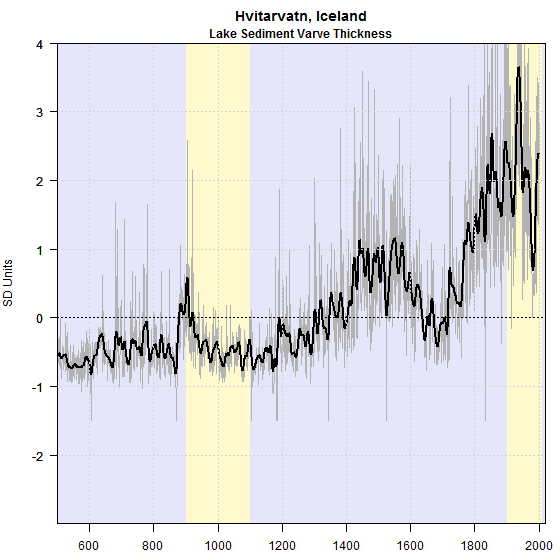
Figure 4. Gifford Miller’s Hvitavatn series as used by PAGES2K Arctic.
Update: Oct 27. Andrews et al 1972 has an air photo on which the locations of B221v and B223v are shown. First, here is a google earth image looking east towards Broughton Island with sites marked – oriented to correspond to the 1972 air photo. The red pin shows the location of the ancient moss.
Next here is the air photo from Andrews et al 1972.

After discussing recent deterioration in summer temperatures, Andrews et al 1972 observed:
The evidence strongly suggests that glaciation of Baffin Island will herald the next glaciation of North America although the timing of such development is unknown. The climatic glacial mode may develop rapidly, but there is a lag of the order of 10,000 years in the subsequent buildup of a continental ice sheet… The recent climatic fluctuations in the area are on too short a timescale to be viewed with alarm. The main control on glacierization in eastern Baffin Island is snowfall, not temperature.
Co-authors of Andrews et al 1972 included Gifford Miller and Raymond Bradley.


68 Comments
If you go back beyond 20k
Glaciation carries the day
He’d have just as well thundered
“in well over a hundred”
In the ice age, it’s easy to say
But the glaciers push, and decline
Lubrication? Heat? Slope incline?
Hot and cold seems, by chance,
To make glaciers advance
If their Story advances, that’s fine
But declines were all over, t’would seem
In old newspaper tales by the ream
And if they declined then
In the cold way back when
What a riddle this makes for the Team!
===|==============/ Keith DeHavelle
Not exactly on point, but it’s near…
There’s a 2013 paper here.
It’s on Quelccaya ice
And its moss. It’s quite nice
Be-dating and photos appear:
===|==============/ Keith DeHavelle
Wouldn’t most of the NA continent have been beneath a mile of ice, about 44,000 years ago? I can see how it might be a Tad warmer than that, now…
Probably the fraction under ice sheets was around half. In the east the Laurentide Ice Sheet pushed south into Pennsylvania covering New York state and I believe Delaware, and also into but not over Indiana, Illinois, and Ohio. To the west the Cordilleran Ice Sheet pushed southward in a patchier fashion along the Cascade-Sierra, and Rockies. The Great Basin was covered in some immense fresh water lakes. Oddly perhaps, northern Alaska was pretty much ice free. The peak of the last glacial – Wisconsin in NA and Wurm in Europe – was probably about 8 degrees C colder than the present based on the Vostok ice core. Greenland (GISP) data suggests as much as 20 degrees C colder in the Younger Dryas from about 13,000 to 11,000 BP, depending on the source. So, yep, it is a lot warmer now than then.
Some large ice caps have been ever melting since the end of the last ice age.
(e.g. according to AR5 sea levels stayed flat during the little ice, meaning continued ice cap melt has opposed the ocean cooling and glacier advance elsewhere.)
If an ice field has been melting during most of the time in the holocene, exposure of moss in not an indicator of extreme recent temperature.
It may have been warmer in the past, but it was just the last bit which melted recently.
Manfred,
My thought exactly.
Re: Manfred (Oct 26 16:17),
Good point Manfred. In fact, I think that destroys the whole argument when it comes to determining the temperature from ice caps. Once the current melting reaches the last minimum ice cap size, you will resume melting out areas / moss belonging to the previous minimum, you will start melting out older material which will have older dates, quite ill-respective of current temperature; as long as the temperatures are high enough to actually melt / sublime ice.
Some large ice caps have been ever melting since the end of the last ice age.
—————-
It’s always a good idea to read the post you are commenting on before writing something silly.
“At a sizable minority of locations, receding ice is exposing moss that was engulfed by earlier glacier expansions (especially first millennium AD and first millennium BC). These Holocene glacier expansions are consistent with other millennial evidence e.g. treelines moving south, ice core melt and oxygen isotopes.
…, Miller estimated a secular lowering of glacier of 129 m/ 1000 years, with a 19th century low about 200 m below 20th century levels.”
As far as “silly” goes, “sizeable minority” looks rather oxymoronic, don’t you think? Consider also that moss which was engulfed, was growing on land that earlier had been “ungulfed” to coin a phrase. In fact, discussing the “sizeable minority” leads to questions regarding the “miniscule majority” of sites and what has been happening there.
IOW? There’s no “reset” after each wave of melt, but generally a cumulative process. So the specific historical sequence must be known.
Dear Steven,
Should the y-axis in the histogram be “# of radiocarbon samples” rather than “radiocarbon age”? If not, I’m afraid I don’t understand this graph … it seems to me that “radiocarbon age” and “Years BP/1950” are suppose to be two different ways of saying the same thing: how old the samples are.
Thanks.
Steve; Yes. y-axis label is wrong.
“It should be noted that these dates do not coincide with peak Holocene warmth, dated to ~6000-7000 BP on much other evidence.”
Nor would one expect the dates to coincide with peak Holocene warmth. Rather they should date to when the ice caps expand, with most dates when the ice cap expands fastest.
“How does one reconcile the supposed in situ continuity of the little “ice cap” in the vicinity of sample M10-B231v (1395 m) since 44000 BP with recession in the vicinity of nearby higher M10-B226v (1438 m)?”
Consider the sequence of events. Moss grows in the Eemian, is covered by ice during the last glacial, most of this ice melt during the Early Holocene. Remnant ice cap regrows in the Late Holocene, and largely melts in the 20th Century. There is a large unconformity in the ice, once the last of the Late Holocene ice has melted, Eemian moss will immediately begin to be exposed. The Late Holocene moss found by Miller may only be a metre away from Eemian moss under the ice.
Also consider that the ice cap in not in equilibrium with climate. Some areas will have accumulated more ice during the Late Holocene because of the geometry of the ice cap and so will take longer to melt out.
Richard,
your “answer” is unresponsive to the question. The question is not merely how Eemian moss might have survived to its present exposure, but how one could have a climate at which moss can grow during the Holocene at site B226v at an elevation of 1438 m, while permitting the continuation of an “ice cap” as tiny as that hosting sample B231v (43 m lower)? Why wouldn’t B231v have melted out before B226v?
An additional consideration in posing this question (and one that I had in mind but did not properly articulate) is that at Quelccaya, where Thompson also reported both Holocene and 50000 year old moss at the margin of a receding glacier, Thompson reported that the present limit of live moss was about 400-500 meters lower than the elevation of the exposed moss.
I presume that the modern limit of live moss is also well below the present edge of the receding Baffin Island glacier. While I understand that there is a delay in moss migrating uphill and that the potential “mossline” under current temperatures is higher than the observed mossline, it is not evident the mossline where moss can establish and reproduce is as high as the glacier equilibrium line. It would have been helpful if Miller et al 2013 had commented on this question.
If there is any difference, then this further increases the question of how one has Holocene moss growing at 1438m at B226v while a tiny covering of ice pesists at nearby B231v.
BTW, I notice that you slagged me at your own blog on this topic but did not discuss or link to my actual post on the topic or report my present (and past) favorable comments on Miller’s approach.
BTW do you know what happened to Thompson’s +50000-year-old moss? It has somewhat fallen out of view since his 2005 news release. Unfortunately Thompson has a poor record of not reporting “bad” results e.g. Bona-Churchill and Thompson’s failure to report further on the +50000-year old in articles on the Holocene moss at least raises the possibility that there was some hair on the dating of the ancient Quelccaya moss. Not saying that there is, but when one cannot rely on authors to disclose adverse results, one has to account for a wider variety of possibilities. So if you can get any news on the ancient Quelccaya moss, it would be appreciated.
Another important variable on Baffin Island is the change in ice elevation over the Holocene. The location of the present samples is near the Penny Ice Cap, which was described by David Fisher, a knowledgeable Canadian ice specialist here.
During the LGM, Baffin Island glaciation was included in the Foxe Dome. In the early Holocene, Fisher argues that the glacier elevation was considerably higher than at present and was lowered through the high summer insolation of the early Holocene.
There is extensive specialist literature on glaciation history on Baffin Island, a topic that has interested specialists for many years. It seems that ancient relicts from ice recession on Baffin Island have been regularly reported in specialist literature. For example, at the Barnes Ice Cap in northern Baffin Island, Pleistocene ice is apparently exposed through ice cap recession. It would be interesting to test the ice in the B231v “ice cap” and test to see if it can be classed as Pleistocene rather than Holocene ice.
Because of the very large changes on Baffin Island through the early Holocene, including a major reduction of glacier elevation, it is not evident that the recent exposures can in themselves constitute a comparison of Early Holocene and present temperatures, though they definitely show a resumption of the glacier drawdown that was interrupted by the Little Ice Age.
The age of melting ice at the different ice caps will be dependent on their slope, aspect and situation, which will affect the amount of ice accumulated during the late Holocene and the melt rate in the current warm period. I’ve written more on my blog. It would be amazingly improbable for Eemian moss to appear from all the margins of all the icecaps simultaneously. But let’s wait three years to have a PhD student model the fine details of the icecaps before making a declaration that the appearance of Eemian mosses indicates a warming climate.
Miller et al imply that moss grows around the glaciers, but take some time to colonise: “In order to avoid age bias from re-colonization and regrowth, we restrict our sampling to rooted moss within 1 m of the ice margin”
I slagged you off at my blog because you posted a comment at WUWT that was irrelevant and misleading: the old carbon effect in aquatic mosses has no impact on the radiocarbon dates of terrestrial mosses. Further, you didn’t take the opportunity to tell Watts that he was writing nonsense. I somehow don’t think that he would threaten to ban you, nor would the hysterical mob he attracts attack and some of the readers might think.
I didn’t link to this post as I wrote my piece before I was aware you were going to write anything.
I know nothing about Quelccaya. I don’t follow South American glaciology closely.
Telford said
“But let’s wait three years to have a PhD student model the fine details of the icecaps before making a declaration that the appearance of Eemian mosses indicates a warming climate.”
Oh, is that the conclusion which was made?
Quite reserved, eh, Richard Telford?
Re: richard telford (Oct 27 11:21),
Preservation of organic matter from the Eemian is, to my knowledge, unprecedented. Suspecting dating issues is perfectly reasonable. It is misleading to state that the distinction is between terrestrial and aquatic mosses – more correctly, the issue is with whether an organism obtained its carbon from a “reservoir” that is depleted in C14. If the “Eemian” samples were spread out over much of Baffin Island, I would agree with you that a “reservoir” effect would be unlikely, but these samples are fairly tightly clustered. With all due respect, I would suggest that dating issues aren’t completely off the table.
Eemian organic matter is widespread. Eemian organic matter form under ice caps much less so because there is little Pleistocene ice exposed, and only some of that is cold based.
It is in no way misleading to make a distinction between aquatic and terrestrial mosses. There is a widely known and well understood mechanism for incorporating old carbon into aquatic mosses. Terrestrial mosses get their carbon from the atmosphere so have no source of old carbon – unless they are growing on a volcanic fumeroles or hotspring out-gassing CO2. Neither of which apply to Baffin Island. It only takes a few seconds to check whether the moss tested is terrestrial or not.
Further, even if by magic the terrestrial moss used old carbon such that half of the carbon was old. The date would be one half-life too old, so the sample would now date ~38kBP rather than 44kBP. This would not change any of the conclusions.
So whereas it is entirely reasonable to first think of potential dating problems – it was the first thing I did – it should only take a few seconds to realise that they are implausible.
“Preservation of organic matter from the Eemian is, to my knowledge, unprecedented.”
Not at all, organic material (e. g. peat, tree stumps, pollen, organic lake deposits) from the Eemian is quite common and widespread.
However using a few odd tufts of moss to date glacier advance/recession is a quite shaky method. Using uncovered material for dating glacier advance/recession requires that it is definitely still in growth position. This is easy enough to verify for e. g. tree stumps, but much less so for loosely rooted plants like mosses. For example an ice cap may have formed after the end of the Eemian that was cold-based (i e frozen to the ground). Such ice is non-erosional. At some later time (e g the warm early Holocene) the ice cap might change to being warm-based and start eroding the ground it is lying on, in which case the eemian mosses may be far from their original position.
The moss is rooted. The plants are in situ. They have not moved from where they grew, and are so fragile that they would rapidly turn to dust if moved. The idea that they could be moved by a warm based glacier is ridiculous – the moss would be ground to a pulp.
“The idea that they could be moved by a warm based glacier is ridiculous – the moss would be ground to a pulp.”
Not necessarily. Finding fragile identifiable fossils that have been moved by glacial action is not uncommon, at least in northern Europe and I don’t think American glaciers are really that different.
Fragile material in a glacier, sure. Fragile material under glacier? Warm-based glaciers grind rocks into clay, do you really think moss stands a chance? In any event, it would no longer be rooted.
Richard,
It would be amazingly improbable for Eemian moss to appear from all the margins of all the icecaps simultaneously.
The same mechanism that could cause Eemian moss to appear from under the same cap at the same time as younger moss scuttles the logic behind the “warmest in 120ky” claim.
Essentially, you claim that there are two melts. A previous cooler melt at temperature X, and a current warmer melt at, say, temperature X+6. You argue that there exist areas that previously melted at temperature X, allowing Eemian moss to be replaced by fresh Holocene moss at those sites. You also argue that, after refreezing, some of those sites stubbornly refused to melt the next time they saw temperature X. Micro-climate variables like slope, aspect, situation, etc create a circumstance that allows them to keep their ice thru temp X, to X+1, or X+2, etc. Only now that they have reached temperature X+6 are they melting, releasing their trapped Holocene moss at the same time some adjacent sites are melting for the first time in 120ky to expose their Eemian mosses.
OK. Plausible.
However, accepting the existence of sites that may sometimes melt at temp X, and at other times may hold onto their ice thru temp X to melt at X+6 also renders plausible the scenario wherein the warmer melt event happens first. Perhaps there was an X+5 temp event 3kya. Those occasionally stubborn sites that can hang on to their ice up to X+6 keep their Eemian mosses safely frozen. Now, at temp X they melt, exposing their Eemian mosses at the same time younger mosses are being exposed at adjacent sites that have melted at temp X (or lower) before.
Both scenarios are consistent with the observations, and with the sketchy assumptions regarding exposed moss survivability, C14 reliability, max 70M ice capacity, unvarying general temp/melt response, etc.
“You also argue that, after refreezing, some of those sites stubbornly refused to melt the next time they saw temperature X. ”
This is *NOT* what I am arguing.
What I am am arguing is that the icecap is in a non-equilibrium state, and that the survival of late Holocene ice is a transient state.
For example, areas that accumulated lots of ice in the late Holocene will take longer to melt out than areas that accumulated less ice.
Richard,
Isn’t it?
Are you arguing that all temperatures are held and trends do not reverse until every ice cap has reached equilibrium?
For corollary example, the same thing could have happened during an earlier period when higher temps than current were reached. Preserving some ice over Eemian moss/lichens. Exposing other moss to degradation and replacement with the younger, C14-enhanced model.
Simultaneous exposure of Eemian and Holocence mosses complicates the historic temp analysis in ways that are inconvenient to your chosen narrative. Not that it is necessarily wrong, just that it is not necessarily correct.
Re: richard telford (Oct 27 04:40),
Well, this is better than your previous snarky remark, but it still doesn’t show that temperatures are higher now than they were earlier. We’ve melted back to where the ice was (or rather wasn’t) 44k ago in some areas, but as I said before temperatures may be somewhat lower as long as they’re high enough to allow melting / sublimation. And the same goes for intermediate accumulation – decumulation cycles.
The icecap can only shrink when it is not in equilibrium with climate. Once it is in ~equilibrium it will stop shrinking. Not once in the last 44ka was it warm enough to melt the ice that has now melted.
Richard:
That comment is not actually consistent with your previous points – which is that once a certain temperature is reached, the ice begins to melt. The characteristics of that melt, however, are impacted by a number of other variables:
“Some areas will have accumulated more ice during the Late Holocene because of the geometry of the ice cap and so will take longer to melt out.”
The next comment (Brian’s) also suggests that soot may have had an impact. There undoubtedly are other confounding variables.
The fact that this ice didn’t melt during previous warm periods does not, by itself, provide evidence that it is warmer now than at any time in the past 44,000 years, which is the implication of your comment.
Ice melts at 0+C or 32+F. All it takes are temperatures above the freezing point. Technically, a combination of albedo, sunlight, precipitation and temperature enables the ice to melt or accumulate.
Maximum or higher temperatures are not revealed in this process. Only that a continuous series of sufficient temperatures above freezing has occurred, inclusive of albedo and precipitation effects.
As long as melt conditions outweigh freeze conditions the ice cap will continue to melt away. Again, high or maximum temperatures are not evidenced by ice cap melting.
It would be most cunning to read something about glacial mass balance before writing about it.
When it is warm, ice melts faster and the glacier will retreat until it reaches a new equilibrium between accumulation and ablation. The warmer the climate, the more the glacier must retreat (if accumulation remains constant). Therefore there is a clear relationship between glacier size and temperature.
Richard, you say:
“Not once in the last 44ka was it warm enough to melt the ice that has now melted.”
This is not established from the present facts. Nor is it consistent with much other information about the Holocene.
Contrary to your statement, it would have been warm enough in the Early Holocene to melt the ice that has now melted, if the Early Holocene ice configuration matched the modern ice configuration. However, the modern configuration is much depleted from the Early Holocene, largely because of the melting that took place in the Holocene. The warmth was used to melt the many meters of ice that then was superimposed on the ice that is now exposed, which remained in “inventory”, so to speak. Think of a Last In-First Out inventory: it’s an accounting concept but exactly applicable.
Melting during the early and mid-Holocene resulted in the removal of over 100 meters of ice in this area. Cooling in the later Holocene resulted appears to have stabilized the inventory at much reduced levels, followed by accumulation of glacier inventory in the Little Ice Age.
This subsequent accumulation is now being eroded – faster in some places than in others. For the sake of argument, it seems plausible that the late Holocene accumulation near B221v was less than the 135 other sites and has wasted away more quickly during the modern warm period, so that we’re now seeing ice in this area more or less as it was in the later Holocene, when over 100 meters had eroded, but there was still something left.
The erosion of an ice cap takes time and on Baffin Island, early and mid-Holocene melting didnt finish the job. That melting has resumed doesn’t show that present temperatures are warmer than early Holocene temperatures – only that melting at this site (but not others) has now continued the erosion that was going on during the Holocene.
I’m not saying this just to be argumentative: this seems obvious to me.
The ice cap has a maximum possible thickness of 70m, limited by the geometry of the mountain top. Ice flow over the edge of the mountain top stops the ice getting any thicker. This is explained in the paper.
70m of ice can be melted to the current size in ~100 years at the current melt rate of 0.5m/year. So if there was a century in the early Holocene with climate warmer than modern, moss now being exposed would have been destroyed.
This thin ice cap is very different from the Greenland Ice Sheet where the enormous thickness gives it a very slow response time and the type of process you are suggesting can operate.
This doesn’t follow. As noted before, there is plenty of evidence of a very warm Early Holocene, which melted lots and lots of Pleistocene ice. The melting of Pleistocene ice took thousands of years. Even after several thousand years of melting, here is a map (Dyke 2004) of Baffin Island glaciation at 5500 BP: much more extensive than at present.
As an analogy, tet’s suppose that you have a situation where daytime temperature is hot, but nighttime is below freezing. let’s suppose that you leave a large block of ice outside and much of melts during the day but there;s still some left when night arrives and it stops melting. Let;s suppose that it starts melting the next morning as it warms up. That doesn’t prove that the morning temperature were hotter than the previous noon and afternoon temperatures.
YOur reasoning on this point seems very defective to me.
The extensive remnant Laurentide ice in the Early Holocene is irrelevant as these ice caps were independent of the Laurantide ice sheet. From the paper
“Surface-elevation contours of the continental
Laurentide Ice Sheet (LIS) show that all four ice caps with pre-Holocene dated plants were above the surface of the LIS at its last glacial maximum (LGM [21 ka]; Fig. 1). These sites thus supported only local ice caps then as now.”
Your analogy on a block of ice melting is painfully flawed as you do not consider accumulation. If a constant amount of ice shavings are added to the block each night, the block will grow when day are cool, but shrink when days are warm.
Steve: On your first point, I’ll re-read the article, but I cannot believe that the authors are seriously suggesting that B223v was merely a little pimple at the LGM.
As to your second comment, yes but so what? Resumption of melting in the morning doesn’t tell you whether the temperature in the morning is higher than the previous afternoon. This seems so obvious to me that your resistance to the point suggests to me that we’re talking at cross-purposes somewhere. Another example. Let’s suppose that you start out with an inheritance and spend like a drunken sailor for a few years until you don’t have much left. You spend more wisely for a while and try to live off the interest, but after a while you start falling behind and depleting the capital to unprecedented levels. That doesn’t mean that your current spending is greater than spending in your spree days – only that your capital had already been depleted.
“The icecap can only shrink when it is not in equilibrium with climate. Once it is in ~equilibrium it will stop shrinking. Not once in the last 44ka was it warm enough to melt the ice that has now melted.”
This certainly seems logical and I imagine that, for most purposes (excluding consideration of the soot issue), higher temps generally means more melt. But do we really know that the pattern of melting is constant from melt to melt? Doesn’t it seem possible that, for example, 1000 years ago there was more melting on the west side of a particular ice cap but less on the south side, while 2000 years ago, at about the same temps, there was more on the east side but less on the north?
If I dug under the ice and found moss from 1000 years ago, would that prove that present temps are clearly colder than the MWP? How likely is it that ALL moss from the MWP has been exposed in the current melt? Wouldn’t you need to know the age of a significant sample of the moss now covered by ice before drawing any conclusions from the fact that some very old moss has been exposed in the current melt?
Re: richard telford (Oct 27 10:59),
Certainly the temperature will be warmer than the average climate at present (insofar as an average climate can be defined over a 45k period), but that’s a far cry from being unprecedented. I’m not sure why you’re dodging and weaving about the point, but if you have ice remaining from a previous ice age, then the fact that more ice has been deposited over the old ice and and around the margins of an ice cap when there’s a cold but not ice-age period should be a given. When there’s later a warmer or longer period of warmth, eventually some of this post-ice-age (PIA) ice will melt, revealing any moss or whatever which had lived before the PIA ice was deposited. It doesn’t matter whether some of this organic material is now being revealed because of warming over a long period of time or because of unprecedented warmth over a short period of time.
But I see Steve Mc is saying much the same thing so I’ll leave it at that.
“So if there was a century in the early Holocene with climate warmer than modern, moss now being exposed would have been destroyed.”
This doesn’t follow. As you repeat, it matters whether the icecap is in equilibrium. Glaciers retreat when additions – subtractions < 0. Newly exposed moss indicates the glacier was retreating at the age of the moss. But it doesn't tell you if it was snowing a lot and the temperatures were really high, or that it wasn't snowing at all and the ice was melting or that other thing ice does.
Which changes my comment not a whit even with your poor answer.
Again, slower so cunning people can absorb; There is no evidence of high, higher, highest or maximum temperatures in the ice cap’s melting or exposing moss.
Only that temperatures were above the freezing point for sufficient time.
Another parameter to consider is the dust/soot content of the ice. One would think that as the ice melted some dust/soot runs off with the meltwater, but some stays with the ice, refreezing in winter and gradually the albedo the ice cap goes down over time as the dust becomes more concentrated. Thus the icecap will adsorb more sunlight and melt faster, irrespective of the summertime temperature changes.
Steve: interesting point. Even on the most aggressive interpretation of CO2 forcing, the increase in forcing is much, much lower than the Holocene summer insolation forcing (JJA insolation in the Holocene optimum was more than 40 wm-2 higher than at present.)
Am I missing something here? Surely there’s a fundamental problem with claiming ‘the warmest in 44 kiloyears’? Either we must be looking at a fairly steady increase over 44,000 years, putting the start of the warming well before the start of the industrial revolution, or we must be looking at an absurd spike in the last century that is not reflected in any temperature records.
Either way, the claim is prima facie absurd. Is it actually satire, perhaps?
Isostatic rebound here? What is this location’s true altitude now compared to earlier dates of moss?
That was one of my questions. It also leads to the question would isostatic rebound affect the flow rate of local ocean currents? Or their direction? Or their salinity?
You need Joules to melt ice. That is, heat fluxes, not just temperature. But how does moss help measure heat fluxes?
In fact, joules can be delivered directly by sunlight leading to sublimation rather than melting. No need for anything bit protracted sunny days to gradually erase ice.
Would be nice to have orientation /compass on google image. Slope facing the north pole will be cooler?
Besides that the topography will effect climate with regards to wind.
I also doubt the claim about rapid decomposition. These environments are cold, have very high carbon to nitrogen ratios, organic peat, probably highly acidic, no animals, etc. They have all the ingredients for non decomposition. The only requirement for the moss to grow is no ice.
Steve: it’s not reasonable to contest everything. Miller and coauthors have observe these sites for a number of years. I have no trouble accepting their observation that the moss rapidly degrades once exposed.
I simply refer you to http://en.wikipedia.org/wiki/Glacier_Girl
A fantastic story of survival and 50 years 260ft of accrecetion.
What this study seems to show is that Miller has found 135 sites where the temperature was warmer than now around 1000 years ago, and 4 sites where it was warmer around 44,000 years ago.
If we are to try to extrapolate from this data to the global temperature, it seems to me that he has shown that most things were warmer 1000 years ago, and that there may have been a very small percentage of places where something unusual was going on.
Which doesn’t seem surprising….
Ice is formed much much faster than it melts or sublimates in nature.
A single snowstorm can dump so much snow in 8 hours that takes weeks of warmth to melt it.
I’d suggest that 100 years of cold might lay down enough ice that it might take 1000 years of warm temperatures to melt it away.
This is a product of water’s surface exposure (virtually infinite during creation of snow and reduced to 2 dimensional surface during melt or sublimation), self insulation, albedo and perhaps many other factors.
There is every reason to disregard glacier terminus as a proxy for temperature.
C3Headlines has a link to a list of studies of the medieval warm period and another link listing studies of the last 10,000 years. All which claim arctic temperatures had warmer periods than present day.
http://www.c3headlines.com/2013/10/extreme-cherry-picking-science-exposed-in-newest-alarmist-arctic-climate-study-moss-picking-debunked.html
This new study by Miller et al is an attempt to overturn what was thought to be known concerning earlier temperatures and promote present arctic temperatures to the highest point in the last 44,000 years based on an astounding four moss samples. For the authors of previous studies claiming higher temperatures than present earlier in the last 10,000 years I see three possible positions for them to take.
(1)Previous authors step forward and graciously accept the Miller study has thoroughly refuted a good chunk of their work.
(2)They publicly argue against the validity of Miller study.
(3)They simply ignore the Miller study and let it be used to claim unprecedented high temperatures in the present.
It will be interesting to see how the authors of those prior studies react.
Question re: “– the expansion indicating a decline in temperature ”
Can we necessarily infer that?
What if the expansion was dominated by a change in precipitation that dominated temperature variation? e.g. the Antarctic ice cap is currently at a record high over the last 30 years (satellite period) while we are allegedly at corresponding global temperature high?
Do ice cores of the “ice caps” exist to agument the study?
there are ice cores at the nearby Penny ice cap by David Fisher.
If Miller’s argument for the maximum ice thickness being limited to 70m at this location is robust then his conclusion should be accepted.
If this was simply the remnant of a much thicker cap that eroded during HTO we don’t have to accept present temperatures as higher than Holocene, but if the cap was limited to a maximum of 70m it’s rather obvious that temperatures in this location are now warmer than at any period since the moss/lichen grew.
Terry
This has an interesting corollary: the ice at the base of this very small and thin icecap must then be of early Wisconsin age (c. 100 KA) making it an uniquely easily and cheaply accessible climatological archive.
The Renland Icecap in East Greenland is a somewhat similar case, but it is about 200 meters thick.
Not necessarily. Ice sheets may be lubricated from the bottom by super cooled fluid. The pressure of the ice above may permit the water to remain fluid, or force ice into a fluid state at temperatures well below normally freezing temperature. Another consideration is that ice in shallow depressions may not move while the mass above grinds past. So, it is conceivable that really old moss might survive if the right surface topography conditions are met.
I think that this is the $64 question. Miller argues this very tersely. As Richard Telford observed, this argument relies on the following claim:
In their Figure 1, they draw a dotted line purporting to show the LIS (Laurentide Ice Sheet) 1 km contour line, citing Dyke et al 2002 as source. The underlying figure from Dyke et al 2002 appears to be the following continent scale figure:
Dyke’s knowledge of deglaciation appears to be unparalleled. In addition, Dyke was knowledgeable about Baffin Island (as is Gifford Miller who has worked there on and off for 40 years).
Nonetheless, at the scale of Baffin Island’s CUmberland Peninsula, the Dyke 2002 figure is little more than a cartoon. It wouldn’t take much to slightly expand the lobe in eastern Baffin Island so that the 1 km contour included the B223v site. I do not think that one can safely assume that Dyke intended this map to be used at this level of detail. The source for the LIS contour in Baffin Island should be an authoritative regional or local map, not a continental scale map.
Also note that, in eastern Baffin Island, between the 1000 and 2000 m contours, the Dyke map shows a topographic high of 2000 m as being overrun by LIS ice.
Further, recent work by Briner and associates (which I have merely browsed) seems to indicate that there has been some revision in the interpretation of the Laurentide ice Sheet in eastern Baffin Island since 2002, with the ice sheet now believed to be grounded further seaward on the continental shelf than previously. This would move the 1 km LIS line as well.
Could one picture an LIS ice sheet topography in which a lobe of the 1 km contour was seaward of B223v? I think so. This doesn’t mean that this is the correct interpretation.
However, the idea that B223v had a little local ice cap similar to the present during the LGM makes no sense to me whatever. It’s hard for me to believe that this is what Miller is actually arguing, but I’m having trouble figuring out other interpretations of the small ice cap argument on which his argument depends.
n drawing this figure, did Dyje turn his mind to relatively small-scale features
“Dr Telford
Your analogy on a block of ice melting is painfully flawed as you do not consider accumulation.”
So it is possible that it is not a change in temperature that has allowed these very old mosses to be uncovered, but a change in the rate that snow has been falling in the particular local, which has changed the steady state ice coverage.
One painfully lacking aspect here is related to dynamical warming induced by an accelerated circulation in the lower troposphere and its well known effects on Baffin region and Greenland coastal glaciers. The same can be observed around some Andean glaciers and of course the Antarctic peninsula: renewed advection of warmer air displaced by colder HP polar air masses descending to lower latitudes can melt certain regions yet it does not mean global warming, quite the opposite in fact.
Andrews et al 1972 has an air photo on which the locations of B221v and B223v are shown. First, here is a google earth image looking east towards Broughton Island with sites marked – oriented to correspond to the 1972 air photo. The red pin shows the location of the ancient moss.
Next here is the air photo from Andrews et al 1972.

After discussing recent deterioration in summer temperatures, Andrews et al 1972 observed:
Co-authors of Andrews et al 1972 included Gifford Miller and Raymond Bradley.
Out of my depth here, but I want to check if I’m keeping up a little: Telford is assuming that the extent of the cap in equilibrium grows or shrinks with temperature, and basically everything else doesn’t change that. In effect, extent of the cap is a good proxy for temperature. Others are suggesting that the extent of the cap may depend on other variables, ones that may have changed with time, and not knowing those we have no proxy for temperature. McIntyre is suggesting that extent of the cap may have nothing much to do with temperature, but may be a non-equilibrium thing that depends on how long the cap was exposed to above-zero temps and how much was there before.
Richard: Since the beginning of the Holocene, summer irradiation in the Arctic has fallen about 40 W/m2, presumably resulting in a gradual fall in summer temperature and an increase in snow/ice cover. Richard Telford suggests that equilibrium between local ice cover and local temperature occurs within several decades because melt rates of 0.5 m per year have been observed. If so, that makes each site moss has been exposed by retreating ice into a “thermometer” that reports current temperature of recent decades on an unusual scale – years before present (ybp and further back means warmer). The vast majority of these “thermometers” say that current temperature matches the temperature from one or two millennia ago and some match a few millennia before that. Now Miller has now found a few of these thermometers that say current temperatures are even warmer on this scale. Why should we believe and highly publicize these few OUTLIERS, when the vast majority of the thermometers say the current temperature is similar to that of the past few millennia?
In Australia we do not have any glaciers so our specialist knowledge of them suffers. Here are some comments based more on logic and consistency than on glacier knowledge. I do not even know if some of the sources are reliable & hope to be corrected. The full Miller et al paper, being unavailable to me, was not read.
………………………….
On this CA thread, Richard Telford wrote –
“The ice cap has a maximum possible thickness of 70m, limited by the geometry of the mountain top. Ice flow over the edge of the mountain top stops the ice getting any thicker.”
“The moss is rooted. The plants are in situ. They have not moved from where they grew, and are so fragile that they would rapidly turn to dust if moved.”
“These sites thus supported only local ice caps then as now.”
……………………….
Deductions:
After the initial growth of the ‘older’ moss, the ice cap was never more than 70 m thick.
Isostasy is not a significant local consideration in the last 50,000 years because the ice was too thin & the time too short.
We are dealing with ice caps, not glaciers (or are we?).
…………………
Richard Telford –
“It was a tidewater glacier, prone to rapid retreats once a threshold is passed.”
“70m of ice can be melted to the current size in ~100 years at the current melt rate of 0.5m/year.”
………………………
Observations:
The present Google Map image shows snow/ice down to about 700m within 50 km of the site and none lower down. We are invited to believe that the extent of ice cap cover was something similar when the old moss grew. The moss is now at altitudes of some 1,000m a.s.l.
…and from this blog http://www.livescience.com/15294-source-sea-level-rise-discovered.html
“Over a span of 12 toasty millennia known as the Last Interglacial Period (128,000 to 116,000 years ago), summertime temperatures in the Northern Hemisphere were as much as 9 degrees Fahrenheit (5 degrees Celsius) hotter, and worldwide, sea levels were roughly 21 feet (6.5 meters) higher than they are now.”
Some problems:
It is rather unlikely that glaciers in the study area were tidewater glaciers because the sea would still be a few hundred m below the glaciers then, as now. Load release from a melted 70m ice cap will not give a vertical land shift of several hundred m.
As Steve McIntyre has noted, one problem is the different behaviour of moss at 2 sites close to each other and about the same altitude. In the reconstruction, we have to envisage these 2 locations as being essentially identical in climate response, EXCEPT that at one site ice melted something less than 2000 years ago and did not melt at the other. Furthermore, it is claimed that we are seeing a similar ice pattern today, just uncovering old moss at one site and new moss at the other, both within meters of the ice edges. Further, we are asked to believe that the expedition, rather serendipitously it seems, just happened on this place at just the right time, more than 40,000 years from the last similar pattern, and just in time to grab the samples before more warmth destroyed them – perhaps in a time slot a few days-weeks wide.
This is a very unlikely scenario. There would seem to be a higher probability that the carbon isotope story is misleading, perhaps because of CONTAMINATED SAMPLES. After all, we do not know the precise provenance of isotopes & their ratios in the air that nourished these mosses at various times.
Conclusions.
Richard Telford has provided some valuable input plus some inconsistencies as noted.
A more likely explanation of the results of the Miller paper is contamination or laboratory error in carbon isotope estimations and their interpretation.
Miller at al identified a small number of outliers that instead of being the subject of error analysis, became the main topic of the findings.
Another few field seasons, to reproduce the results or not, would have been normal, prudent conduct before rushing to print with more questions than answers.
Steve: it is indeed hard to understand the inconsistency between nearby sites. Surely the authors ought to have commented. Also they’ve been visiting these sites for a number of years. It would be interesting to see what happens in revisits.
I think that ‘it was a tidewater glacier” was a reply to a comment about a different glacier
Moss from Miller, age (years BP) vs height (masl)
Click to access Miller%20pdf.pdf
http://onlinelibrary.wiley.com/doi/10.1002/2013GL057188/suppinfo
Mike:
Click to access Miller%20pdf.pdf
The inclusion of a Time mag scare cover, Gore’s Polar Bear on dwindling ice, and a graph of 2012 Arctic ice extent in Miller’s Power Point PR piece suggest that the researchers found just what they’d been looking for.
Here is one more paper regarding the region (Western Greenland), which more soberly addresses these issues:
1)Early Holocene temperatures only 2-3c warmer than present 2) Climate variability exceeds insolation forcing
Click to access AxfordY_HoloceneTemperatureHistory_2013.pdf
From the abstract:
Gradual, insolation-driven millennial-scale temperature trends in the study area were punctuated by several abrupt climate changes, including a major transient event recorded in all five lakes between 4.3 and 3.2 ka, which overlaps in timing with abrupt climate changes previously documented around the North
Atlantic region and farther afield at w4.2 ka.
Discussion:
The onset of this transient event in West Greenland overlaps with the timing of abrupt climate shifts documented at many sites far from West Greenland w4.2 ka, including evidence for drought in central North America (Booth et al., 2005), glacier advance in western North America (Menounos et al., 2008), increased wetness
and cooler conditions in northern Britain (Langdon et al., 2004; Langdon and Barber, 2005), and hydrologic changes implicated in cultural upheavals in the Middle East and south Asia (deMenocal, 2001; Staubwasser et al., 2003). More locally, Moros et al. (2006) record substantial environmental changes in Disko Bugt sediments at w4 ka based on diatoms and sediment physical proxies.
Masson-Delmotte et al. (2005) highlight an abrupt drop in GRIP deuterium excess at 4.5 ka, and suggest that this change in isotopes of precipitation over central Greenland may have recorded a shift in regional hydroclimate.
The conclusion:
The occurrence of abrupt climate shifts in West Greenland during the Holocene reinforces the notion that Holocene climate, which at high northern latitudes was primarily driven by gradual changes in summer insolation, exhibited non-linear sensitivities that may hold clues to the potential for abrupt future changes in climate.
What does a moss sample of age “X” tell you? It tells you the glacier was retreating at age “X”. A retreating glacier means the additions are outweighed by the subtractions, which suggests the additions will be wiped out by the subtractions. By wiping out the additions, information is lost, naturally. You can’t get the isotopes in the non-existent ice indicating the temperature at the time, for instance. No d018 to dO16 ratios, since they all melted away. Not to mention the previous records.
In fact, this effect has the property of masking information for warm years in ice cores.
I’m supposing the people that do these things for a living have considered these issues, but it makes me wonder how far someone needs to go to obtain usable information, and how inaccurate that make the information.