One of the longest standing Climate Audit issues with paleoclimate reconstructions is ex post decisions on inclusion/exclusion of data, of which ex post decisions on inclusion/exclusion of sites/data in “regional [treering] chronologies” is one important family. This was the issue in the original Yamal controversy, in response to which Briffa stated that they “would never select or manipulate data in order to arrive at some preconceived or unrepresentative result”. However, Briffa and associates have never set out ex ante criteria for site inclusion/exclusion, resulting in the methodology for Briffa regional reconstructions seeming more like Calvinball than science, as discussed in many CA posts.
Unlike Briffa, D’Arrigo has candidly admitted to the selection of data to arrive at a preconceived result. At the 2006 NAS panel workshop, Rosanne D’Arrigo famously told the surprised panelists that you had to pick cherries if you want to make cherry pie. Again in 2009 (though not noticed at the time), D’Arrigo et al 2009 stated that they could “partially circumvent” the divergence problem by only using data that went up:
The divergence problem can be partially circumvented by utilizing tree-ring data for dendroclimatic reconstructions from sites where divergence is either absent or minimal. (Wilson et al., 2007; Buntgen et al., in press; Youngblut and Luckman, in press).
Portfolio managers would have like to have a similar option in constructing portfolios: if, after the fact, you pick stocks that went up, it would be trivially easy to “circumvent” market downturns. That paleoclimatologists seem so obtuse to this simple observation is a major puzzlement.
In today’s post, I’ll show an absolutely breathtaking example of biased ex post picking by D’Arrigo et al in the D’Arrigo et al 2006 CNWT chronology. It was impossible for anyone to identify the full measure of this bias at the time or for many years afterwards, as D’Arrigo and coauthors failed to archive data at the time and refused to provide it when requested. They were supported in their refusal by IPCC WG1 Co-Chair Susan Solomon, who, as CA readers are aware, threatened me with expulsion as an IPCC AR4 reviewer for seeking supporting data for D’Arrigo et al 2006 (then cited in preprint by AR4). The data showing the cherry picking only became available in 2014 as part of a belated archiving program in the final year of Gordon Jacoby’s life.
I re-examined the Northwest Territories data about a year ago after discussing other Arctic series in eastern Canada and Greenland (Baffin Island, Gennaretti et al in Quebec) and turned to the next long data to the west. I’ve written up these notes because tree rings are back in the news with the publication of a new compilation of 54 series by Rob Wilson and coauthors that includes many Jacoby-D’Arrigo sites and a new article co-authored by Briffa (Schofield et al, 2016) which, while drawing attention to uncertainties in reconstructing temperature from chronologies, does no analysis of uncertainty/bias that can arise from ex post selection of data..
Coppermine River and Thelon River, Northwest Territories
Jacoby first sampled the Coppermine River site in 1977, later sampling Hornby Cabin (later re-named Thelon River), Mackenzie Mountains and Franklin Mountains in 1984. Three of these (Coppermine, Hornby Cabin and Mackenzie Mountains) were subsequently used in the Jacoby and D’Arrigo 1989 temperature reconstruction that was prominent in early NH reconstructions and as individual proxies in Mann et al 1998. Measurement data for the four sites was archived at ITRDB. Jacoby and D’Arrigo 1989 reported that they had considered data from 36 northern sites and selected the 10 sites “judged to provide the best record of temperature-influenced tree growth” (plus the very HS-shaped Gaspe site from south of the St Lawrence river). Jacoby refused to provide data from the sites that had been considered but not used (see CA post on his refusal here). The sample sizes at each site were relatively small: ~30-35 cores.
In 1999, D’Arrigo wrote a pleasant short recollection of the 1984 expedition to Thelon River. She closed the recollection wondering how the trees had responded to the warmer temperatures of the 1990s and 2000s and noting the value of updating the older chronologies – precisely the sort of update that seemed essential to me when I first encountered this field:

In 2004-5, D’Arrigo and others carried the contemplated update to the Thelon River (Hornby Cabin) and Coppermine River measurement data on a much expanded scale, this time obtaining over 350 cores from each location, as compared to ~30 cores in the earlier collection. Measurement data was not archived until 2014, but shows startling differences between the Thelon and Coppermine River sites: the Thelon chronology, in both RCS and STD versions, had a pronounced 20th century decline (divergence problem), whereas the Coppermine chronologies (especially the RCS version) had elevated late 20th century values. (The same phenomenon can also be observed in the chronologies from the 1980s.) The RCS series (red) have somewhat more low-frequency variability (but in RCS, such variability can arise from site inhomogeneity as well as temporal change.)

Figure 1. RCS (red) and STD (black) chronologies calculated (SM) from measurement (rwl) data archived in 2014 for Coppermine River (left) and Thelon River (right). STD chronologies were calculated from archived measurement data using the R-package dplR and the RCS chronologies were calculated using my emulation function, using a single standardization curve for each dataset.
D’Arrigo et al 2006: the CNWT Regional Chronology
D’Arrigo et al 2006 produced a NH temperature reconstruction from 19 regional chronologies. Their reconstruction was prominent in the NAS panel spaghetti graph in 2006 and in the 2007 IPCC AR4 and again in IPCC AR5.
The majority of the North American regional chronologies in D’Arrigo et al 2006 came from Jacoby and D’Arrigo’s own work, including the Central Northwest Territories (CNWT) regional chronology. In the figure below, I’ve excerpted the North American sector of the D06 location map (left panel), which shows the CNWT region as a large rectangle with four red location dots. Though not listed at the time, the two eastern CNWT locations are Coppermine River and Thelon River (both of which had large updates in 2004-5), while the two western sites were Franklin Mountains and Mackenzie Mountains, both of which only had limited “vintage” data available. On the right, I’ve shown a figure excerpt, showing the CNWT chronology as used in D’Arrigo et al (shown by them in SD units).
|
|
|


Figure 2. Left panel – excerpt from location map of D’Arrigo et al 2006; right panel – excerpt from D’Arrigo et al 2006 Figure ^, showing individual chronologies (in SD units).
Though the Coppermine and Thelon River measurement datasets were approximately equal in size, the 20th century portion of the D’Arrigo et al 2006 CNWT regional chronology does not appear to be impacted by the pronounced decline observed in Thelon River measurements.
This could not be asked as a question at the time, because, as noted above, D’Arrigo et al 2006 did not archive measurement data until many years later.
D’Arrigo et al 2009
D’Arrigo et al 2009 (Glob Plan Chg) was the first academic publication of the Coppermine River and Thelon River sites, though the sites had been used in chronologies and reconstructions for over 20 years. In this article, they made the statement about how to “partially circumvent” the divergence problem that I quoted above:
The divergence problem can be partially circumvented by utilizing tree-ring data for dendroclimatic reconstructions from sites where divergence is either absent or minimal. (Wilson et al., 2007; Buntgen et al., in press; Youngblut and Luckman, in press).
Although this was the only supporting academic publication for the CNWT series used in D’Arrigo et al 2006, they did not directly discuss this earlier chronology, other than in regard to the choice of RCS or STD standardization methods, about which they stated:
Previous analyses of Coppermine and Thelon ring-width data, in combination with ring width data from 2 other sites in the western NWT (R. Wilson unpublished report, 2005; D’Arrigo et al., 2006) revealed that the Regional Curve Standardization (RCS) method, a potentially useful technique for retaining centennial-scale climatic trends in tree rings (Briffa et al., 1992; Cook et al., 1995; Esper et al., 2002), did not appear to preserve any additional low-frequency information at these sites when compared to more traditional techniques. We thus did not utilize RCS for developing ring width chronologies for the present study, opting for more traditional methods (i. e. individual series detrending). We will, however, continue to explore efforts to capture more low-frequency variability in future studies using RCS and other methods.
While the decision between RCS and STD methodology is not central to this post, I note that the election between RCS and STD chronology in dendro articles is too often another ex post “researcher degree of freedom” in Wagenmakers’ usage. Curiously, in this case, the purported justification appears incorrect based on the appearance of the RCS and STD chronologies in Figure 1, in which the RCS chronologies appear to have more low-frequency variability than the STD chronologies (though this could arise from site inhomogeneity as well.)
D’Arrigo et al 2009 STD ring width chronologies for Coppermine River and Thelon River (see below). They have not archived these chronologies and did not archive the underlying measurement data until 2014. My own STD emulations using the data archived in 2014 correspond to these figures reasonably well.
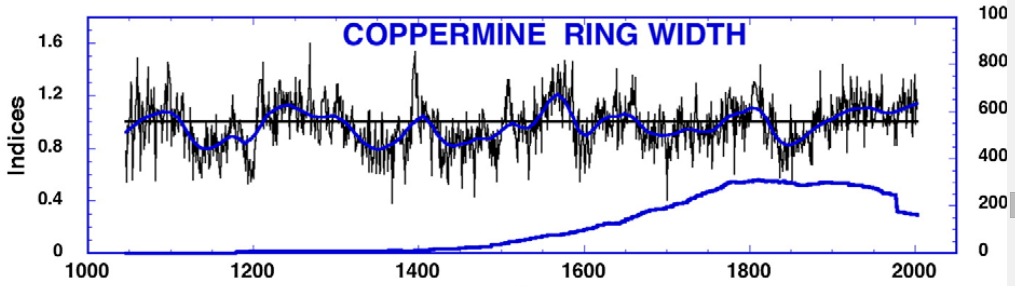
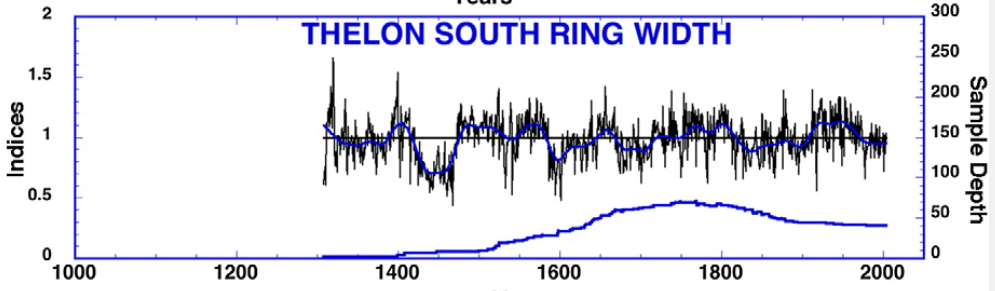 Figure 3. Coppermine and Thelon ring width chronologies from D’Arrigo et al 2009 (Glob Plan Chg)
The Coppermine River chronology has a very similar 20th century uptick to the D06 CNWT regional chronology, while the Thelon River chronology has the familiar divergence problem.
Tracing the CNWT Cores
I was very puzzled by the much greater similarity of the CNWT “regional” chronology to the Coppermine River data than to the similarly sized Thelon River data.
One day in late 2014, many years after my initial request, I noticed that a considerable tranche of long overdue Jacoby/D’Arrigo measurement data had finally been archived, the long overdue housekeeping of Jacoby/D’Arrigo data being separately financed by the U.S. National Science Foundation. The data was archived in the last year of Jacoby’s life. (The archive regrettably continues to be incomplete: for example, MXD data from Labrador, later used in Wilson et al 2016, was withheld from the 2014 archive (and has not been archived in connection with the later publication.)
The measurement data as archived included a separate dataset for the 2006 D’Arrigo CNWT chronology (cana322.rwl) and for the 2003-2004 updates to Coppermine River (cana314.rwl) and Thelon River (cana318.rwl).
I carried out the somewhat laborious exercise of tracing the identification numbers of individual cores in the CNWT dataset (cana322.rwl) to component datasets, eventually locating all the cores. Some came from the Coppermine and Thelon River updates (cana314.rwl and cana318.rwl); some came from the vintage Jacoby datasets (Franklin Mountains, Mackenzie Mountains and Hornby Cabin.) Somewhat complicating the reconciliation, the vintage Coppermine River dataset (cana153.rwl) does not appear to have been incorporated into the updated dataset, but previously unarchived vintage data sampled in 1977 (with Jacoby site prefixes 813 and 825) were included in the update.
In Table 1 below, I’ve summarized the results of the reconciliation, showing the provenance of CNWT data from the Coppermine, Thelon and Western (Franklin Mts, Mackenzie Mts) locations, also showing available data not used. Rows distinguish vintage data from the recent updates. There was one astonishing result from the reconciliation (highlighted in yellow):
of the 359 (354+5) new Coppermine River cores, 98.6% were used in the CNWT composite and 1.4% not used, while of the 363 (12+351) new Thelon River cores, only 3.3% were used in the CNWT composite, while 96.7% were not used.
The reason why the CNWT looks so much like the (somewhat) upticking Coppermine series and so little like the (declining) Thelon is now easy to diagnose: D’Arrigo et al didn’t include the (declining) Thelon data in their composite

Notes: (1) Hornby Cabin (cana155) and Mackenzie Mts (cana156) used in Jacoby and D’Arrigo 1989 and Mann et al 1998; (2) Franklin Mts (cana154) not used in Jacoby and D’Arrigo 1989 or Mann et al 1998; (3) Cores with prefixes 813 and 825, sampled in 1977, not previously archived (to my knowledge); (4) Original Coppermine River archive (cana153), sampled in 1977, used in Jacoby and D’Arrigo 1989 and Mann et al 1998, but not included in CNWT composite.
D’Arrigo et al 2009 had stated that “the divergence problem can be partially circumvented by utilizing tree-ring data for dendroclimatic reconstructions from sites where divergence is either absent or minimal”. One could scarcely have expected that this would result in a situation where 98.6% of the cores of one site on the D’Arrigo et al 2006 location map were used, while 96.7% of the cores from another site shown on the location map were not used.
Impact on CNWT Chronology
The figure below shows the difference between the D’Arrigo et al 2006 STD chronology and an STD chronology calculated using all cores from datasets identified in the Table 1 reconciliation. The uptick in the D06 version no longer exists. (Bizarrely, the CNWT “RCS” chronology later archived by D’Arrigo et al was actually the STD chronology.)

Figure 4. Comparison of D’Arrigo et al 2006 chronology (red) to STD chronology (blue smooth of black) calculated using all cores in Table 1 datasets.
Conclusion
Seemingly arbitrary decisions by dendro specialists on inclusion/exclusion of tree ring data has long been a source of criticism at Climate Audit. In response to the original Yamal controversy about ex post decisions on inclusion of sites and withholding of adverse results, Briffa denied (later quoted by Guardian here) that they would select or manipulate data based on a “preconceived” result (a claim called in question by Climategate emails):
we would never select or manipulate data in order to arrive at some preconceived or unrepresentative result
Unfortunately, Briffa and associates have never set out ex ante criteria for site inclusion/exclusion, resulting in Briffa regional reconstructions seeming more like Calvinball than science, as discussed in many CA posts. However, remarkably, D’Arrigo et al 2009 (though not noticed at the time) had admitted earlier that year to doing exactly what Briffa had denied: the ex post selection of sites in order to obtain a preconceived result (a reconstruction that went up in the 20th century). They stated:
The divergence problem can be partially circumvented by utilizing tree-ring data for dendroclimatic reconstructions from sites where divergence is either absent or minimal. (Wilson et al., 2007; Buntgen et al., in press; Youngblut and Luckman, in press).
The full import of this sentence could obviously not be appreciated without knowing the full measure of the ex post cherry picking that had been carried out in the D’Arrigo et al 2006 CNWT reconstruction: who could possibly have guessed that D’Arrigo and coauthors used 98.6% of the new cores from the Coppermine River update (which went up) and only 3.3% of the new cores from the Thelon River update (which went down.) A more thorough implementation of a protocol for selection of data to achieve a preconceived result is hard to imagine.
In a separate post, I’ll examine NWT chronologies in subsequent multiproxy studies which did not use the D’Arrigo et al 2006 CNWT chronology but which nonetheless chose “advantageous” variations (PAGES2K, Wilson et al 2016).
Postscript on Jacoby and D’Arrigo 1989
As noted above, the Coppermine update included some vintage measurement data (prefixes 825 and 813) taken in 1977, but to my knowledge, not previously archived – though there is a vintage Coppermine River archive (cana153.rwl) with data also taken in 1977. No information is presently available on why the measurement data with prefixes 825 and 813 was not included in the original Coppermine River archive.
As an exercise, I calculated an STD chronology for the data with prefixes 813 and 825 (red below) and compared it to the archived cana153.crn chronology (black below), that had been used in the Jacoby and d’Arrigo NH reconstruction and later in Mann et al 1998. It is evident that there is a divergence problem in the previously unarchived data. One can not help wondering whether this was an earlier generation example of “circumventing” the divergence problem by “utilizing tree-ring data for dendroclimatic reconstructions from sites where divergence is either absent or minimal.”
 Figure 5. Black – vintage Coppermine River chronology in ITRDB archive (1428-1977); red- STD chronology calculated from (previously unarchived) vintage data embedded in updated Coppermine River measurement data (314.rwl).
References:
D’Arrigo et al 2006. On the long‐term context for late twentieth century warming. JGR. pdf
D’Arrigo et al, 2009. Tree growth and inferred temperature variability at the North American Arctic treeline. Glob Plan Chg. pdf
Jacoby and d’Arrigo, 1989. Reconstructed Northern Hemisphere annual temperature since 1671 based on high-latitude tree-ring data from North America. Climatic Change.


91 Comments
Dear Steve:
It is evident that in the field of climate change, the in-group reviewers typically merely rubber stamp one another¹s manuscripts for publications. In all fairness though, it is often a great effort for a reviewer to pour through large data sets and ferret out the detailed manipulation of data involved in the paper, and few reviewers have the time and motivation to do that. As a result, the peer review system, at best a least of evils in most of science, has degenerated into a farce in climate science.
You have set yourself up as an independent reviewer of climate articles with particular interest in the reliability of data, manipulation of the data, and processing of the data, and you have thereby provided those in climate science willing to listen, with valuable feedback and commentary. I for one, and many more, recognize the important work you do, and hope you will continue.
Donald Rapp
Steve: as I mentioned in the text, I was quite prepared to look closely at the data as an AR4 reviewer, but IPCC refused to provide me the data and threatened to expel me as a reviewer for requesting data. The data wasn’t archived until NINE years after my original request and, without the data, no reviewer could assess any of this even if they wanted.
Donald, I took the liberty of quoting you in the following tweet, followed by some explanatory comments to a software friend with whom I was debating peer review in the light of Climategate two days ago. He is deeply distrustful of climate ‘sceptics’ but has not I think grappled with the kind of bad practice Steve uncovers here.
Steve, well researched, well explained, well written.
I was totally amazed by this comment:
Upon further reflection, I realized that this simply shows that like mainstream climate scientists, the trees themselves participate in the famed “98% consensus” that I’ve read so much about …
Can’t thank you enough for your continuing explorations,
w.
Willis,
Your comment has my vote for “Best of Thread”!
Ditto on the congrats to McIntyre for this thorough research.
Second to both of Fabius’s comments. Really quite remarkable that they do this kind of stuff, and it gets accepted with a straight face.
Hey, it’s *SCIENCE*. 97% agree!
Do the used Thelon cores resemble the discarded ones? I mean, do the used cores have the divergence problem that the overall reconstruction has, or do they buck the trend?
If they are representative of the rest of the Thelon 20th pattern, it seems strange to discard them… equally if they are anomalous among Thelon cores, the suspicion would be they were selected for that reason.
Good question. Here’s a comparison of STD chronologies for the 12 Thelon update cores (black) used in CNWT vs one of the 351 Thelon update cores not used.(red) The 12 included Thelon cores do not carry forward to the present, but end in 1925 on an uptick. It would be interesting to know why they were included.
It’s clear why they were selected. They contain the “signal” and the rest of course are just “noise.”
It would be great to encapsulate this new perspective in a telecommunications filter chip. A patentable advance I am sure!
(I wonder if such an illustration might help scientists such as these begin to comprehend what it takes to create a truly effective analytical paradigm? In theory at least, the selection and analytical methods could be encapsulated in a chip and duplicated.)
Here is the filter you are looking for.
Thanks, CTM 🙂
YOu’re familiar with DSP chips, welcome to the EASP chip
“Ex-Ante Signal Processing”
Deathbed archiving? Good God, does it really take that to share data?
cant take it with you.
Apparently he managed to take some of it with him. From Steve McIntyre in the post:
” (The archive regrettably continues to be incomplete: for example, MXD data from Labrador, later used in Wilson et al 2016, was withheld from the 2014 archive (and has not been archived in connection with the later publication.)”
Highest temperatures in the whole period at the end of the 16th century? Tell it to the marines! What the graphs really show is hundreds of years of red noise.
You also wonder why these people even bother to cherry pick when they clearly know that temperature and tree-ring widths aren’t linearly correlated anyway.
As D’Arrigo put it in 1999:
“It would be interesting and useful to see how the trees have been faring over this recent period. Are the warmer temperatures spurring more growth? Or is the warming increasing evapotranspiration in the area, creating drier conditions that stress the trees and stunt their growth?”
Geddit? She knows there is warming. If the tree-rings have got wider, that means warming; if they have got narrower, that also means warming. So why bother doctoring the selection of the tree-rings in the first place?
And people make careers out of this sort of mental mush? Careers in science?
Yes, that is the point. Quite successful careers. Tells us a lot, doesn’t it?
indeed it does. the tenacity of mr mcintyre is utterly astounding . very, very impressive.
D’Arrigo expresses the intention to gather data and investigate the posit that given warming, there are two alternative hypotheses 1) growth is augmented, or 2) growth is stunted. She wants to determine which of the alternatives obtain.
She collected copious data from two populations but these showed opposite signs. Here she is faced with inconclusive data. She might drop the investigation as unfruitful, or she might consider another hypothesis i.e., warming could have diverse effects on growth, or none, or other factors came into play.
What she must not do, according to the tenets of rigorous science, is discard one dataset and base her conclusions on the other. But this is what she did.
What you are asking for there is the job of a tree physiologists, not a climatologist. Climate “science” poses the question the other way round – given a wide (or narrow) tree rings was the weather warmer (or cooler) in that year. This distinction (at the root of the Bayes formula) is like the so-called prosecutor fallacy conflating the two probabilities – (a) given the guilt of the prisoner what is the probability that he was near the scene of the crime (quite high) compared with (b) given the prisoner was near the scene of the crime what is the chance he was guilty (much lower).
In fact the issue is treated not in a bottom up fashion but empirically much as if one were calibrating an instrument whose sensor (tree rings) is imperfectly controlled by the variable of interest (temperature) but might exhibit a sufficiently powerful correlation to be useful as a thermometer. Indeed that is why they are called “proxies”. No harm in an empirical approach but of course it no way lets the climatologist off the hook of establishing the calibration honestly. Data dredging in all its guises plays havoc with the degrees of freedom when testing for significance, seldom accounted for with any rigour. It comes in when adjusting for tree age, for serial correlation, for selecting trees, selecting time slices, pooling data, and extracting modes of variation through principal components analysis.
I did not mean to be “asking”. Please see the quote of d’Arrigo above at D. Brewer (taken from the post). She poses the problem re-stated by me. You seem to be saying that she lacks the competence to address it (no tree physiologist). I do not disagree with such an assessment and I agree with your assessment of the fallacy of their approach.
I find it strange that their field, the study of tree rings and the factors of tree growth, should exclude competence in botany and particularly tree physiology. Surely they are conversant in this, but perhaps not. The above d’Arrigo statement is pregnant with implications reflecting on the faults of their methods.
David Brewer
Posted Jan 29, 2016 at 4:57 PM | Permalink | Reply
Highest temperatures in the whole period at the end of the 16th century? Tell it to the marines! What the graphs really show is hundreds of years of red noise.
You also wonder why these people even bother to cherry pick when they clearly know that temperature and tree-ring widths aren’t linearly correlated anyway.
As D’Arrigo put it in 1999:
“It would be interesting and useful to see how the trees have been faring over this recent period. Are the warmer temperatures spurring more growth? Or is the warming increasing evapotranspiration in the area, creating drier conditions that stress the trees and stunt their growth?”
Geddit? She knows there is warming. If the tree-rings have got wider, that means warming; if they have got narrower, that also means warming. So why bother doctoring the selection of the tree-rings in the first place?
And people make careers out of this sort of mental mush? Careers in science?
—————————————————————————-
The thing to ask is how do they know that the tree ring growth from the past wasn’t stunted as a result of warmer temps causing evapotranspiration. Of course that’s when they will have you escorted out of the room… and shot, if they could.
Inclusion of the QUE [Quebec] in D’Arrigo 2006 raises “ringer” suspicions to me. In the paper, the relevant graph indicates recent curves quite like the usual temperature reconstructions plastered onto spaghetti graphs. More than the paper’s other NA series. Further, the paper’s map situates the QUE trees nowhere near a tree line–rather near the St. Laurence River in the south of the province.
The paper itself stresses the ring measurements are from “high elevation and latitudinal treeline” trees. So, we are not dealing with Australian Climate Science, Ltd here wherein almost any tree can be a treemometer. But what of the QUE series? I could not find location coordinates in the paper’s supporting information. If the QUE series is not treeline, its inclusion would be quite suspect in the purview of a paper that specifies the use of treeline specimens. Was the QUE series produced pursuant to a relevant different paper that opined on their significance?
The Quebec site in D’Arrigo et al is the Gaspe site, which has been written about at length in connection with Mann et al 1998, together with an update that was withheld for many years. The precise location of the Gaspe trees is not known, but there is some high country in Gaspe. The trees themselves are cedars – which form stripbark under stress – and my guess is that there is some stripbark in the Gaspe sample.
Although the *precise* location of the trees may not be available, the general lat-long location for three Gaspe tree ring records is provided at the paleoclimatology link for ncdc/noaa. Selecting tree ring data on the global mapping system and zooming into the Gaspe penninsula shows three closely spaced locations in the Riviere-Bonaventure, QC region.
http://gis.ncdc.noaa.gov/map/viewer/#app=cdo&cfg=paleo&theme=paleo&layers=0000000000000001
The lat-long locations are given as:
St. Anne River (Cook) : 48.58, -65.92
Ed’s Gaspe (Cook) : 48.533, -65.916
New Gaspe (Jacoby) : 48.5, -65.9
It is possible to use Google Maps to locate (approximately) lat-long positions. Clicking around for the most precise of the three positions (Ed’s Gaspe) pointed to an area about 200 meters northwest of the end of what appeared to be a “J” shaped logging or tree farm access road about 35-40 km north (as the crow flies) of the point where Quebec 299 intersects with 132 near New Richmond.
https://goo.gl/maps/M8suo4RqT332
Thank you much opluso for the map. Definitely not treeline specimens. No treelines to be seen, and nowhere near the latitudinal treeline edge of far north Quebec.
Steve: I remember reading about Gaspe. I recall the stripbark matter, and perhaps I conflated Gaspe with the White Mountain bristlecones, who also have stripbark issues but also are a “treeline” species by nature. I suppose I read “Quebec” in the past and assumed north Quebec at its tree line. My point: putting aside the stripbark and other interpretive issues of Gaspe, the inclusion or consideration of any Gaspe rings in D’Arrigo 2006 should be viewed as a failure of the paper on a geographic basis. The paper clearly states only treeline specimens were used:
Tree-ring width (and limited density [Luckman and Wilson, 2005]) data derived from living and subfossil wood of coniferous tree species were compiled from 66 high-elevation and latitudinal treeline North American and Eurasian sites.
I do not remember if the geographic disqualification of the Gaspe data for the purposes of D’Arrigo had been addressed. Looking at the present map you provide above, “QUE” stuck out like a sore thumb for me.
Steve: the precise location of the Gaspe series is a mystery. I asked D’Arrigo and JAcoby for a precise location to permit re-surveying. They refused to provide it. I recall that there is some high ground in the Gaspe – the northern extension of the Appalachians and it is possible that these trees came from an altitudinal treeline. See https://alavigne.net/Outdoors/ImageGallery/2006/08-05-08-NewBrunswick/ for hike to altitudinal treeline in that latitude at 4000 feet. But it’s not at all clear. There is also some evidence that they didn’t.
Google maps offers a “terrain” option under the menu selections. Using this gives you a topo map and from the link I provided it looks like the “Ed’s Gaspe” location is above the 400 meter elevation contour, close to 500 m.
Steve located some trees from the original study when he wanted to try and update a reconstruction.
Perhaps someone should go hunting in Quebec.
Steve:
Thank you for the cogent analysis. It really is this bad, apparently.
Most of the really horrific outcome that arise from misuse of statistical analysis involve ignoring the most basic assumptions that form the basis for the entire enterprise….
Ignoring for example, that the behavior of group of sub prime mortgages bundled into CDOs would most likely not be independent of each other set investors up with a bunch of crappy investments that were more likely to perform poorly in an economic downturn…the covariance of the underlying mortgages increased risk, not decreased it, and one didn’t have to be econometrician in order to anticipate this outcome…
Ex post selection of data (without clear rational protocols, established before data are collected and analyzed) is unforgivable, and should be intolerable.
It boggles the mind.
If authors will go to such lengths to cherry-pick for certain results,
what prevents their archiving just the portion of the data that supports those results?
It would be unseemly to suggest that professional ego and personal greed have anything to do with a decision to cherry-pick data when the need arises. The millions of dollars at stake are simply a coincidence.
From D’Arrigo 2006:
An example from the NSF Grant archives:
June 1, 2004
ARLINGTON, Va.—The National Science Foundation (NSF) has awarded the Tree-Ring Laboratory of Lamont-Doherty Earth Observatory (LDEO), Columbia University, a $5.5 million grant to study one of the largest climate systems affecting the globe—Asian monsoons.
The five-year study will apply the science of tree-ring analysis (dendrochronology) to key questions regarding the processes that drive development of the monsoon and its various characteristics through different regions.
“This is the single largest award for tree-ring research from NSF and represents an aggressive investment in tree-ring research….
The tree-ring reconstructions of Asian monsoon climate dynamics project is led by scientists Edward Cook, Rosanne D’Arrigo, Brendan Buckley and Gordon Jacoby, all of LDEO.
-NSF-
Nothing visible was published with that US $ 5.5 million grant from 2004 onwards; I guess they could n´t find any teak wood hockey sticks. Tree growth in a monsoon climate is mostly depending on rainfall, not so much on temperature – I have a teak tree in my garden. http://www.ldeo.columbia.edu/tree-ring-laboratory/tree-ring-research/asian-monsoon/asian-monsoon-references
well, there is this:http:
//www.sciencemag.org/content/328/5977/486.short
But one paper for $5.5 million does seem a bit…sparse.
Are you Shuklish? You don’t look Shuklish?
Bit of a washout.
That study uses tree rings not as thermometers but as pluvio meters. Here is another one: http://www.pnas.org/content/107/15/6748.full
I’m not sure the authors of that study had received the message that climate was perfectly stable until major fossil fuel burning began. They may want to reconsider their conclusions. /sarc off
According to this:
http://www.nsf.gov/awardsearch/showAward?AWD_ID=0402474
…that $5.5 million grant produced 61 papers and 3 books that are apparently more concerned with ENSO and drought than AGW.
Good find and good conclusion.
Now DÁrrigo et al. are back on the CAGW tree – temperature track and in Mongolia they found a recent up tick but also conformations for both the LIA and the “MCA”. http://www.sciencedirect.com/science/article/pii/S0277379115002255
The study is paywalled, naturally. From the abstract:
“Recent warming (2000–2005) exceeds that from any other time and is concurrent with, and likely exacerbated, the impact of extreme drought (1999–2002) that resulted in massive livestock loss across Mongolia.”
Extreme drought and warming. What do the tree rings record? Not the drought (narrow rings), but the warming (wider rings). So in this study, trees are once again thermometers, not rain gauges. Methinks, however, that I detect a disparity between results (wider rings) and growth conditions (extreme drought). One would expect that “extreme drought” would be the determinative factor of growth.
Steve:
Another astonishingly powerful, coherent and penetrating analysis that poses some really tough questions to the scientists involved. Have you heard from Rob Wilson on this?
The D’arrigo et al location map shows quite a few sites from which cores were taken. While I am quite miffed by their exclusion of data from thelon, what impact does this have if you consider the work As a whole.
If none of the other core sites show this same discrepancy, this is a “one off”…..interesting to note, but of no consequence to the results of the complete body of work. Or am I missing something here.
Steve: The “complete body” of work is very contaminated by ex post selection of sites and data snooping. If you re-read the various posts on Yamal/Polar Urals, you will see that the controversy was about ex post selection of sites which yielded a HS, when another seemingly equally plausible selection did not. After controversy arose, Briffa and coauthors spent three years trying to figure out how to salvage a sort-of stick, eventually finding a combination of sites that sort-of “worked”, with Gavin Schmidt at realclimate declaring that other combinations of sites were WRONG!!!.
Many of the canonical regional chronologies were also done by Jacoby and D’Arrigo. Is it plausible that this is the only location in which they did this sort of thing? I don’t think so. I have some work in progress on Gulf of Alaska and divergence depends on which modern sites are chosen.
Nor do people in the field see anything incorrect about ex post selection of sites that go up to “circumvent” the divergence problem. A number of articles based on such practices have passed peer review. Imagine if such practices were embedded in portfolio management advertising.
You seem to be missing a lot. This matter has a history; follow the links provided by Steve McIntyre in the post. Read his email exchange with Cook. Jacoby’s release of the data just prior his death, after refusing to do this for nine years, is tantamount to [snip]
Mpainter,
I’m not missing that at all….I have read the whole story, including yamal. Simple question…..could be served with a simple answer. While I find even this single example deplorable and beyond belief this passes for good science, again, what impact does this have on the complete work. If it has none, than I can keep this gaff in perspective. [snip – I agree with the snipped point and have also snipped the reader's comment that you objected to.]
I agree there was a delay, and obfuscation in not providing data to Mac, but it could also be, having delayed as long as they could, as Mac mentioned, they were required to archive data per their contractual obligations.
OVer the years, NSF has been extraordinarily lax in requiring authors to archive data. Even before Climate Audit, right at the start of my interest in the field, I was extremely frustrated at the failure of Jacoby and others to archive data used in prominent studies, but even more frustrated by the complicity of NSF in non-archiving. I wrote a detailed complaint to NSF in 2004, including Lonnie Thompson as well as Jacoby. NSF totally blew me off, saying that the authors had archived data – which was true. The problem was that their archive was incomplete and did not include data relevant to analyses.
I don’t know that the eventual Jacoby archiving was required under his original grants. They obtained special funding in 2012 to archive data and the 2014 archiving seems to have been in response to that. Frustratingly, it remains incomplete.
Lonnie Thompson and Ellen Mosley-Thompson are other serial non-archivers/incomplete archivers of the same vintage. Given the supposed importance of their ice core drilling, you’d think that they would want to leave the most detailed possible archive of data, as a memorial of their work. But instead, they’ve provided sketchy and incomplete archives, even after complaints. They too are getting older.
A twinge of conscience? 🙂
Seems to me that in the case of Yamal, it’s not just ex post selection, but overweighting of one core to essentially override any others in the selection. Like Mann’s extreme overweighting of Greybill Bristlecones to the exclusion of just about all else.
Steve: you’re misdiagnosing Yamal. There wasn’t any Mannian weighting at Yamal. The issue in the original chronology was that there were relatively few late cores and that the location from which they came was inhomogeneous with subfossil cores.
.
I have noted before that for these researchers, each tree provides its own pattern of variance, and their primary trick is to weight and sum them in different ways until they get a combination that looks something like recent climatic behavior.
its more of a parlor trick than anything else.
Back in the day, we called this enterprise “kitchen sink” econometrics.
Hmm, ok. Well then, I guess I fail to see any climatic (much less climactic) significance to Briffa’s Yamal series.
The fact that these ‘scientists” dont understand the implication of ex post selection of data, without a prior, articulated protocol for discarding data, reveals them to be, at best innumerate.
Simply put, they should be denied access to the tools of applied statistical analysis, until they can show competence at the same level as, say, an undergraduate social work student.
This is obscene, and not in good way…..
Curious. Are core samples for individual trees considered intensive properties? Meaning averaging the results with other cores from other trees are a no-no?
The problems with in-sample data selection and use cannot be discussed too often in my estimation and particularly with regards to climate science where too many scientists evidently have a very large and difficult to understand mental block. SteveM your thread introduction reminds us of these problems.
I have tried mightily to understand this block with not only climate scientists but others to whom I have been exposed. I have to harken back to my experiences with a stock investment blog where I found that those who had the most difficult time understanding the problems were more often than not those working in the hard sciences. I have speculated that the problem comes from those who have had experiences running experiments under controlled and repeated conditions. Somehow they forget that you cannot have the control and repitions with invesments and climate. In hard sciences you can use in-sample results to guide you in devising controlled experiments where you can obtain out-of-sample data. In climate science and tree rings you can look at in-sample data but it can only be verified with out-of-sample data and unfortunately that can require long times.
Next best for tree rings would be to establish pre-selection criteria based on physical considerations and understandings and then using all the data that that criteria selects. Climate scientists wormy in the sea of temperature reconstructions do not even go that far.
“Climate scientists wormy in the sea of temperature reconstructions do not even go that far.”
Would you believe that I did not say that? My tablet did. It should be:Climate scientists doing temperature reconstructions do not even go that far.
They cannot “even go that far” and sustain the conclusions so assiduously sought.
It has been pointed out before that any study based on their “deselected” data would overturn the study purporting to show a climate trend.
this problem reaches into “meta” studies as well, as some ignorant marginally competent researchers will mine a data set for correlations\ repeatedly, without ever applying a bonferroni correction when computing the “p-scores” of their research.
Its indefensible.
That this kind of crap, malfeasance I didn’t tolerate from 1st year students in statistics, says much about this enterprise, none of it good.
I’m not sure if that answered my question or not, lol.
It should be pointed out that the high-energy physicists go out of their way to avoid fooling themselves via a) blinding of data so they don’t know which way their cullng process works until the key is revealed and b) correcting their sigma level for the “look elsewhere” effect when they see a “bump” in a data plot. So not all hard scientists have trouble with these concepts of cherry-picking and peeking at data before doing the test.
Jacoby was a durable and enthusiastic collector of tree ring data from all over the world. Interesting picture of Jacoby at Thelon in 1984. The ancient stump appears above the then treeline.

Steve, your link makes it clear that Jacoby founded tree ring climate investigation, and that Rosanne d’Arrigo was his student, trained by him. From your link:
“Jacoby led the first reconstruction of Northern Hemisphere temperatures going back hundreds of years, helping to show humans were at the root of rising heat over the last century. He was also a leader in using tree rings to shed light on prehistoric droughts, earthquakes, tsunamis and landslides.”
Prehistoric droughts, earthquakes, tsunamis, and landslides. Hmmm.
What would an audit of all of his work reveal, I wonder, rigorous science or …cherry pies?
Steve: a combination of things. connecting tree rings in SW USA to precipitation is quite convincing. Jacoby and Briffa were very early in trying to make temperature reconstructions from tree rings and were much more “successful” in doing so than other contemporary researchers. But take care in over-editorializing.
Yes, it makes perfect sense that treerings would make good indicators of precipitation, or drought. In such instances, one would expect a population to give coherent results, with no need for cherry-picking. I think.
This is clearly the same mpainter who lost all credibility over at Roy Spencer’s blog today.
To summarize, mpainter explicitly backtracked on an agreement to another (first time) poster
to reveal his affiliation. Then in response to data that shows that mpainter’s postings on various climate sites over the past few weeks are essentially 24 hours a day, mpainter admitted that up to 7
people take turns posting under the same name. Further accusations suggest that the mpainter group makes additional posts under false names that simply echo the original mpainter posts.
mpainter has only one goal: manipulation of public opinion.
Warn your friends and enemies !
“Warn your friends and enemies !”
####
Also, provide shelter for your pets and protect tender vegetation.
As always Steve, a wonderful and likely very laborious take down of the poor scientific standards of those seeking not to find the truth but create it. The lesson I’ve learned is to never play cards with these folks as the rules will only be explained once the hands are shown.
I am not a scientist but it strikes me odd that I have never seen an analysis of tree ring data
against real temperature data for any area. Surely somewhere this data exists or can be created for a period of the last 200 years or so. Until someone can show that there really is a tight correlation between tree rings and temperature, isn’t this just BS.
Steve: your comment is unjustified. comparisons of tree ring chronologies to temperature data are very common. However, showing “tight correlation” is a different task altogether.
Hi Brian,
Sometimes they try to show a local correlation (Wilson, Esper are well known at CA)…
Click to access 2015_grl_schneideretal.pdf
Authors were clearly frustrated: “…Modern warming is poorly represented in the new record questioning the ability of MXD to capture very
warm temperatures…”
And graphically they seem to show “divergence” problems. But is that their conclusion? Nope.
“…only a couple appears to be impacted by divergence, suggesting deficiencies regarding spatial representation or chronology quality, rather than a whole-scale limitation of the proxy…”
Another one here http://onlinelibrary.wiley.com/doi/10.1029/2006JD008318/full
In my experience, they give a better match visually than statistically.
I have seen instances where tree-rings correlate better to CO2 than to temperature. I have concerns that the calibration and verification steps in tree-ring studies aren’t accounting for the CO2-enhanced growth and therefore underestimate pre-industrial responses to temperature.
Mr McIntyre:
Im sorry that this commenter’s language was too intemperate…
However, the use of tree rings as a proxy for temperature, when one cannot control for the myriad of other factors that influence tree growth, brings into question the entire enterprise, no?
Steve: there are lots of issues. However, for editorial reasons, I discourage generalized complaining about tree rings, indeed generalized complaining. I prefer that comments are specific.
Brian, I have the opposite complaint. They do compare tree-ring data to temperatures. My issue is they compare the tree ring data to lots of temperature records, and whichever has the best correlation, they declare that that is what the treerings are measuring. For example, comparing to the temperature records of every month, or even five day periods.
Steve does a good job of explaining the cherry picking of the tree cores for the selection in the temp reconstructions. Any insight into the selection of ice cores, particularly in the SH for purposes of temp reconstructions. Thanks for any info
Why do you frame D’Arrigo’s conduct as “Unlike Briffa, D’Arrigo has candidly admitted to the selection of data to arrive at a preconceived result.”? It implies malice on D’Arrigo’s part, yet there is nothing in your paper or the references that would support the presumption of malice – as opposed to maybe misguided zeal.
Steve: I don’t agree that my words imply “malice” as opposed to “misguided zeal”. I did not consider such issues and did not opine on that sort of issue. I believe that the facts adduced here support the specific claims made in my post. I avoid extrapolations as much as possible.
Steve the whole point of the exercise seems to be that the entire climate scientist group (both sides) is
quarrelling about whether the temperature of the world has gone up one or two degrees or fractions of a degree over the last 100 years or so and
whether it is caused by humans. It is hard for non scientist to take anyone serious who purports
to do this over centuries using tree rings when the precision required is obviously missing.Even the veracity of the satellite data seems to be in question.
D’Arrigo’s ideas deserve careful scrutiny.
Sure, there is cherry picking here, and this reminds us of her statement about needing to pick cherries to make cherry pie. But that statement could be read innocuously. “Cherry pie” could be a temperature reconstruction, and cherries could be temperature series. The “cherries” could be picked based on legitimate a priori criteria of proximity to the tree-line, likely reactivity to temperatures rather than rainfall etc.
But the 1999 quote in this article introduces a new issue: “It would be interesting…to see how the trees have been faring…Are the warmer temperatures spurring more growth…Or is the warming…creating drier conditions that…stunt their growth?”
There is no doubt about the meaning of this statement. It shows that the conclusion (warming) has been reached before knowledge of the sign of the evidence (i.e. increasing or decreasing tree-ring width).
In principle, the second, definite, scientific misstep would make the first, less-clear one unnecessary. If either wider or narrower tree-rings still mean warming, why bother to select for wider ones?
Yet they do. The studies always have an uptick at the end, preferably to a new high point. The rest of the graph can be all over the place, even showing record warmth in decades where no other study has ever found it.
Now, Steve hates speculation about unproveable motivations and mental states, and he loves snipping people who stray in that direction. So I am not going there, dear me no, but will only point to three possibly relevant observable facts:
1. Wide tree-rings have been associated with warmth in thousands of studies since the 1980s, whereas before that they were more usually taken as evidence of abundant rainfall.
2. The vast majority of current paleo studies are funded by government agencies, and governments have stated simply and plainly that they “believe in” warming.
3. “Wide tree-rings mean warmth” is a simpler and plainer proposition than “wide tree-rings and narrow tree-rings both mean warmth”.
At the risk of appearing to defend cherry picking which is so self-evidently contrary to the scientific method I wonder if it doesn’t smell so bad in the case of dendrochronology given its origins in archaeology and dating wooden artifacts like church pews or picture frames.In that application one has a shortish snippet of a tree ring width series which is an absolute fact and then slides under it a set of candidate tree ring width time series of known date to identify a best match to the snippet. It could be that our climatology dendro types are tainted by this history and not uncomfortable with the practice of screening out mismatches or discarding entire series in favour of others which contain a match.
That’s a very interesting point. Dendro-defenders still need to demonstrate, rather than assume, the utility of tree thermometers. But your point does suggest that the unique viewpoint of practitioners may prevent them from appreciating the pitfalls that seem obvious to outsiders.
Not sure about that word “demonstrate” in this context. It’s surely not the job of a climate scientist to work out in a bottom up way what factors are responsible for how much weight a tree puts on each year and how much of that is allocated to the cambium and gets converted into a tree ring. It’s a job for the science of tree physiology. Even with only the sketchiest notion of that subject it is obvious that any single factor can only have a statistical relationship at best. The link between a regional climate variable such as mean temperature and the average behaviour of a sample of trees is one step more statistical than the link between local weather and an individual tree.
What we deal with here is more in the nature of the design of an instrument which comprises a sensor followed by a calibration to convert what is sensed to the variable of interest. A major problem here lies with the calibration, the scatter about the curve and the degree to which it drifts. Statistics has been allowed to run riot with hardly a rule unbroken and almost no regard for the loss of degrees of freedom entailed in data torture via cherry picking, arbitrary selection of principal components and other crimes pointed out by Steve’s work.
It may be beyond the scientific competence but it is not beyond the duty of dendrochronologists to demonstrate the physiological basis for trusting tree “thermometerism,” as applied, both in general and in the specifically used examples.
I would be less concerned with cherry-picking if it was limited to an explicit effort to cull “non-thermometer” tree cores from the noisy database. Perhaps dendro specialists believe that is exactly what they are doing.
Anyone, looking at the “dendroclimatology” post of the wikipedia, must ask himself: how can scientists deduce such summer temperature anomalies?.
Well in order to understand this I go to: http://www.wsl.ch/fe/landschaftsdynamik/dendroclimatology/Publikationen/Buentgen_2011_science.pdf and I focus on figure 4. This is the tipical hockey stick figure. But many concerns appear: (1) error bars should be growing as long as we move to the past, (2) error bars should be much greater than they are, (3) the estimated value for averaged temperature anomaly is basically fictitious.
Regarding this last issue the original text says: “we also developed a central European summer temperature proxy based on 1089 stone pine
(Pinus cembra) and 457 European larch (Larix decidua) ring width series from high-elevation sites in the Austrian Alps and adjacent areas”. What seems to mean: “summer temperature proxy based in our fictitious science based in cherry picking and different inventions”.
Steve,
Thanks for your careful and thorough work investigating and exposing what went on here.
I want to find a D’Arrigo portfolio manager. If I understand it, you give them some money and twenty years later you come back to find that every single investment they chose turned out wonderfully well. I could certainly wait for such performance. Couldn’t most of you?
I think there is someone running for president right now who has benefited from just such a resourceful manager. In her case she didn’t have to wait twenty years.
Yogi Berra must have been wrong about predicting the future. it’s all in how you go about it.
You missed him.
His name was Bernie Madoff.
Assuming the 451 Coppermine cores contain a temperature signal, I wonder what the 95% confidence band would look like around that average signal from 1,000 to 2,000?
Just having a look in while driving cross country. All i can say is, unbelieveable !
Steve, This is amazing detective work! You mention that some of these data were used in Mann et al 1998. It is unclear whether that means that cherry picked group provided a substantial part of the Mann results, a small part, or something else. In particular, was this particular cherry-picking alone enough to undermine the Mann findings had the hidden data been available a dozen years ago, or is it a relatively small factor compared to his own cherry picking and the overall statistical misfeasance? Or are we still mired in confusion over Quebec locations?
As for the National Science Foundation, their failure to enforce their own policies over a matter essential to scientific verification or falsification is astounding. One wonders why the Congress and the Government Accountability Office have not pounced on these (dare I call them that?) low-hanging fruit?
Walt
Did you intend for the graph and table to go to their own posts?
Can you list the 5 and 12 and 24 cores?
I could not get the data archives to open so I will post the question I was trying to answer.
“The 12 included Thelon cores do not carry forward to the present, but end in 1925 on an uptick.”
Sampled in 1984 but end in 1925, meaning they only used subfossil trees? Or they truncated the data?
Looking at the core count in the right side panel of figure 2, the count begins to drop in the 20th century, then plunges around 1980 which seems consistent with having cores taken at that time. The core count drops from a high around 450 down to 150 after 1980, making it look like only ~150 of the 366 update cores used in the CNWT went up to the present day. Surely they did not truncate the data after going to all that effort to ferret out the treemometers! The alternative is that most of the update cores could have been subfossil, but why would you core subfossils when there are plenty of standing trees and the goal was to “update”?
Steve: the earlier study was only ~30 cores. So enlarging the sample of subfossil cores is an entirely reasonable and desirable component of an update.
Did you download a Leica camera viewer to open the .rwl files?
I really enjoyed this post and I read most or all of the earlier posts when they came out, so thanks for all the hard work on cherry pie.
Divergence involves tree rings from after 1980. So if the Thelon River cores were similar to other field efforts in being 60% subfossil, the reconstruction discarded ~200 subfossil cores that lacked the recent rings to show divergence. This is merely evidence for additional factors; I do notice a rather depressed MWP, I wonder how this one fits with other western Hemisphere northern treeline MWPs?
How many times does Steve have to expose these “studies” before the “prestigious” journals and organizations get the hint?
OK, I do not want to answer myself.
Steve,
Thank you for the depth and clarity of this.
Apart from comments of others, there are still concerns I have about –
1. How poorly the squiggles along the shafts match when not aggregated/averaged
and 2. What the ring calibration against T looks like for a “rejected” sample, if it is indeed calibrated for its locality. (Maybe a more generic T/ring relation is assumed, like formulaic T derived from oxygen isotopes in ice core.)
Mr. McIntyre, seeing the references to the tree cores, I am reminded of your hypothesis test from a few years ago associated with some coring in the western US. If you are able to get more information about the locations of these trees and decide to make a “McIntyre Family Sojourn” into the back country, I’ll pitch in a couple of Jacksons towards fuel! Perhaps a new hypothesis could be proposed related to a “coffee and a doughnut at Tim’s” or maybe a cold tasty Brador at the Beer Store! Best of good luck with your continued efforts to expose the truth in these many matters.
The evidence clearly suggests that the Thelon trees are depressed, whether because of their warmth-response dysfunction or other reasons is impossible to say at this stage. Perhaps envy of their exuberant Coppermine cousins has led them down a spiral of self-doubt and introspection?
Regrettably, until the nascent field of dendropsychology receives the level of funding it so obviously demands, we can only speculate on the reasons for the perverse reactions of these unfortunate trees. In the meantime, common decency surely requires us to grant them the privacy and anonymity that D’Arrigo has attempted, in the hope that at some future date they may be rehabilitated.
In the linked article [told the surprised panelists] I did not see anything from the panel expressing surprise.
The panel may have been already reeling from the back-pedalling by Alley and Schrag, but I suspect that their jaws had to be re-lifted after this. Hey, it’s old news at climateaudit, but the panel is not so wise in the ways of the Hockey Team
As a cook, if you only pick cherries to make a cherry pie, you will get a cherry pie.
As a scientist the only relevant question that can be asked after this: what cherries made it a good cherry pie and why.
That question does not appear to be what anybody is asking.
With Gain Credit Personal Loans, you can get instant loan/money for a wide range of your personal needs like renovation of your home, marriage in the family, a family holiday, your child’s education, buying a house, medical expenses or any other emergencies. With minimum documentation, you can now avail a personal loan at attractive 3% interest rates. This is trust and honest loans which you will not regret, Contact us via Email: gaincreditloan01@gmail.com
Your Full Details:
Full Name. . .. . .. . .. . .. . .
Loan Amount Needed. . …
Loan Duration. . .. . .. . .. . .
Phone Number. . .. . .. . ..
Applied before. . .. . .. . ..
Country. . .. . .
Email Us: gaincreditloan01@gmail.com
7 Trackbacks
[…] McIntyre on making cherry pie with the paleoclimate reconstructions [link] […]
[…] McIntyre on making cherry pie with the paleoclimate reconstructions [link] […]
[…] Se alla intrinseca difficoltà di estrarre informazioni utili dai dati di prossimità di questo tipo si aggiunge la voglia di tirar fuori solo quello che si ritiene utile ai proprio scopi (leggi conferma della propria ipotesi), il dato da incerto diviene in teoria inservibile, in pratica invece utilissimo. Le informazioni provenienti dalla velocità o meno con cui crescono gli alberi, sono note per un problema definito “divergenza”. In sostanza, molte serie storiche di questo tipo, per ragioni ancora ignote hanno cessato di essere rappresentative nel corso dell’ultimo secolo, mostrando di allontanarsi in modo significativo dai dati di verifica. Tale allontanamento, quindi, potrebbe essersi verificato anche in passato, e rende le serie poco affidabili. Che fare? Semplice, usare solo quelle “buone”, quelle cioè che sembrano (alla verifica) non soffrire di divergenza. Steve McIntyre, nei giorni scorsi, ha portato alla luce sul suo blog uno dei più clamorosi esempi di cherry picking (scelta dei dati in base al risultato e non risultato basato sui dati disponibili) nello studio del clima. Leggere per credere. […]
[…] https://climateaudit.org/2016/01/29/cherry-picking-by-darrigo/#more-20082 […]
[…] a handful of dodgy tree rings and other proxies, which makes Steve McIntyre’s latest post, Cherry-Picking by D’Arrigo, highly […]
[…] « Cherry-Picking by D’Arrigo […]
[…] When questioned by the Congressional Committee one researcher, Rosanne D’Arrigo, made a comment that reflected naiveté and duplicity. When asked why data was narrowly and selectively chosen D’Arrigo replied: […]