The next installment in our search for upper treeline proxies evidencing the AR4 SPM claim that : “Studies since the TAR draw increased confidence from additional data showing coherent behaviour across multiple indicators in different parts of the world” takes us to the Canadian Rocky Mountains, to a study mentioned in the Wilson and Luckman 2003 survey as follows:
Dendrochronological studies at upper treeline in the southern Canadian Cordillera have focused on either Vancouver Island (Smith and Laroque, 1998; Laroque and Smith, 1999) or the Canadian Rocky Mountains (Parker and Henoch, 1971; Luckman et al., 1985; 1997; St George and Luckman, 2001).
This study is not cited in IPCC 4AR and, indeed, other than self-citations within Luckman students, seems not to have entered into proxy discussion – which is too bad, since it actually contains somewhat fresh data.
We’ve already looked at the Vancouver Island hemlock and yellow-cedar chronologies, neither of which yielded HS-shaped reconstructions. Today, we’ll look at the most recent of the Canadian Rocky Mountain citations, St George and Luckman 2001 . They include a short survey of prior studies, mentioning the white spruce chronologies of Jacoby and D’Arrigo 1989, which they credit as showing that this “species maintains a strong common ring-width signal over several thousand kilometres”. They report limited prior work using Engelmann spruce (PCEN) stating:
In contrast, exploration of the climate signal in Picea engelmannii ring width has been limited and the few climate reconstructions developed from this species are based primarily on densitometric data (Parker and Henoch 1971; Hamilton 1987; Briffa et al. 1992; Luckman et al. 1997). Prior studies of preliminary ringwidth data sets from Picea engelmannii in the central Canadian Rockies (Luckman and Seed 1995; Luckman 1997) indicate that they contain a strong common signal. The only previous climate reconstruction based solely on Picea engelmannii ring width was derived from a single site near the south end of Banff National Park (Wig and Smith 1994).
They report on 17 new collections of Engelman spruce sites taken along 500 km of the central Canadian Rockies mostly in 1990 and 1991 (one in 1994), plus 4 sites collected by Schweingruber in 1983. Despite Luckman’s leadership in the IAI Upper Treeline program, which had the objective of creating a public archive, none of the UWO measurement data or chronologies are archived. Luckman said in the IAI Report that they plan to archive the data, but since it’s only been 17 years since some of the collections were taken, I guess it’s still premature to expect the archiving to have been completed.
Their Figure 2 (shown below) shows the average chronology for 17 PCEN sites from 1600-1994 ( presumably the 17 out of 21 sites that were collected by UWO). Only one site (Atha Forest) goes to 1994; the others end in 1991 or earlier. As I’ve observed on other occasions, I am unable to discern a distinct HS shape in this average of 17 upper treeline chronologies, consistent with the SPM claim of coherent behavior, nor a strong positive response to warming in the 1980s and 1990s. Indeed, I’d be inclined to say that values in the 1980s and 1990s were lower than mid-century.
St George and Luckman Fig. 2. Mean standard ring-width chronology (1600—1994) for the 17 Picea engelmannii sites in the central Canadian Rockies. The smoothed line is a 25-year Gaussian filter.
As a small point, I was heavily criticized by Wilson and Pisaric for portraying the average of white spruce chronologies, which included the Meko Alberta white spruce chronologies said by Wilson and Pisaric to be temperature proxies. I’ve shown the criticized graphic below, and, to my eye, I see some points of resemblance between the 20th century behavior of these white spruce “precipitation” chronologies and the St George-Luckman “temperature” proxies.

Average of ITRDB-archived white spruce with update to 1995. See climateaudit.org/…
St George and Luckman then discussed the relationship of these chronologies to temperature, observing that chronologies near Banff are significantly correlated to summer temperature, but not the ring width series near Jasper. This failure is noted, but no explanation is given:
While summer temperature is significantly correlated with the sites near Banff, this statistical relationship is not present for those ring-width series compared with the Jasper climate record. The more northerly sites surrounding Jasper are most highly and negatively correlated with March and April temperatures. The Vermillion series is unique in that it has no significant correlations with climate records from the nearest station. …The inconsistent correlations observed in Fig. 5a may reflect either varying responses of the trees to the same macroclimatic variables or similar responses of the trees to different microclimates (Fritts 1991).
This inconsistent behavior is surely a troubling property in a temperature proxy. (Note that it is Jasper tree ring records that have been used in the multiproxy studies of Osborn and Briffa 2006; Jones et al 1998 etc.) After canvassing correlations against the nearest station, they proceed to discuss correlations against the regional temperature record again with seemingly inconclusive results:
More than two-thirds of the chronologies have significant correlations with June, July, and September temperatures of the growth year, but few are significantly correlated with August temperatures. Bell Mountain, Yoho Pass, and Vermillion Pass are the only chronologies that do not have a significant correlation with either June or July temperatures. Correlations with April and May temperatures are negative … the Jasper tree-ring sites exhibit a consistent association with regional June and July temperatures. As June and July temperatures for the Jasper and regional data sets are very highly correlated (>0.92), this suggests that the improved correlation between the Jasper tree-ring chronologies and the regional summer temperatures reflect the extension of the analysis period from 1916 to 1888, rather than any subregional differences in tree response.
Their reconstruction follows the typical of the Luckman school: principal components analysis of the tree ring network; truncation to 3 or so PCs with eigenvalues greater than 1; varimax rotation; inverse multiple regression of temperature against the rotated PCs. As noted elsewhere, it is my view that this methodology will attenuate low-frequency variance and artificially increase the calibration r2; with the information presented so far, I think that simple averaging is more appropriate and any conclusions should be drawn from the information in their Figure 2, rather than the reconstruction.
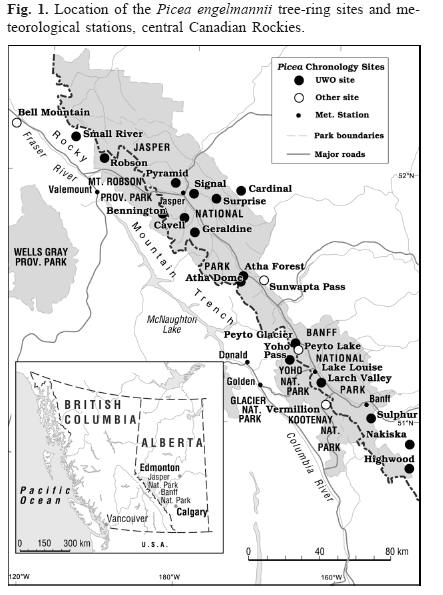
The location of the 21 sites in St George and Luckman 2001 are from the same region as the sites in Luckman and Wilson 2005 , which generated the reconstruction used in Osborn and Briffa 2006, and discussed previously at the blog here, here, here,, with a Rob Wilson criticism here and my reply here. Its predecessor chronology from Luckman et al 1997 was widely used in TAR-vintage reconstructions. There are some differences between the St George-Luckman reconstruction and the Luckman-Wilson reconstruction which I’ll re-visit after this survey is finished.
 |
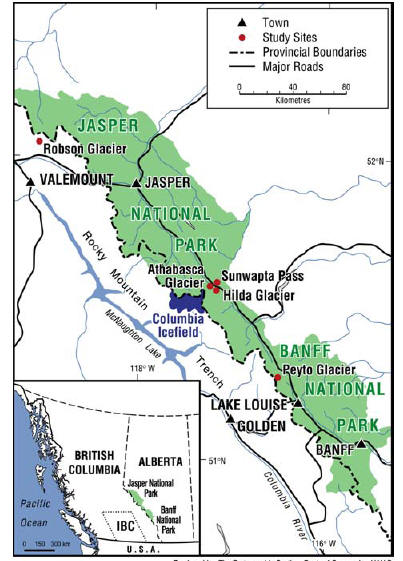 |
Left – Location map from St GEorge and Luckman 2001; right – location map for Luckman and Wilson 2005.
Reference: St George, R.S. and Luckman, B.H. 2001: A proxy record of summer temperatures in the Central Canadian Rockies from Picea engelmannii treeline sites. Canadian Journal of Forest Research 31, 457—70. http://www.ltrr.arizona.edu/~sstgeorg/PDFs/CJFR2001.pdf


5 Comments
The St George & Luckman url needs fixing:
Click to access CJFR2001.pdf
How can we verify that the low-frequency (secular and lower) variability is preserved in the reconstructions?
Variance adjustment reduces low-freq variability of the past (sparser data). If we had some kind of verification tool, this would be detected right away. In addition, we have a divergence problem in 1980-present reconstructions. Funny situation, reconstructions are reliable given that there were no low-frequency variations in the past temperatures.
In many threads, Kalman smoothers etc. have been suggested for reconstruction purpose. But here’s the big problem: Kalman theory (and Wiener and other related) requires a dynamic model for the underlying stochastic process. If we choose random walk we can directly (prior to observations) say that recent temperature rises are completely natural. If we choose a white noise model, we’ll get opposite conclusion. Then we can choose anything between those two models and get different conclusions. This is a dead-end, we can’t use reconstructions for system identification (to choose the underlying stochastic model), because reconstructions depend on that model. Sorry again, too much thinking aloud I guess 😉
LOL. Unique?? Are there ANY tree ring series that are correlated with the nearest station? It looks more and more like any correlation they get between growth and temperature is just luck. Even I understand spurious correlation.
I take it that the Continental Divide is one and the same with the BC – Alberta border in that area?
#4:
Yes. Three of those sites seem to be in the vicinity of the visitor centre at the Athabasca glacier. Are there not 8000 yr. old wood fragments being uncovered as that glacier is receeding? Perhaps with a little cognitive glueing they might make a good temp proxy. 🙂