In an article in Nature today by Thompson, Kennedy, Wallace and Phil Jones claim:
Here we call attention to a previously overlooked discontinuity in the record at 1945,
Well, folks, the discontinuity may have been overlooked by Hadley Center, CRU, NOAA and NASA and by the stadiums of IPCC peer reviewers, but it wasn’t overlooked here at Climate Audit. The absurdity of Team bucket adjustments had been discussed in two early CA posts (here, here, here ). In March 2007, after publication of Kent et al 2007 showed the prevalence of buckets as late as 1970 (discussed here), I showed in a post entitled The Team and Pearl Harbour that this directly contradicted the Team’s Pearl Harbor adjustment and even showed the impact of a more plausible phasing in of bucket adjustments (see below). The issue was re-visited in Dec 2007 here.
In the Nature news discussion, Jones stated:
Climate scientists should think about data quality more often, says Jones, so that there is no opportunity for incorrect data to sow seeds of doubt in people’s minds about the reality of climate change.
Amen. Maybe instead of concealing his data – even to the extent of obstructing FOI requests for the identity of his station data, Jones should provide a complete archive of his data and methods, so that there can be some independent due diligence on his data.
Briefly reviewing my earlier post, in March 2007, I wrote the following:
One of the Team’s more adventurous assumptions in creating temperature histories is that there was an abrupt and universal change in SST measurement methods away from buckets to engine inlets in 1941, coinciding with the U.S. entry into World War II. As a result, Folland et al introduced an abrupt adjustment of 0.3 deg C to all SST measurements prior to 1941 (with the amount of the adjustment attenuated in the 19th century because of a hypothesized use of wooden rather than canvas buckets.) At the time, James Hansen characterized these various adjustments as “ad hoc” and of “dubious validity” although his caveats seem to have been forgotten and the Folland adjustments have pretty much swept the field. To my knowledge, no climate scientist actually bothered trying to determine whether there was documentary evidence of this abrupt and sudden change in measurement methods. The assumption was simply asserted enough times and it came into general use.
This hypothesis has always seemed ludicrous to me ever since I became aware of it. As a result, I was very interested in the empirical study of the distribution of measurement methods illustrated in my post yesterday, showing that about 90% of SST measurements in 1970 for which the measurement method was known were still taken by buckets, despite the assumption by the Team that all measurements after 1941 were taken by engine inlet.
I first examined the effect of a gradual changeover to engine inlet measurements using the 1970 distribution of Kent et al as a benchmark. A Climate Audit reader (Carl Smith) observed
it looks to me like the WWII records were dominated by engine-warmed intake data, perhaps because the chaos meant much of the bucket data did not get recorded, and after WWII it was business as usual with mostly bucket data resuming.
I illustrated this scenario, describing it as follows.
Let’s suppose that Carl Smith’s idea is what happened. I did the same calculation assuming that 75% of all measurements from 1942-1945 were done by engine inlets, falling back to business as usual 10% in 1946 where it remained until 1970 when we have a measurement point – 90% of measurements in 1970 were still being made by buckets as indicated by the information in Kent et al 2007- and that the 90% phased down to 0 in 2000 linearly. This results in the following graphic:
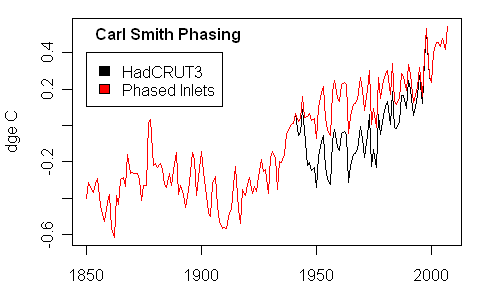
Black – HadCRU version as archived; red- with phased implementation of engine inlet adjustment
The transition from primarily bucket measurement in 1970 to primarily engine inlet in 2000 was supported by the following graphic in Kent et al 2007 discussed in last year’s posts e.g. here:
[UPDATE (May 30): A reader has contacted me to say that buckets in the 1970s were predominantly insulated buckets not uninsulated buckets and that the differential between insulated buckets and engine inlets is less than between uninsulated buckets and engine inlets (say 0.1 deg C, versus 0.25-0.3 deg C). So there may be a couple of things going on in bucket world – a change from buckets to engine inlets and a change from uninsulated buckets to insulated buckets. The latter possibility was not clearly articulated in Thompson et al, or for that matter in the predecessor articles, but may nonetheless be a real effect. IF such transition were complete by the 1970s, then this would contain adjustments in the 1980s to ones resulting from differences between insulated buckets and engine inlets, which would be less than between uninsulated buckets and engine inlets. I’ll take a look at this. I’m going to look for discussion of the transition from uninsulated buckets now said to have been in use after WW2 to insulated buckets. This episode definitely confirms my very first point on these bucket adjustments: whenever the adjustments are as as large the effect being measured, then there needs to be a replicable description and careful aassessment of all aspects of the adjustment process.]
Turning now to Nature’s news article describing this recent “discovery” by the Team:
The humble bucket turns out to be at the bottom of a perplexing anomaly in the climate records for the twentieth century.
A US–British team of climate scientists has now found a surprisingly simple explanation for the long-standing conundrum (page 646). It turns out that the mysterious drop is due to differences in the way that British and US ships’ crews measured the sea surface temperature (SST) in the 1940s.
Only a few SST measurements were made during wartime, and almost exclusively by US ships. Then, in the summer of 1945, British ships resumed measurements. But whereas US crews had measured the temperature of the intake water used for cooling the ships’ engines, British crews collected water in buckets from the sea for their measurements. When these uninsulated buckets were hauled from the ocean, the temperature probe would get a little colder as a result of the cooling effect of evaporation. US measurements, on the other hand, yielded slightly higher temperatures due to the warm engine-room environment.
The standard logbook entries made at the time contain no information about how the measurements were taken, so the cause was overlooked, says David Thompson, first author on the paper and an atmospheric scientist at the State University of Colorado in Boulder. As a result, the bias — which, although small, was large enough to produce the sharp drop in global mean temperature — was never adjusted for.
The article itself provides the following information on SST measurements:
The most notable change in the SST archive following December 1941 occurred in August 1945. Between January 1942 and August 1945, ~80% of the observations are from ships of US origin and ~5% are from ships of UK origin; between late 1945 and 1949 only ~30% of the observations are of US origin and about 50% are of UK origin. The change in country of origin in August 1945 is important for two reasons: first, in August 1945 US ships relied mainly on engine room intake measurements whereas UK ships used primarily uninsulated bucket measurements, and second, engine room intake measurements are generally biased warm relative to uninsulated bucket measurements.
In our estimate, we hypothesized a wartime changeover to about 75% engine inlet, with business as usual after the war, then gradually going to the 1970 distribution of Kent et al 2007. Thompson et al estimate 80% changeover to engine inlet during the war, with a return to business as usual after the war.
It’s nice to see that the Team has discovered what we at Climate Audit have known for some time – the assumption that all SST measurements switched over to engine inlets in December 1941 was absurd, ad hoc and introduced without any justification or textual analysis. It remained in climate literature despite obvious evidence that the majority of reported SST measurements in 1970 were being done by buckets.
In an accompanying comment, Forest and Reynolds say:
The SST adjustment around 1945 is likely to have far-reaching implications for modelling in this period.
My guess is that the aerosol stuff is going to be heavily affected. Aerosol histories always seemed to be designed a little conveniently to accommodate the supposed post-WW2 cooling.
It’s too bad that this foolish assumption has contaminated surface temperature histories and that IPCC was incapable of identifying an error known here at Climate Audit. As Jones said,
Climate scientists should think about data quality more often
Update: Would it have been possible for a Nature editor or reviewer to have located this prior Climate Audit discussion? If they had googled “climate world war 2 adjustments”, the very first item earlier today was http://www.climateaudit.org/?p=1276 . The present post has now superceded the earlier post and is now ranked atop Google on this search. But simply googling the expression would have identified a prior discussion of the issue.
Here’s an updated version of the graphic posted up last year using data downloaded today.

Update (June 1): Thompson et al stated:
The adjustments are unlikely to significantly affect estimates of century-long trends in global-mean temperatures, as the data before ~1940 and after the mid-1960s are not expected to require further corrections for changes from uninsulated bucket to engine room intake measurements. However, compensation for a different potential source of bias in SST data in the past decade— the transition from ship- to buoy-derived SSTs—might increase the century-long trends by raising recent SSTs as much as ~0.1 deg C, as buoy-derived SSTs are biased cool relative to ship measurements [10 – Worley et al 2005]
Whether or not this latter observation is correct, the citation, Worley et al 2005, provides no support for the assertion as the word “cool” is not used in it, nor do any occurrences of the word “buoy” contain supporting language.
Update Reference: Worley, S. J., S. D. Woodruff, R. W. Reynolds, S. J. Lubker, and N. Lott. 2005. ICOADS release 2.1 data and products. Int. J. Climatol 25, no. 7: 823–842. http://ftp.wmo.int/pages/prog/amp/mmop/documents/Jcomm-TR/J-TR-13-Marine-Climatology/REV1/joc1166.pdf


151 Comments
Perhaps a letter to Nature claiming priority?
Does the Nature article reference the prior result. If not, then where were the reviewers on this issue?
#1. I don’t blame the reviewers, as it is a blog rather than “peer reviewed” literature. However I am entitled to make the observation. It’s also unreasonable that Nature Blogs doesn’t link here, while it links to blogs that are far less substantial in content.
Know what happens with the aerosol effect that was supposedly the caused of the cooling?
Sorry it should be “now” in the previous post
I wonder how NSF and the USDOE like paying for information previously determined for free.
The worst thing about the US DOE is that, despite paying for Jones’ data, they said that they were unable to require Jones to disclose the identity of his stations.
Does this mean that the GCM’s are now going to have to go back and re-tune their models so that they “accurately” reflect the climate of the past?
re:comment 6
Steve.
The head of the US DOE department that funded Jones recently retired. Try again.
#7. Looks like it to me. Should be fun.
The other shoe that surely needs to be dropped is the pre-1940 adjustments. This is the arm-waving re-allocation of canvas vs wooden buckets.
There is an important inter-relationship between these adjustments and the solar correlation debate. George Reid, who argued for connections between solar and SST around 1990, used older SST without the Folland 1941 adjustment. If this adjustment is now perceived to be bogus, other than for a few years, then a lot of calculations get re-opened.
I actually started looking at temperature data with a view to examining Reid’s analyses, but as so often in climate, one gets bogged down because it’s so hard to find any solid ground beneath the adjustments.
Sorry for the laughter, but this is the kind of stuff that keeps me coming back here. Trillions of $ on the line and this is the best science they can come with. Something an amateur beat them to.
This deserves a trip to the tip jar.
From the news story: “‘More data problems will undoubtedly come along, if likely of smaller magnitude,’ he (Reynolds) says.”
Is he referring to the shift in HADSST around the time of the 97/98 El Nino?

Maybe if we all hang on for a few more years, there’ll be a Team article citing a previously overlooked problem with the Graybill bristlecone chronologies?
Steve, this was a good spot and an informative read a while back. CA is well ahead of the pack as usual.
I’ve followed this “bucket” story in previous discussions but had not fully appreciated its importance till now: well done again CA. Just to state that I was on a member of a North sea survey crew back in the early 1980’s when throwing a bucket over the side of the ship was the accepted method of obtaining water samples for temperature/salinity analysis.
As it was pretty damned cold in the Norwegian sector of the North Sea I wouldn’t be surprised if a sizeable amount of “samples” actually originated from from the ship’s own water tanks. It was much easier to get the water from the taps than by slinging a bucket over the side in a freezing gale. My opinion is that the quality of such ship derived data is dubious.
This thing with the SSTs reminds me of the revelation after the Cold War
that in many Russian cities, mayors or other local leadership would have
their “offical” daily temperatures exaggerated in order to make it look as
if it were really colder than it was, in order to get more money for fuel
from Moscow. After 1990 we see a sudden jump in Siberian temperatures-
coincidence?
Dear Steve and this site’s followers,
Great post and really interesting subject.
As a 4th year geography student I have read into covered observational trends in a fair bit for my course at the University of Bristol. The bucket issue had perplexed me and I’m glad it has finally been resolved.
However, I find the triumphant manner in which this website presents the results slightly at odds with science: It is a process of discovery where making mistakes is encouraged and the best theory to date holds. Poking fun at previous efforts for being slightly out seems unproductive: The main findings from past model-experiments are unaffected.
Also, you did not discover the bucket issue either. It is well documented an excellent elementary climate book (p.55-57) and has been extensively discussed by Parker et al. 1995.
I commend this site for raising an important issue but believe readers should not get the impression that observational data quality is a new issue or that modelers are unaware of it.
From my perspective, these data do not change the need to do something about climate change on a global level.
Steve: In the underlying post on this topic, the Folland adjustments are cited and discussed. The bucket adjustments were developed by Folland. My point of departure was to observe the extraordinary weakness of the analysis underpinning the schedules attached to the adjustments and the inconsistency of the Folland adjustments with objective evidence from Kent et al as to 1970 sampling. Read the underlying posts. The refusal of Phil Jones and his associates to archive data has been an ongoing battle at this site. Jones said – “We have 25 years invested in this. Why should we let you see the data when your only objective is to find something wrong with it? This is the attitude that young students should be objecting to.
I also think that I’m entitled to claim some priority in this observation. Had the authors bothered to google “climate world war 2 adjustments”, they would have immediately seen my prior post on the topic even if they fail to acknowledge this.
As to climate change policy, unlike many readers, I’ve said on many occasions – most recently at Ohio State – that I’ve never suggested nor do I now, that policy be stalemated pending more definitive studies. My main urging has been that climate scientists stop acting so much like prima donnas and that they recognize an obligation to the wider public if their results are to be relied on for policy purposes, that they archive data and methods in proper due diligence packages, and that thorough and truly independent due diligence be carried out on key models being relied on for policy purposes.
While modelers may well be “aware” of data problems in private, these issues have not been fully reported in public documents. IPCC AR4 does not contain any mention of uncertainty attached to bucket adjustments, although that was an easily identified uncertainty that had been discussed here on several occasions.
re 16
Good work, Climate Auditors. Your work must sometimes feel like a thankless task as the usual perps cash on your due diligence with nary a nod in your direction. But don’t doubt for a minute that a vast silent majority is out here quietly reading and watching the great debate and ultimately, each in our own capacity, acting upon what is revealed by your audits.
If there is any triumphalism here it is of the same nature as The Mouse That Roared. Perhaps, a fitting metaphor since Hansen referred to his detractors as mere “jesters.”
Mr. Lovelace
Many CA readers, including myself, have views somewhat different from yours. Nonetheless, thank you for contributing, and congratulations on your soon to be completed 4th year at University of Bristol.
Thanks Robin, for a study which pooh pooh’ed the consensus from that time frame (mid 90’s) . Today’s mission is to narrow down when the IPCC’s purpose started trumping objectivity. I want to put a date on when peer review became censorship.
Parker 95 helps.
Here is a facinating rationalization from TAR on the bucket adjustments:
http://www.grida.no/climate/IPCC_tar/wg1/055.htm
Steve: As Raven observes, this quote is from TAR. Bucket adjustments pretty much drop from sight in AR4. The point about model confirmation is excellently taken. If these adjustments and the models were mutually confirming, then the models are disconfirmed with the changes.
Here is an article on WW2 Atlantic SST from a somewhat different perspective. Bernaerts’ focus is on factors other than buckets vs intakes during the war period.
Here is some more data on buckets written in an email from Phil Jones to me about March 2006.
Now Phil Jones was an author of
Jones, P.D., D.E. Parker, T.J. Osborn, and K.R. Briffa. 2006. Global and hemispheric temperature anomalies–land and marine instrumental records.
In that paper he quotes both papers he referenced to me –
Folland, C.K., N.A. Rayner, S.J. Brown, T.M. Smith, S.S.P. Shen, D.E. Parker, I. Macadam, P.D. Jones, R.N. Jones, N. Nicholls, and D.M.H. Sexton, 2001a. Global temperature change and its uncertainties since 1861. Geophysical Research Letters 28, 2621-2624.
Jones, P.D., and A. Moberg. 2003. Hemispheric and large-scale surface air temperature variations: An extensive revision and an update to 2001. J. Climate 16, 206-223.
So it is likely that he knew of the bucket effect before the IPCC report of early 2007 was released as Summary for Policy Makers.
But it looks like their significance and poor mathematical treatment was just let through to the keeper. (This is a cricket term which the English understand. It means that you do not attempt to bat a ball). So, this is how the science was “settled”?
Steve: Geoff, the bucket adjustments have been an integral aspect to the global temperature history. Jones would be the first one to agree. It’s not that bucket adjustments are being discovered for the first time by the specialists. What is new in the present article (for the IPCC crowd) is the point that I made in the earlier Climate Audit post – that the Folland et al schedule for bucket-engine inlet transition was highly implausible and the adjustments used in all IPCC histories are almost certainly incorrect.
I may have missed it in earlier comments, but I see that, rather than adjust the heat biased intake temps down, Jones and Co. adjust the post 1945 bucket data up to meet the intake data. Sounds backwards to me, but I’m not a climate scientist.
Does this not help to further eliminate the cooling from 1945 to 1978 that creates a problem with the models (now accommodated with aerosols)?
Sounds a little like Hansen adjustments. Always round and adjust up.
I just posted the following comment at the Nature news article
What kind of nonsense is this about slight warming of water temperature at engine inlets? I was a Marine Engineer’s apprentice starting in the late 70s, most of the US fleet prior to the late 80s was primarily steam turbines and prior to WWII was steam driven triple expansion piston. All sea water temps were taken at the inlet to the various heat exchangers and main condenser inlet. The volumes of water taken in was of such quantity there was in essence no time for any significant (measurable) heat transfer from the engine room.
Most temperature wells were within 5 to 10 feet of the main condenser inlet. The pipe size being around 3 to 4 feet in diameter depending on the Horsepower of the steam propulsion plant. Additionally, when a steam ship is going sea speed, i.e. not manuvering in or out of a harbor, the intake scoop was opened bypassing the main condenser pump as an energy efficiency step since the forward motion of the ship was more than sufficient to drive water into the main condenser scoop and through the heat exchanger. Btw- Most of those thermometers were analog in one degree increments. All of those readings were taken every hour during a 4 hour watch, 24/7. So I can personally attest that US ships didn’t use bucket measurements at during my time during the 70s and 80s.
Steve: The issue is more that buckets experience cooling not experienced by engine inlet measurements, not that the engines warm the water. See the PArker-Folland discussions referenced in the early CA discussions of this topic.
Re: Robin Lovelace @#16
Some relevant quotes from the text book and Parker may have shown us all where the Nature article would not only have provided evidence of neglect to what Steve M reported at CA but to Parker’s peer reviewed paper and a textbook. We all have to think for ourseves and, while it is fine not to worry Robin, some of us do — and because of developments such as this one.
Steve: Again, all parties are aware of the PArker-Folland papers. The issue is the erroneous adjustment in those papers.
Re # 24 Comment by Steve McIntyre
Yes, I agree with you 100%. That’s why I noted that Jones had let poor mathematical treatment go to the IPCC record, despite the documented probability of knowing that it was poor.
The discontinuity around 1945 was part of the ensemble of poor data/treatment that caused me to contact Phil Jones back in 2006 or so. I fully agree with your leader that Nature has nothing new to say, that CA had already picked it up and deserves a mention.
The bucket problem was not the only plausibly-known, unfinished business that Phil Jones let through to IPCC. You and I and the readers know of these problems but Joe Citizen does not.
But keep heart, “The mills of the Gods grind slow, but they grind exceeding fine”. (?Plutarch)
Lucia has one of her typically excellent posts on this topic here.
I’ve also posted up the articles in question under Thompson… if you go to http://data.climateaudit.org/pdf/others
I’ve added a updated graphic using temperature information up to today’s date.
Geoff Sherrington says:
May 28th, 2008 at 9:33 pm 28
But keep heart, “The mills of the Gods grind slow, but they grind exceeding fine”. (?Plutarch
ancient proverb, recorded in greek:
http://www.answers.com/topic/the-mills-of-god-grind-slowly-yet-they-grind-exceeding-small
Somewhere, Richard Feynman must be grimacing, scoffing and muttering “cargo cult science.” The “scientific” circus of surface temperature measurement based on cool canvas buckets, hot wooden outhouses, ice-covered balloons and endless ad hoc “adjustments” is ripe for a Feynman-type send-up.
(‘”Cargo cult science” is a term used by Richard Feynman in his 1974 Caltech commencement address to describe work that has the semblance of being scientific, but is missing “a kind of scientific integrity, a principle of scientific thought that corresponds to a kind of utter honesty”.
(‘”We’ve learned from experience that the truth will come out. Other experimenters will repeat your experiment and find out whether you were wrong or right. Nature’s phenomena will agree or they’ll disagree with your theory. And, although you may gain some temporary fame and excitement, you will not gain a good reputation as a scientist if you haven’t tried to be very careful in this kind of work. And it’s this type of integrity, this kind of care not to fool yourself, that is missing to a large extent in much of the research in cargo cult science.”‘ Immediate source: Wikipedia)
Once again, Mr. McIntyre, thanks for your prolific analyses and your dedication to “utter honesty.”
IPCC AR4 Review Comment 3-321 responding to concerns over WW2 records:
Folks, also re-read this post http://www.climateaudit.org/?p=2525 which didn’t attract much interest at the time, but has some good points in it.
Oh thats rich Steve. “Very Likely” indeed.
I noticed the post http://www.climateaudit.org/?p=2525 by googling “sst bucket adjustment”. It contains a now very topical discussion of Woodruff and Paltridge – an SST history before the Folland adjustment swept the field, as shown below.
As I observed in the post, it is ironic to note that realclimate flamed Scafetta and West on the basis that their solar model couldn’t explain the decline in temperature after WW2. I observed that this particular argument against Scafetta and West turned entirely on highly questionable bucket adjustments.
Realclimate should now acknowledge their error on this point. (I won’t hold my breath waiting).
Steve writes:
I’ve been wondering about this for a while: to what degree do failures of the land and sea records to correlate with solar activity reflect inhomogeneities in the temperature histories rather than limitations of the solar driven models. e.g., the bucket change-point and the degrading climate network in the later decades of the 20th century.
While the drop is still there in the land measurements, you’ve all surely noticed that this correction will make the correlation with CO2 better so it will be easy now for the climate models to match the climate record without using the controversial aerosol adjustment (which Hadley used but GISS seemingly didn’t). I wonder if it was the recent aerosol findings that prompted this re-look at the data.
I wonder how the new take on 1940-70 marine temperature data correlates with meteorological and anecdotal records of unusually cold winters and cool summers during this period? These seem to have been convincing enough to inspire fear of global cooling.
Steve,
Something doesn’t jibe here, engine water intakes on a commercial ship are located at the bottom of the ship some 20+ feet underwater. Bucket readings would be at the surface. The temperature of the water 20 ft down is warmer, the same or cooler than the surface? And at what season of the year? I fully expect to see engine intake temps to be cooler in the summer than the bucket reading and near the same temp in the winter. Not to mention, engine intake readings were taken every hour 24/7 and those log books were reviewed by someone. The deck crew had their own log book taking air temp readings. I doubt very seriously that bucket readings were taken on an hourly basis by the deck crew, maybe once a 4 hour watch at the most. Then you need to consider some deck hand sticking a thermometer in the bucket, what governed how long he left the thermometer in the bucket? Wouldn’t bucket readings actually tend to be on the warm side given they are dependent on the deck hand’s judgement and whether he was in a rush to get the job done to move on to other stuff? Engine intake readings needed no such judgement or time delay being continually immersed in water, the only variable there would be the person reading the mercury thermometer accurately. On top of all that, speaking of accuracy, typically on a commercial ship a thermometer once installed was never rechecked for calibration and only replaced if broken or if vibration caused the mercury column to separate giving an air gap. So the thermometers used for these readings could be up to 20 to 30 years old and never recalibrated.
Mike Hulme, quoted by the BBC‘s own AGW correspondant Richard Black:
Why do I feel nauseous?
Steve: John A, take a deep breath and relax.
I’m not a scientist. If assumptions like this one about temperature measurement represent the way that science is done, then “science” is just crap. I wonder why other scientists allow their fields to be polluted in the public mind this way. And I have to wonder about the climate “scientists” who tolerate this garbage while making public pronouncements of impending doom.
[snip] A normal person would check to see if the temperature recording stations passed standards of basic scientific competence. That Watts and his volunteers are the first to do so is scandalous.
A normal person wouldn’t ignore centuries of history on the MWP and little ice age. A normal person wouldn’t reject the advice of the best forecasters and best computer modellers in the world. A normal person would demand that research be shared and reviewed by others. A normal person wouldn’t stand for a scientist who had to be subpoenaed to produce his work. That’s just sick.
I was taught to check my work before handing it in when I was in the first grade. It looks like a whole lot of climate “scientists” need to go back to first grade.
This is hubris on steroids.
Steve: Stan, take a deep breath and relax.
Steve,
I think you should write a short ‘comment on’, and send it to Nature. I know you have posted on their blog, but that doesnt count. More generally, this will keep happening if you don’t submit more work for publication, as I warned you recently in a previous post (April 18 http://www.climateaudit.org/?p=2995). It would not be much work to convert some of your posts into papers, and even if they are not accepted you can put them on a widely-read preprint archive. Sorry to go on about this but it is really important!
So the adjusted HadCRUT3, if accurate, looks like a linear rise in temp starting just after 1900. It will be interesting to hear the explanation for that.
Right. A house of cards crumbling is good news for the state of the science. It’s just not good news for the house of cards.
Breathing. Relaxing.
The ‘news story’ is also reported in the Independent here. Amazingly, the title of the piece written by their global warming hype correspondent Steve Connor is “Case against climate change discredited by study”!
(Trying very hard to breathe deeply and relax!)
Can any one quickly calculate the decadal temperature trend from 1900-2000 using the new data? I did it with the old data and came up with a 0.07°/decade temperature rise (based off a 5 year averaging), but that data still had the cooling from 1945-1980.
Note that the currently “accepted” temperature trend is 0.16°/decade since 1980.
@32
Figure 3b shows 1945 as a peak for land as well. What do you believe is incorrect about the IPCC comment?
Just to recap, here’s what we’ve seen over the last couple of months. In response to the demonstration that the climate models make specific predictions about the behaviour of the tropical troposphere that run counter to the conventional data sets, the modelers’ defence was: but we all know the models are actually so uncertain and tunable that they could generate any outcome, therefore they can not conflict with the data, so there’s no need to doubt the hypothesis of strong CO2 warming.
Then in response to the particular observation that the balloon data lie especially far away from the modelers’ expectations, the defence is: but we all know the balloon data is so uncertain and tunable that it can yield lots of different interpretations, therefore it does not conflict with the hypothesis, so there’s no need to doubt the hypothesis of strong CO2 warming.
Now, a long-overdue quality-control procedure wipes out much of the mid-century cooling in the sea surface temperature data. This of course raises the concern that maybe other features of the climatic data are equally suspect, including some of the warming over land since 1980. The response is: we all knew that the SST data compilation procedures are so uncertain and tunable that these adjustments were needed, and scientists better improve their quality control otherwise people will get funny ideas about the hypothesis of strong CO2 warming.
What next? Well the mid-century cooling was explained with a bit of hand-waving about sulphate aerosols, whose assumed cooling effect allowed for a dialing-up of the corresponding warming from CO2 in the models. If there’s much less mid-century cooling, that will conflict with an assumed strong aerosol cooling effect in the models, and by implication, a strong CO2 warming effect. To which the response will be: Yes but the aerosol components are so uncertain and tunable that we will shortly demonstrate how a strong aerosol cooling effect is consistent with a lack of mid-century aerosol cooling, so there’s no need to doubt the hypothesis of strong CO2 warming. At a rough guess I’d say watch for such an article in Science around mid-November.
#45 PaulM
Did you read the spin in the last paragraph of the “news story”?
…(take a deep breath)…[self clip]
93 (dscott) Last year at CA, various methods of bucket sampling were discussed, with human factor influence (lazy sailor, drawing it up slowly and similar), various buckets used etc., etc. I wonder, if perhaps someone tried now to sail with an old ship with an inlet and taking at the same time bucket readings with various implements. Last year it seemed to me a good idea. But I doubt that the Team deigned to such menial work 😉
48 (RM) As is typical in this debate, certain advocates defend a point with a metric whose underlying precision is inadequate and can be manipulated to say whatever is desired. What is insidious in this matter is the doubt being entertained about the critical importance of the meaning of the thermal content of the oceans, and the suggestive data from the Argos buoys.
Tree ring cores were tiddlewinks, this is serious stuff.
============================
Steve, I think the first time i heard about problems with the bucket adjustments and dip in SST mid century was in 2005, I think Mike McCracken told me about this. I suspect that I wasn’t anything like the “first to know”, so this has possibly been an issue for a few years even prior to 2005. Kudos to climateaudit for an in depth analysis of this over a year ago. you should definitely post something over at the nature blog on this. I didn’t pay too much attention to this issue, figured that people in charge of these data sets would be sorting things out, in any event, my research was mostly looking at post 1970 SSTs. So why is this all of a sudden “news”? Very bizarre actually, and really makes me wonder even more about the peer review process over at Nature. In any event, this “splash” should make people pay attention to this issue and correct the data sets. in terms of “attribution”, the corrected data set is actually easier to explain in terms of greenhouse warming. The whole aerosol forcing thing was always a mess, will be interesting to see if the 20th century “forcing” used in future IPCC runs is adjusted in response to the SST change.
Ideally, climate data record data sets are prepared by data experts that don’t have an axe to grind one way or the other on specific scientific debates. Then these data records are used by other scientists in their analysis, modelling, etc. research, and should be critically evaluated by these groups providing feedback to the data experts. Having the major climate modelling centers also in charge of climate data records is worrisome: the michael crichton issue of subconscious bias entering the data sets.
#52. Hi, Judith. Ross McKitrick has always observed that the Consumer Price Index is prepared by a professional statistical organization and not by university academics. There are many reasons for this, and subconscious bias is merely one of them.
You wouldn’t want the person who prepared the Consumer PRice Index to be swanning around the world to international conferences and being measured on journal publications. Much more of an accounting mentality is needed. It would make a lot of sense for a Chartered Accountant to be in charge of the data, managing whatever climate scientists or statisticians he needed.
Actually, it is a big deal for attribution studies.
And don’t think that it doesn’t affect post-1970s SSTs and that the issue is contained to WW2. If the Folland adjustment for engine inlets was justified in the first place and engine inlets were the dominant measurement in the 1990s as represented. then the changeover had to take place AFTER 1970 – which takes about 0.25 deg C off the post-1970 temperature increase, not a small amount.
It also has an interesting knock-on effect in the solar attribution debate – check my Dec 2007 post on this. Some issues thought to be closed were actually closed in part because of the discredited Folland adjustment and need to be re-opened.
The IPCC AR4 Review Comment noted in comment 32 above was to a MacCracken comment.
The issue was raised in 2005 at Climate Audit here http://www.climateaudit.org/index.php?p=226; the 2007 analysis was prompted by new information from Kent et al 2007 that should have set alarm bells ringing at Hadley Center. The implication was completely obvious.
Steve,
I must admit the SST adjustments had been one of the least interesting topics on this site to me. While it’s a relatively straightforward topic, I guess I saw it as one where your mathematical and statistical aptitudes didn’t really come into play. Re-reading all of the old posts, I now see what an eerily bang-up job you did on the subject. You deserve plenty of patting on the back, although I am sure you won’t get it from the climate science community.
Roger Pielke Jr comments here
JAmes Annan commented here, refusing to name Climate Audit by name, but, unlike NAture, acknowledging our priority:
Do I hear well? Correcting observations is all right, as long as the conclusion remains the same? Ah… never mind.
Right, but then what exactly was Robin Lovelace’s point other than to put a polite spin on a put-down of efforts of auditing and analyses at CA — and without being very clear or precise about it.
As others have said. Relax. When properly implemented the scientific method is likely the best way to gain understanding of life, the universe and everything. That a few people misuse it for self serving purposes does not discredit the entire field.
Steve,
James Annan may not mention CA by name, but the word “everyone” in his comment is actually a link to this topic on CA.
I think it is a tweek not at CA or you, but at those who think merely mentioning your name is to give you underserved credibility.
Greg
I’d love to see a dependence tree for this.
Re: Ross McKitrick @ #48
I, and evidently others who have posted at CA, have been at least somewhat surprised by the uncertainty in a number of conclusions coming out of climate science on the issue of AGW — and uncertainty that can be derived from some rather straight forward and simple analyses and observations. The examples Ross sites are those were strong AGW advocates now our verifying those analyses in order to avoid hypothesizing that observations do not match the climate model outputs.
Apparently we are being told that one instance does not change the general conclusions – and being told that several times for several instances.
I thought Nature was a high class Scientific Journal.
Surely they owe an apology and explanation of your priority?
A few weeks ago I went back to self imposed exile in the Lurker room after calling Hadley incompetent, well I was wrong, they aren’t actually that good!
Back to the lurker room!
Brohan et al 2006 is the definitive publication of the present HAdCRU data set, including the discredited bucket adjustments. In a post last year, I questioned their reliance on the following citation as statistical authority [Rumsefled 2004], a reference to the prominent American statistician, Donald Rumsfeld. Brohan et al:
In the future, rather than perpetuating the use of the clumsy phrase “bucket adjustment” to cover a what is really a set of stepwise adjustment procedures, we could describe the present activity as the search for Windowed Marine De-trending procedures.
re: #64 Steve,
Personally I suggest the Climate Community commit to a surge in Intake Reanalysis And Quality control.
Re: #39 dscott,
The thing is that there’s a “mixed layer” where the surface water is mixed. Primarily this is driven by wind/waves and can range from 10 meters to 50 meters or so. In any case the temperature 20 feet down should essentially the same as that at the surface; though there is a thin layer, I understand, just at the surface which may not get mixed. Or perhaps it’s just warmer because of absorption of IR
Steve Mc.
I agree with Greg Meurer’s take on Annan’s post. It appears to be a gracious acknowledgment of your work with the joke being on those that believe they shall not speaketh your name three times lest you be summoned to appear.
#68. I wasn’t trying to be snippy with Annan; I find his online persona to be thoughtful and quite pleasant, quite unlike certain others. The link is clear and the reference would be hard to mistake even without a link. But presuming an ironic intent (which is most likely), isn’t it odd that the field should be so adolescent that such archness should exist?
#67, yeap, that’s the point isn’t it? How do we know the temperature change in the water column on any given month in any particular body of water unless systematic sampling is being done which really only occured in the last 5 years with submersible probes? Have you ever swam in a pond? Dive down about 5 to 6 feet and tell me if you can feel a temperature difference. If you can feel a temperature difference then there is at least a 3 to 5 degree F change. You’re not going to feel a 1 F difference. Mixing of the top 50 meters is entirely dependent on the length of time and strength of the wind blowing. Bucket readings and engine intake readings are basically apples and oranges unless you are willing to put an error bar of 3 or 5 degree F range. Now tell me using such limited data which such as range even statistically reasonable to make a year on year comparison versus a seasonal one?
I see, my prediction about IPCC Fifth Assessment Report might be correct.
In Folland2001, uncertainty due to bias-corrections is zero after 1941 (fig 1a ), BTW.
Here we go, a nice little chart on stratification of the water column: http://serc.carleton.edu/eet/phytoplankton/primer.html Look under the heading of stratification. Now look at the summer chart: http://serc.carleton.edu/images/eet/phytoplankton/water_column.jpg So by this chart the summer time has the largest temperature variability in the water column even down 20 ft. Spring, Winter and Fall you should get close to similar readings between the engine intake and bucket. By my guestimate, during the summer you have to either subtract 5F from the bucket reading or add 5F to the engine intake reading to be consistent.
#70. IF the measurements are made consistently, then lots of things will average out. The only issue relevant to this post is changes in measurement systems and adjustments to deal with that. Please take any more general problems to Unthreaded or the Bulletin Board.
I’ve added a SST category to collect posts http://www.climateaudit.org/?cat=50
Re #68
jeez,
Where do I send you an invoice for my new keyboard?
😉
What I would like to see is the raw data, unadjusted. Is that available or recoverable?
Re #39 and #67. I had the same question, so I did some looking. On the following site from Ucar, they indicate that the solar radiation and mixing gives a fairly uniform temperature in the first tens of meters. The thermocline starts at 100 to 400 meters down. Maybe a definitive study could give a more accurate measurement of any temperature gradient between the surface and say, 10 meters down.
http://www.windows.ucar.edu/tour/link=/earth/Water/temp.html&edu=high
This is one more piece of evidence that the sensitivity is probably too high for the models since the temperature “peel out” that they have been bashing skeptics over the head with since that period didn’t apparently happen. It is also evidence of chicanery on the part of modelers to insert undocumented aerosols to fit the curves, then harp on its steepness. Like how a few volcanos during the peak of the LIA could cause the aerosols to create the entire event. To be fair, it also strengthens the case, in my mind anyway, that “something” is happening, and it is to the GCM’s credit that they needed to be tweaked, even if the tweaking was underhanded, to show this event.
I wonder what this will do to the models.
According to Keihl:
http://www.climateaudit.org/?p=2475#more-2475
“In many models aerosol forcing is not applied as an external forcing, but is calculated as an integral component of the system.”
I predict the calculated aerosol forcing from these models is about to undergo a significant drop.
I also predict it will be accompanied by studies showing either:
a) The quantity of atmospheric aerosol from the 40’s-70’s is much less than previously thought
b) The cooling effect of aerosols is much less significant than previously thought
Both these results will of course be presented as having REMOVED the last possible vestage of doubt in the veracity of GCM’s.
re. #75, yorick says,
I think the jury is still out as to how this will confirm the accuracy of the GCMs. For one, the warming showing in the plots above show an almost linear increase over the century. To my eye, it looks like there are two linear periods 1900-1940 and 1940-present. While it may show that the temperature increase is proportional to the CO2 increase, it’s just as clear (at least to me) that the relationship isn’t nearly as sensitive as has been claimed. As Pielke says, the decadal temperature rise trend is now half (0.06°/decade as compared to 0.11°/decade) of what had been claimed.
Also, a rigorous study of the ‘closed’ issues needs to be undertaken so as to see how many things had been dismissed as inconsequential due to not matching the given temperature record (solar input, for example).
One question: the article in the Independent shows a chart where only the decade immediately after WWII is affected by this. What are the differences between this chart and the charts Steve has shown above?
If your graph should be more close to the truth, Steve, doesn’t this mean that CO2 is unequivocally the driving force of Global Warming since the 40s?
This seems like a lot of fodder for real climate guys, not the other way around, at least for me.
I think it would make sense to have people who focus on instrumentation to be in charge of the data. These people exist in all disciplines of engineering and science, and whose MS and Ph.D. thesis involved performing physical experiments.
Someone above commented that the authors of the recent paper are suggesting that the current switch from engine inlets to bouys could be biasing the temperature downward. Since this is happening right now, the idea is somewhat testable, and should be tested. It’s entirely possible to run measurements in parallel for a period of time and compare.
The theory ought to be tested, as it is important to know whether the current flat trend is due to a transition in data collection techniques.
I’d echo dscott’s notes of US Navy SST sampling practices in the 1970s, 1980s and 1990s. The main intakes are below the surface, probably 30+ feet for a Carrier, large Amphib or large Auxillary and 20+ feet for Cruisers, Destroyers and the like. The intakes for WWII ships were similar.
US Navy ships submit weather observation reports hourly (when not restricted by operations) with observed dry & wet bulb temps, SST, cloud cover, barometic pressure, sea states and wind observations. SST in these reports are the intake temps. Actual SST measurements are made when an expendable batho-thermagraph (XBT) is dropped. The launch tube is above the waterline, thus ensuring the measurement of SST. Under normal peacetime sailing conditions that would be every 6 hours or so, depending on one’s supply of XBTs. During an anti-submarine warfare exercise or the like, an XBT would be dropped every hour.
Of course, the point of dropping an XBT (or in WWII dipping a BT) is to determine where the surface layer is in order to predict the effective range of one’s sonar above and below the layer and to estimate the best place for a submarine to be, tactically. I’ve seem surface layers as little as zero feet (the temp drops from the surface all the way down) and as deep as 300 feet (North Arabian Sea winter).
Perhaps the thinking should be done before their own adjustments create the “incorrect data” in the first place!
…(and I can’t resist)… 😀
The subtitle to this thread should be “Climate Science Kicks the Bucket!”
#79. realclimate used the post-WW2 cooling as an argument against Scafetta and West, so there are wheels within wheels here.
As to the effect, it is what it is. Whatever it is won’t contradict anything that I’ve said here. Despite what people think, I haven’t taken sides on most issues. I am extremely critical of prima donna behavior and sloppy analysis and people often confuse that with taking sides. Until I can locate a careful exposition of how doubled CO2 leads to (say) 2.5 deg C warming, I’ve been careful not to express any opinions on such matters. I’ve asked many visitors for such a reference – which I expect to be non-trivial and detailed – and no one’s provided one yet, which is too bad.
Especially since your oeuvre is pretty substantial at this point.
Luis Dias,
the question isn’t whether the world has warmed, but, whether it is warming at a precipitous, dangerous, rate.
This adjustment reduces the RATE OF CHANGE DOWNWARD for the period from mid-end of century!! This reduces the warming TREND to NUTHIN HAPPENIN.
In #55 Steve links to a good summary from Roger Pielke Jr. you may want to read.
Here is documentation from 1964 that would seem to support the measurements from engine intake as reasonably accurate, that is, not biased warm. It also makes statements about the range of temperature in the top 10’s of meters. Wish I could afford to buy it.
http://stinet.dtic.mil/oai/oai?verb=getRecord&metadataPrefix=html&identifier=ADA035012
http://www.jennifermarohasy.com/blog/archives/003121.html
Two questions:
1)The mid century cooling was hard to reconcile to solar forcing also. Does this change improve the solar forcing argument?
2)Has the SST record been corrected for location mix? British naval ships pre early 1940s would be largely concentrated in the north Atlantic. USA ships post mid forties were largely concentrated in the mid to south Pacific? Murray
Re #79 and #80 Luis,
It’s certainly all food for thought. I must admit on reading your remarks my first concerns went not toward RealClimate.Org, but the snappily-named blog “Air Pollution, Aerosols and Clouds in the Climate System”. And in particular, toward the recent winner of the Dan David Prize, the “…towering figure in atmospheric aerosol research .. (whose) .. paper with Lacis in Nature (doi:10.1038/346713a0) has been used by many to show the importance of atmospheric aerosols in earth’s radiation budget.”
Perhaps he’s moved on from aerosols already.
Regardless, whether or not CO2 is a driving force seems to me to be a secondary issue. The conclusions I draw from this sorry saga coincide at least partially with those of Dr Jones. His remarks on data quality are unimpeachable, though it’s a personal regret that I couldn’t see his face when he made them. Likewise David (What’s Climate Audit?) Thompson.
The oversight, reconciliation, management and integrity of climatological data is the standout problem. Steve’s efforts here have positioned CA at the forefront of these ultra-topical issues, to the extent that CA is arguably the default authority (how many lurking young climate scientists have admitted over a beer that they have wanted to post here, yet do not for the sake of their careers?)
I have written to media outlets running this story urging them to give credit where it is due.
#89. This the Phil Jones who said
#81, good point lucia, why would temps be going down? Would that be because Buoy instruments would be calibrated on a periodic basis? I can tell you from the commercial shipping side, practically never. Of course given the negative PDO and AMO we should expect temps to drop. How far down or at what depth are buoy water temperature sensors mounted?
Luis Dias, I wonder if you would describe for us your conception of the mainstream sceptical position? snip you would find out that the mainstream position is not that the impact of CO2 is zero, just that it is less than the alarmists claim, and reducing, on account of it is logarithmic. Steve would argue that we have no way to know that for certain, and he would be right, but lacking the comprehensive manual for the Earth’s climate, I am betting that way. This is possibly, IMHO likely, one more piece of evidence for the mainstream skeptical position
Gavin gave the following quote to New Scientist
“Tracking down anomalies and dealing with them are therefore the number one pre-occupation of the custodians of those data sets,” says Gavin Schmidt, a climate modeller at the NASA Goddard Institute for Space Studies in New York, US.
“It is important to note that this study in no way was associated with modellers trying to fix the data to get a better match. The bottom line is that the data are what they are and anomalies need to be fixed. This is one more step in that process, and it probably won’t be the last,” he told New Scientist.
Now why should he stress that it is “important to note that this study is in no way associated with modellers trying to fix the data to get a better match”.
Isn’t this a strange thing to say? Could it even inadvertently be hinting that they might have done so previously?
Just asking.
Sorry,
Ignore #93, I misquoted my quote of Gavin, got it right in #94, I hope!
OOps apart from the y from “study”
Gulev et al in the Journal of climate identify some substantial problems with the measurement sampling for historical ocean-air flux interactions.
Estimation of the Impact of Sampling Errors in the VOS Observations on Air–Sea
Fluxes. Part I: Uncertainties in Climate Means
Gulev et al JOURNAL OF CLIMATE VOLUME 20 January 2007
Hi Steve,
Re 90: You quote Phil Jones as stating that he would not release his data so that you could destroy it..25 years investment and etc. But when I went back to the source of the quote I found it to be one of your list of 15 reasons not to release data. So is there a real attribution to Jones? Can you point to a source of this quote?
The reason I find this interesting is that a group of us developed in the 1990’s the “TOGA data disclosure policy”. Simply, those who make measurements, compile data sets and etc. have 2 years of “ownership” before the data and its sources must be made public. Data remained under PI wraps for years before this and there was never availability for research or subsequent scrutiny. I thought we had made a difference! DOE was party to this agreement I seem to remember. So I am interested when/where Jones made this statement (who I presume is funded by DOE).. If he did he is in violation of the TOGA protocol.
BTW, if the blip in the SST record were due to the bucket/intake transition, would one expect all of the blips in each ocean basin to be in phase?
Regards
Peter W
http://www.canadafreepress.com/index.php/article/3151
You may have to check with Hughes or von Storch for confirmation.
I have to de-lurk for a sec and say. I love the fact that the Independents headlines have it as “Case against climate change discredited by study”.
They have a big helpful dotted line that shows the jump over the annoying ditch.
I feel sure that Steve would have loved to have been credited by them for being part of that discovery of discrediting a whole “case” 😉
I have no more than a recent basic knowledge of statistics inspired by this site, and this may seem a bit political, but surely this mean that aerosol weightings have a lessened credibilty now. Is it to the extent they are just a bit suspect, or are they totally suspect and do studies and grants in this area lose their appeal?
Re: #98
I saw the e-mail exchange with my own eyes. To give context, it was at the end of a long series of really convivial e-mail messages back and forth between Phil Jones and Warwick Hughes, mostly where Jones apologizes for not being able to collate the data because . Then Jones appeared to lose it completely and that quote came at the end.
I wonder if anyone has had any luck with the UK FOI Act.
Hi, Peter, thanks for saying hello.
The statement was made to Warwick Hughes who forwarded me a copy of his email. Von Storch disbelieved that any scientist could say such a thing and contacted Phli Jones directly for confirmation. HE reported that Phil Jones confirmed the statement in his presentation to the NAS panel reported on CA here, with link to PPT.
The TOGA protocol is a reasonable one. There are some high-level policies that I’ve reviewed previously (See Archiving Category old posts), that require this sort of policy. NSF – Paleoclimate doesn’t require it, although some other NSF departments do. The DOE agency funding Jones doesn’t require it either. We contacted them a couple of years ago and they said that Jones’ contract with them did not entitle them to make any requirements on him for the data. This was a couple of years ago. If I’d been in their shoes and funding someone who was making me look bad, I’d have told them – maybe you beat me on the last contract, but either you archive your data or that’s the last dime you ever get from us. But DOE were just like bumps on logs.
The only lever on Jones has been UK FOI. Willis Eschenbach has been working on this for years. Jones wouldn’t even disclose station names. 6 or 7 different attempts have been made finally resulting in a partial list. After repeated FOI actions, we got a list of the stations in Jones et al 1990, a UHI study relied on by IPCC to this day. As noted in CA posts and by Doug Keenan, Jones et al 1990 made claims to have examined station metadata that have been shown to be impossible. In any other discipline, such misrepresentations would have the authors under the spotlight.
My understanding is that the adjustment was applied across the board to all oceans, so, yes, it would apply to all oceans. To be sure, you’d have to inspect their code, which is, of course, secret.
Also there’s more to this a WW2 blip. As I observed in a companion post, Thompson et al are simply lost at sea in assessing the post-1960s effect. The 0.3 adjustment previously implemented in 1941 is going to have a very different impact than Thompson et al have represented.
If the benchmark is an all-engine inlet measurement system, as seems most reasonable, then the WW2 blip is the one part of the record that, oddly enough will remain unchanged, as it is the one part of the historical record that is predominantly consistent with post-2000s methods. Taking the adjustments at face value – all temperatures from 1946 to 1970 will have to be increased by 0.25-0.3 deg C since there is convincing evidence that 1970 temperatures were bucket (Kent et al 2007), and that this will be phased out from 1970 to present according to the proportions in the Kent et al 2007 diagram.
Recent trends will be cut in half or more, with a much bigger proportion of the temperature increase occurring prior to 1950 than presently thought.
Peter W–
Good question. These are the sorts of questions people should and will ask. My first thought is that, yes, the shift should be in phase everywhere. However, it might depend a bit on what precisely went on. Were 100% of measurements used taken by the British using buckets until some specific day, and the next day 100% were taken by Americans using engine inlets? And then, did things suddenly switch back in one day? Or was there a smooth transition in different parts of the world? Could British ships far from the European theater have taken measurements for at least a little while before stopping?
I don’t know the answer to these questions. But they are the sorts of things I’ll be wondering about as we learn more about the proposed re-adjustments to the data.
There is going to be a lot more heat before we get much light on these questions. But anytime data are adjusted long after they are disseminated to the public, people are going to be skeptical about the re-analysis.
Here’s a copy of the “25 years invested” email, which was forwarded to me the same day. This was in early Hockey Stick days.
Here’s the full correspondence file sent to me by Warwick:
Email to Jones just before 18 Feb
Email to WMO
Steve, various posts. Is the data Dr. Jones has that’s not “gridded data” somehow special? I take out of that (if I remove the center, which is of course ‘rather odd,’ to say the least, but rather chatty in a challenging sort of way) as:
Maybe it’s a UK/Oz kinda thing going on there in the middle that should be ignored. A bit of a spot of a joke, wat?
Are there individual property rights involved in the other data? If so, why not give details in some way and end the subject? *shrugs*
Lucia #102
Maybe even better questions (or at least more questions!) are if the shipping lanes are/were indicative of the non-shipping lanes, and do the exhausts of various kind of ships have different effects upon the weather in the areas they are sampling at affect the ocean in that area in different ways?
Steve,
Thank you for the sequence of messages. Let me see what I can do. This is not right!
On another issue, I was wondering about the phase of the SST blip between different basins. I am currently suffering from “digital amnesia”. My hard disk crashed on my laptop and I will not know for another week or two if data is retrievable. But my recollection was that the “blip” occurred in different basins at different times and I should have enough data to make that determination from my office computer. But, my recollection is that the blip occurred at different times in each basin. Wil try hard to put together a figure tomorrow or at least over the weekend.
Peter
Re #98, #101, #102
It’s an interesting issue that may impact some of the SST/hurricane work of the last several years.
re 81. GSMT is a job for a tech. not scientists. It’s silly that climate scientist bother themselves with this task and more silly that they botch the job. It’s a frikin task for tech for god’s sake.
You want to screw up a simple task of reading instruments and recording data. Hand the task to Dr. XYX.
Here’s the Kaplan SST for August-October in the MDR region of the tropical Atlantic. The blue line is about where a 0.3C increase would place the 1950s SST:
Regional changes may matter.
(Sorry for mentioning the h-word on this SST thread!)
Peter W. you are correct when you say regarding the inavailability of the Jones data:
For what it is worth, I filed an FOIA request to see if I could get the data … no joy. I went further up the chain of command … still no joy.
The excuse was that some of the countries had requested that he not release the data … OK, fine, I said, then I’d like the list of countries who refused, and the data from the rest of them.
Still no joy.
So, that’s where it stands. I was finally able to get them to release a list of the sites used … but I had asked for the dates when they were used as well (started in 1947, ended in 1988, that kind of thing for each one). Never got that either.
Good luck in your quest,
w.
PS – they said:
I asked where on the NCAR or GHCN websites the data were available, and which version (NCAR or GHCN) they had used … no joy on that one either. Their response seemed like a crock of sh*t to me, how could they possibly be doing the work to provide the global average and at the same time “not hold” the information?
Pathetic …
Steve: These FOI requests have been chronicled at CA. They may be in the Surface Record – Jones et al 1990 Category.
Did you appeal it to the information commissioner?
David, we are obviously interested in the implications of this SST issue for hurricanes. Steve, ok to discuss on this thread or should we take it to the hurricane thread?
Steve: I’ll make a new thread.
Here’s an interesting bit of correspondence from Phil Jones to CA reader Geoff Sherrington, who was unsuccessfully trying to get data from CRU, previously posted up at CA here, but the significance changes with the present situation:
This sort of observation prior to the present situation should be kept in mind by people who feel competent to assert without actually doing any calculations that elimination of the Hadley Center error will improve the fit of models to data. Perhaps re-cast models will ultimately fit data better, but, if the above is any indication, there may be more to this than meets the eye.
One of the things that the Hadley Center error did was to make land and sea data look more like one another than perhaps justified by the native data. It’s not easy drilling down to data that has not been synchronized somewhere so it’s hard to make categorical statements. We shall see.
I will say one thing about climate scientists appearing here. I have stopped making the kinds of snide remarks I made about some of them earlier who appear here. Case in point, if one only took the press portrayal of Judith Curry’s views, one might find her a bit of an ideologue on this issue. Now it is prety clear that a lot of the ideologue slant comes from the writers, editors, and publishers looking for the money quote to push their agenda. Journalists are decidedly unqualified to judge the science, yet their judgement is what we get every day. For instance, it is not at all clear which side this will break on, skeptic (my guess) or modeller(there is evidence there too), but to read the press accounts, one would think that a new club to bash “deniers” has been found like a pot of gold at the end of a rainbow.
@All. Thank you for the replies. If the trend is actually smaller, then the flattening temperature of this decade is more understandable. It seems to me that a lot of data has the potential to throw a lot of things into the bananaland, so I’m curious about what does this thing to the models. About my understanding of the “skeptics position”, it is irrelevant. I don’t see a mainstream position, I see a skeptical one, which by definition is skeptic of any consideration by the “warmers”. That includes too many flavours. What I said is that this seems to me as great canon fodder for Real Climate. Unless of course they needed aerosols to justify CAGW.
Concerning the scientists who are afraid of posting here, I read it as hearsay which could be taken as a wishful thinking fantasy. Watch out for that, people.
“I don’t see a mainstream position” — Luis
That is what I thought. Be careful to keep your stereotypes intact, this makes if far easier to dismiss the things you don’t want to hear. One thing I never hear from the warmies is the ability to recapitulate an argument made by a skeptic, even if they think that it is wrong, and then “demolish” it. It just doesn’t happen. And I spend a lot of time on climate discussions.
I’ve added the following to the head post:
One other factor over the period post-1945 to 1963 which limited and affected SST observations in the Pacific Ocean were the various nuclear test series, for numerous military, political, physical and biohazard reasons, and the consequential local hydrophysical, hydrobiological, and atmospheric perturbations such testing occasioned.
No doubt outliers were dropped from records made during those times, but who will tell?
Afaik, there are no definitive independent studies relating to any effects during this period for obvious reasons.
Papers relating to bomb-related oceanic C14 measurements started to appear in 1976.
Did the reader with the info about insulated/unnsulated buckets know anything else about how the measurements were actually taken?
We are talking 1940s – was a “Temperature Probe” a thermometer?
Lot of respect for stokers but did they realise their readings were going to be taken as gospel to 1/10th of a degree? There was a war on.
Are there any manuals or even those involved surviving?
Had a physics lecturer once whose pet hate was “Spurious Accuracy” eg when the correction is bigger than the difference being measured.
re Uncertainty in bias corrections,
this is just another example how uncertainties are underestimated (as in MBH98, Juckes et al etc etc) . Here’s Folland01 Fig 1
Zero error at 1945, as in HadSST2,
and now Thompson et al say,
Clear conflict with zero uncertainty.
Their term “uncorrected instrumental biases” implies that those biases are somehow correctable, to the point of zero uncertainty, that’s where they go wrong.
The media attention the Nature paper has received from both Nature and the blogs may be a case of making an inverted mountain out of an inverted molehill. By attributing a mid-century temperature “dip” to an artefact of SST measurement methods, they appear to overlook the possibility that most of the mid-century temperature aberrations represented natural climate variation, with artefact at most a minor contributor.
Probably the first thing to note is that the most conspicuous deviation in the 1940s is not a “dip” but a temperature spike peaking around 1939-1940 and ending around 1950. What is interpreted as a “dip” is also the descending limb of that peak. Is it more than that?
This era was characterized by a number of internal climate variations that coincided with the rise and fall seen in the peak. They include the Atlantic Multidecadal Oscillation (AMO) that exhibited a warm phase from 1930-1965, but with a transient drop between 1945 and 1948, a Pacific Decadal Oscillation (PDO) that shifted from warm to cold between 1942 and 1950, and a series of El Nino conditions from 1939 through 1942. It is plausible to suggest that the recorded dip reflected these natural oscillations, and possibly others.
Is there evidence to support this speculation? In fact, SST measurements are only one means of recording temperature over the oceans. A separate method involves marine air temperature (NMAT) measurements that are less robust but generally match SST quite well. These, of course, are not subject to errors involving insulated or uninsulated buckets or engine intakes. If one examines NMAT records, they faithfully parallel the SST trends at most times during the twentieth century. During the 1940s, this is also true, but only partially. In particular, they exhibit the same dip as the SST measurements, implying that this dip cannot be fully explained by SST artefact. However, the SST dip slightly exceeds the NMAT dip, and it is this small excess, rather than the entire descending limb of temperature, that is most plausibly attributable to artefact. (In passing, one should note that land temperatures also exhibit a peak and decline, but to a much lesser extent).
Given reasonably strong evidence that the 1940s were characterized by naturally occurring temporary upward and then downward deviations from long term warming, it is reasonable to conclude that appropriate corrections for artefact, if warranted, will likely be quite small, and limited mainly to the 1940s and early 1950s when SST and NMAT diverged slightly. If so, the corrections will have minimal effect on the accuracy of temperature trends outside of that interval, or on the explanation of those trends in terms of aerosols or greenhouse gas forcing.
Hmmm, am I the only one who thinks that gavin’s
is in conflict with the figures I posted above (#119) ? Déjà vu, they always admit that they are aware of problems, but you won’t see it in the uncertainties. Upper error bar cannot reach present temperatures, u know. (That’s why global temps prior to 1850 are not published ?? )
#121. I agree. You quote Gavin:
then why did Nature publish a paper by Thompson et al 2008 stating they the discontinuity had been “previously overlooked”. Shouldn’t Gavin be directing some of his bulldog services towards Nature and Thompson et al?
UC, you’ve always been very focused on the Brohan errors. Their error bars for 1945-1965 are an unreported casualty of this adjustment.
re 122 and RealClimate4
I hesitate to bring this up since many people must be thinking of it. However, on reading the Real Climate posting, the image of Richard Feynman at the Challenger hearings came to mind. The RealClimate posting resembles NASA’s O-ring presentation as a very complicated technical subject that required advanced technical knowledge to consider. We all remember Feynman’s detailed rebuttal to NASA which consisted of placing some O-ring material in a glass of ice water and crumbling it between his fingers. It did not take a Ph.D. in mechanical engineering to see that that material was not suitable for use in a space rocket.
Similarly RealClimate refers to many learned papers about the issue of dipping a bucket in the ocean, taking a sample and measuring its temperature with a mercury thermometer. We all supposed to be impressed with the deep learning of climate scientists who can fathom the complexities of such a system. Sometimes problems are neither deep nor obscure.
Yes, and I think that they are slowly catching up the idea 😉 See http://hadobs.metoffice.com/hadsst2/diagnostics/global/nh+sh/ , now they added
Very good, it is important to show that non-statistical smoothing at the endpoints means apples-to-oranges comparison. Uncertainties are still wrong in that figure, unfortunately.
Re#122, the bulldog will graciously lick his master and those his master befriends him to. Outsiders get far different treatment.
How does this whole bucket kerfuffle affect the idea that global warming first became unambiguous in the temp record in 1979?
Yorick–
I suspect some would tell you it’s foolish to speculate. Wait for the experts to reveal all. 🙂
I wonder how many papers will have to be re-done
They’ve moved on.
hompson et al stated:
Whether or not this latter observation is correct, the citation, Worley et al 2005, provides no support for the assertion as the word “cool” is not used in it, nor do any occurrences of the word “buoy” contain supporting language.
Reference: Worley, S. J., S. D. Woodruff, R. W. Reynolds, S. J. Lubker, and N. Lott. 2005. ICOADS release 2.1 data and products. Int. J. Climatol 25, no. 7: 823–842. http://ftp.wmo.int/pages/prog/amp/mmop/documents/Jcomm-TR/J-TR-13-Marine-Climatology/REV1/joc1166.pdf
http://www.climateaudit.org/?p=2955 30/03/2008 vs.
http://hadobs.metoffice.com/hadcrut3/smoothing.html 08/04/2008
Re: #130
I could not find any support for the Thompson supposition either, but I did come away with some excerpts from that article listed below that to me indicate that these data sets are far from the “finished” products that some climate scientists appear to claim nor would the errors and biases be considered by the data set keepers to be of minor importance for those using the data.
Rayner et al 2006 does state that buoys. So there is some support for the idea, but not from Worley.
Curiously the amount that buoys are said to run cooler then engine inlets (about 0.1 deg C) is perhaps not dissimilar to the differential between insulated buckets and engine inlets. So maybe there are a couple of offsetting errors and that’s why things level off after 1980 (but which would count against their hopes to find an extra 0.1 deg C in the buoys).
Robust seems to be a favored term:
Things robust does not mean: Accurate, precise, correct, intellectually sound, based on scientific principles.
The results are somehow sturdy. It seems to suggest that the errors are link the resin in particle board, holding the bits of wood together, resulting in a nice strong material. It may not be real wood, but it’s robust. 🙂
What is frustrating in analyzing these temperature data sets with the accompanying readjustments and claimed error bands is that there appears to be no simple and straight forward exposition of what has been done. Perhaps this arises becauses I have not dug sufficiently deep into the published papers.
I guess this why Steve M gets the big bucks.
Actually, there’s lots to give ICOADS credit for. It’s a huge database that people have worked on for years, if not generations. I’m going to do some posts on it.
Re: #139
Could you link me to a simple or even not so simple exposition/explanation of how ICOADS adjusts the data?
The earlier examination of this problem on this blog — http://www.climateaudit.org/?p=1276 — has a graph in comment 3 (Willis Eschenbach) which illustrates the uncluttered problem. It uses uncorrected data, not Hadcrut. The uncorrected graph does not just show a huge drop in ’45, it shows an even more extraordinary rise in ’39/40.
I have seen stated that this temperature excursion is an ENSO event. If so, it is a very strange one — even the huge ’98 event is dwarfed by its size and duration.
It is premature to judge from limited information what has been done to the data, but if any out-of-the-ordinary warming is being dismissed as ENSO then an opportunity to examine this most peculiar temperature excursion will be missed.
JF
Re # 141 Julian Flood
Very good observation. Suppose further study provides an excellent case for an adjustment, agreed by all. To which temperature series should the adjustment be made, and what effects does this have on uncertainty estimates?
It’s a thought full of weary, but my feeling is that the time is nigh to clean the slate and redo 1850 onwards land and sea, with clearly-justified adjustments starting from raw. We presently have overcooked Irish stew instead of a neat layout of potato, carrot, lamb, etc., in the right proportions.
Compelled to reiterate comments above to concentrate on accuracy (lack of bias) rather then precision (spread of results). Will withhold passing swipe at “settled science”.
Nature mentions Climate Audit!
#122 Steve wrote — “UC, you’ve always been very focused on the Brohan errors.
Have you noticed the straightforward error in Brohan, et al. 2006 in paragraph [18] under “2.3.1.1 Measurement Error” ?
The authors state: “The random error in a single thermometer reading is about 0.2 ºC (1 s) [Folland et al., 2001];”
And then go on to state, “the monthly average will be based on at least two readings a day throughout the month, giving 60 or more values contributing to the mean. So the error in the monthly average will be at most 0.2/√60 = 0.03 ºC and this will be uncorrelated with the value for any other station or the value for any other month.”
But that can’t be correct. They’re treating the data as though they were taking 60 immediately sequential readings of the same value, when instead they’re taking 60 time-separated readings of different values, once each.
The correct measurement error based on 60 independent readings entered into the monthly mean temperature will be √[(0.2)^2*60/59] = 0.2 ºC, 6.7 times larger than they allow. In paragraph [28] they discount measurement error as unimportant, based on their 0.03 ºC estimation. But the correct 0.2 ºC error alone doubles the received uncertainty in the global average surface temperature statistic.
Reading in more detail about the ICOADS data set, I find that it is a publicly open and accessible data set that has collected extensive data, condensed it and made preliminary QC checks and adjustments on it. These data then are used (and encouraged to be used) by finished data set producers who make their own adjustments such as measurement bias.
When I noted in an earlier post that ICOADS appears to be an unfinished product, indeed that appears to be the case, but an intentional case. In order to trace adjustments, for example, an SST data set, one would have to start with the preliminary adjustments made by the providers of data to ICOADS and those performed by ICOADS and then follow on with those made in the finished data sets such as Kaplan, Rayner and Smith and Reynolds. Note, however, here what the ICOADS paper cited and linked above by Steve M has to say about the various finished data sets:
ICOADS evidently performs such QC basics as determining that the measurements were indeed made at sea and not on land and trimming data to produce two statistical product lines: one where a trim is based on 3.5 standard deviations of smoothed median value for each box and three separate climatological periods and another using 4.5 standard deviations.
I believe that David Smith has made comparisons of two of the commonly used SST data sets and presented the results here. I would think that using that comparison as a basis, it would be instructive to determine why these data sets differ.
The graph excerpted below from the link below certainly shows in graphic fashion the growing use of buoys in measuring temperatures from 1980 on to the present time.
Click to access jma00_B.pdf
#146 — UC, thanks a lot for your explanation. I had to think about that for a while. If I understand your model correctly, “T” is the monthly mean temperature and “n” is the variation about that mean in each of the daily temperatures. I.e., n=(t-T), where “t” is a daily reading. Is that right?
If so, I can see the statistical model. However, in the same manner that Chris Essex and Ross wrote that global average temperature is physically meaningless, so is a monthly average temperature, T. It’s a statistic, not a physical quantity.
However, T is being represented as though it had physical meaning. If that’s true, then the physical uncertainty in that quantity should be represented in a physically sensible way. Typically, when presenting the results of fits, we include both physical (systematic) and statistical errors, represented as e(sys) and e(stat). If they are combined, they’re usually combined linearly.
It seems to me the same criterion ought to apply to T. That is, as a representative of some physical state, it ought to have a physical uncertainty, which would be the rms uncertainty of the physically unique data point — the daily reading — taken 60 times, i.e., the ~0.2 C noted above. It can also have a statistical uncertainty calculated according to the statistical model, 0.03 C.
But representing the uncertainty in a physically relevant average by a strictly statistical uncertainty, no matter that its excursions fit a statistical criterion of homoskedasticity about a mean, is not an honest representation unless there is an explicit disavowal of physical meaning.
You know Brohan and the related work very well. Has there ever been a caveat about the lack of any physical meaning in local monthly, or globally, averaged temperatures?
If not, then in terms of systematic error, a per day uncertainty in a physical quantity (0.2 C per reading) of a physically unique data point cannot be reduced to a physical uncertainty of 0.03 C merely by taking a mean of the points. The mean carries its own statistical uncertainty, but the physical uncertainty of the original data has to be calculated separately and included in any discussion of significance.
If observation at time=i is
and we are interested of , and
, and  are independent of
  , we do not need to care whether
  is constant or not. That was the main point in #146, to avoid confusion, as you wrote
—
Actually we are interested of , and average of daily mid-ranges is used to estimate that (as per steven’s #147). To keep focus on instrumental errors, we can forget the sampling error
  , (here T_i is mid-range of day i) for now. If instrumental errors are uncorrelated, as Brohan’s text implies, then we need to know sampling rate before we can estimate instrumental error in the monthly mean. If the instrumental errors are more bias-like, as I suggest, then the error after averaging remains the same, 0.2 C.
Existence of is more related to sampling errors than instrumental errors. But, if we can find a temperature chamber that can keep a constant temperature (say, absolutely within 0.001 K ), let’s put a thermometer there for a month, compute average of daily mid-ranges, and see whether 0.2 or 0.03 K is closer to truth. If this kind of experiment cannot be done, then the unphysical-card can be played.
I just wrote this b+n, I see no problems in considering bias-like errors as stochastic.
Re: #146
I like these discussions where one must give a little more thought to a situation, that on the surface appears straight forward, before jumping to conclusions. I think I understand what UC is saying is the general cases and the assumptions. I would intuitively think that 0.03 would be the extreme case for minimum variation while Pat’s 0.2 would be the extreme case of maximum variation. My questioned would be: how does one go about determining (through statistical analyses and/or a prior reasoning) that the assumptions are correct or not?
I would think that T for most months in most climates (or, at least, the Midwest, where I have made some of these calculations in reply to my son’s queries) are going to be correlated and not follow a normal distribution. I would guess that the variances will change during some months also and put doubt that T is homoscedastic. Of course, if n can be shown to be independent of T then one, I guess, has to concentrate on the characteristics of n on its own merits. Where I am not connecting is if n includes both the sampling and measurement error it would not be independent of T because of the sampling part. The independency of the measurement error from T would be reasoned how?
I’ve not surveyed it in detail yet, just searched the text and scanned the uncertainty models, but it presently looks to me like there isn’t a word about instrumental accuracy in Brohan 2006.
What’s happened to this thread? About 20 posts have disappeared.
Steve: Moved OT discussion of average temperature to Unthreaded.
re 148, sweater mode, threads get unwound sometimes.
The Team comments on this page are apparently in one of the CRU emails 1212063122.txt
Of course there are other unrelated phrases of interest in the exchange.
It just goes to show they’ve got their finger on the pulse at CA. Steve posts, and Phil and Mann are on it within a day. It’s just like Gavin and the “Mystery Man.”
Of course the Team reads CA – how else will they learn about the mistakes in the papers their hand-selected peer-reviewers missed?
How many Corregendums have been fueled by errors uncovered by CA?
I don’t understand what ships used the bucket SST.
all the ship i was on in the US navy just did intake temps.1970-4
These were hourly on all engine cooling water intakes.
for the minesweeper i was on there were 7 cooling water intakes for the 4 main engines and 3 electrical generators.
None were calibrated and none were taken very well.
These went on a engine room report and was turned in daily.
The officer that did the daily the metdata report would have just picked the
intake temps and used them on the metadata report as daily or hourly.
The draft of the sweep i was on was about 5 foot so it was near surface temps.
I wonder how many reading the researchers thought were bucket were really intake reading.
Did these ships note on there reports that there reading were bucket or intake.
Or are these researcher just believe them to be bucket because they were told (By someone that was not there and did not know how the reading were taken) that they were all bucket.
The bucket problem has been researched since at least 1995!!!!!!!!!!!!!!!!!!!!!!!!!!!
Alleged CRU Email – 1212276269.txt
of data switched from European fleets to almost exclusively US fleets (and
who tended to use engine inlet temperatures rather than canvas buckets).
This offset was large and dramatic and was identified more than ten years
ago from comparisons of simultaneous measurements of night-time marine air
temperatures (NMAT) which did not show such a shift. The experimentally
based adjustment to account for the canvas bucket cooling brought the sea
surface temperatures much more into line with the NMAT series (Folland and
Parker, 1995). (Note that this reduced the 20th Century trends in SST).
More recent work (for instance, at this workshop in 2005), has focussed on
refining the estimates and incorporating new sources of data. For
instance, the 1941 shift in the original corrections, was reduced and
pushed back to 1939 with the addition of substantial and dominant amounts
of US Merchant Marine data (which mostly used engine inlets temperatures).
The version of the data that is currently used in most temperature
reconstructions is based on the work of Rayner and colleagues (reported in
2006). In their discussion of remaining issues they state:
Using metadata in the ICOADS it is possible to compare the
contributions made by different countries to the marine component of the
global temperature curve. Different countries give different advice to
their observing fleets concerning how best to measure SST. Breaking the
data up into separate countries’ contributions shows that the assumption
7 Trackbacks
[…] may also be interested in reading Climate Audit’s take on this issue. They’ve blogged about the likely bias in sea surface temperature […]
[…] in the side of the climate-science establishment, has been on to this anomaly for some time. (See “Nature ‘Discovers’ Another Climate Audit Finding”.) The article in Nature does not cite him. Despite the evident diligence and seriousness of his […]
[…] http://www.climateaudit.org/?p=3114 […]
[…] blog has been a terrific stimulus to zillions of its readers, including me. Back in May 2008, Steve posted on Nature’s “discovery” of the bucket-adjustment discontinuity in the Sea Surface Temperature […]
[…] main IPCC finding on attribution to, well, not very much. While wiser heads counselled patience, Steve McIntyre predicted that the 1950 to 2000 global temperature trends would be reduced by half while Roger […]
[…] the CA post, I referred to the discussions the previous year and showed the illustration under “Carl […]
[…] – May 2008): see current discussion here and Dec 2007 post […]