While there are disappointingly few high-resolution alkenone ocean cores with 20th century resolution, there are a few. Given the importance of this class of proxy in Marcott et al, one would have thought the performance of high-resolution alkenones in the 20th century would have been of interest to Marcott et al, but they were silent on the topic.
Before Climategate, I’d considered high-resolution ocean cores from time to time at Climate Audit (see alkenone tag). In 2007, I reported on a very high-resolution alkenone series offshore Morocco (about 30N) by Helen McGregor (see here and here). This dataset had a serious divergence problem, i.e. the water was getting colder. McGregor worried that fish in the area might need swimming lessons to cope with the rapid change.
McGregor’s series was cited in Leduc et al (2010), a specialist presentation of another high-resolution alkenone series (GeoB8331, GeoB 8331) taken in the Benguela upwelling zone offshore Nambia at about 30S. Like McGregor, they also found sharply cooler SST in late 20th century as measured by well dated alkenone data, indicating that the alkenone divergence problem was not unique to McGregor’s site:

Figure 1. From Leduc et al 2010.
The closest Marcott series to McGregor’s Morocco series was the Iberian Margin (#51) D13822 alkenone series (Abrantes et al.) The graphic below compares the two series: the shorter (warmer) high-resolution McGregor series in red and the longer series used by Marcott in black. The green “rug” marks at top are D13822 radiocarbon dates.

The next graphic shows the modern portion of these two series, both offset to facilitate comparison. In this graphic, I’ve both the published and Marcott dates for the Iberian Margin series, together with the high-resolution McGregor series. All show very pronounced closing downticks, with the well-dated McGregor series placing the Morocco decline in the 20th century and even the last half of the 20th century, Marcott dating the decline in the Iberian Margin to the 19th century (with a dating error of 100-150 years) and Rodrigues et al dating the decline to the 15th century. An obvious question is whether the downturns in the Iberian Margin and Morocco series are contemporary or phased. (Note that the removal of D13822 after the late 19th century contributed to the Marcott 20th century uptick.)

Both sites are very high accumulation. McGregor’s box core GeoB6008-1 accumulated 32 cm in less than a century (1912-1998), while the Iberian margin D13822 is estimated to have accumulated about 25 cm per century (this is about 20 times higher than many cores.) The top sample for D13822 is at 10 cm and dated 57BP by Marcott and 442 BP in the original publication (which I haven’t seen yet.) The closest radiocarbon date is at 257 cm (calibrated 1511 BP) i.e. not closely dated. For comparison, the 10 cm sample in closely-dated GeoB6008-1 is dated to 1981AD and to 1947AD in GeoB6008-2.
Trouet et al 2009
As an amusing sidebar, we also discussed the McGregor alkenone series as it was used in a multiproxy study by Trouet et al 2009 – see CA discussion here. Trouet “solved” the divergence problem in best Mann et al 2008 style: by turning the series upside down. The red series labelled “Cape Ghir” and going sharply upward in the excerpt from Trouet et al 2009 is the McGregor alkenone series with sharply colder temperatures.
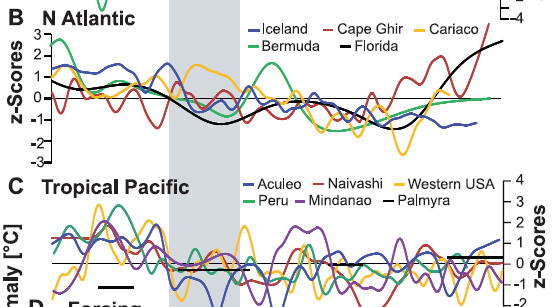
Excerpt from Trouet et al 2009.
The practice of multiproxy authors turning indicators of cold SST upside down had been previously criticized at CA in connection with Moberg et al 2005, which used a proxy series showing increased presence of coldwater (polar) foraminifera (% G Bulloides) in the Arabian Sea as one of their most potent indicators of global warming.
The closest Marcott series to the Leduc et al 2010 Benguela series shown above is Farmer’s ODP1084B (also used in Loehle and McCulloch and discussed in Schmidt’s critique of Loehle and McCulloch.) I’ll discuss this interesting downspike on another occasions.
In general, 20th century downspikes in high-resolution alkenone series seem to be the rule, rather than the exception – a divergence problem that is not discussed in the multiproxy studies. The most plausible reason is that high-resolution in the 20th century requires high-resolution, which requires high biological productivity, which, in turn, is most characteristic of upwelling zones. Increased upwelling in upwelling zones seems to be a rather pronounced in the 20th century. This is not inconsistent with overall warming, but neither is it an issue that multiproxy jockeys can simply brush aside.


33 Comments
can be due to depletion of fish stocks, run-off of fertilizers, atmospheric deposition of nitrogen, etc etc etc
could be. However, the specialist literature seems to believe that there has been an actual increase in upwelling in the 20th century.
If published cores have been selected (intentionally or not) for high resolution in the 20th century, then such a selection bias might produce results that seemed to indicate an actual increase in upwelling.
Steve: Upwelling must come from somewhere. If the upwelling is coming from deep-water, then increased upwelling must be associated with increased deep-water formation in the Arctic and Antarctic and poleward transport of surface water. An alternative hypothesis is that the location of upwelling changes with changes in winds and currents. Cores from a few sites presumably can’t distinguish between these alternative hypotheses. Do the specialists you mention have enough data to choose between these two hypotheses?
Steve: documenting the ocean core is a big enough job for one paper.
Given an increasingly energetic climate system, I can easily imagine the coriolis corkscrewing of the ocean expanding poleward.
A couple of years ago I created a couple of plots derived from ARGO gridded data that might be of interest. The first was an image plot of the mean temperature by latitude and depth (i.e. longitude averaged out). More precisely this was the percentile rank of the mean temperature for each depth level. The coriolis effect was evident:
The second plot showed the temperature trend by latitude at depth:
Granted this was only 6yrs of data, but I can see how an increasingly energetic system might produce variable temperature effects by location.
I also agree with Richard Tol’s speculations as well.
Re: Richard S.J. Tol (Apr 9 12:35),
In which case, you would presumably discourage Trouet et al’s use of the Cape Ghir series either upside-up or Mannian upside-down?
Never throw away data. Model the confounding factors instead.
often one wants to make a geophysical map in which you have two or more partly overlapping surveys of differing quality, in which the lower quality survey covers some area not covered by the better quality survey. The usual practice is to benchmark the lower quality survey against the higher quality survey and use the lower quality survey only in those areas where the better survey doesn’t provide data.
To that extent, one is excluding data and with reason.
If the thermometer readings are going down due to global warming, then I don’t see why proxies getting “colder” shouldn’t be highly indicative of global warming. Here in the UK the thermometers are reading unusually low values, due to warming. Apparently.
upwelling zones typically have very sharp temperature gradients. Slight movements of the upwelling zone could presumably result in apparent temperature changes.
Cape Ghir (or Cape Rhir) would seem to be an extraordinarily bad place for a paleotemperature proxy. There is a very marked narrow upwelling zone right at the coastline (known as the Cape Rhir filament) which is likely very sensitive to changes in winds and currents. This is part of the much larger upwelling area between Morocco and the Canaries.
By the way Cape Rhir is famous among bird-watchers since the cold nutrient-rich waters attracts pelagic and boreal seabirds close inshore. I’ve even seen razorbills there, hardly a species one considers typical of a desert coast on the edge of the Sahara.
Steve: nice point. It seems to me that a number of the ocean core proxies are taken in areas with very high lateral temperature gradients, making the proxy temperature sensitive to lateral fluctuations. The Peru alkenone series has very high lateral temperature gradients as well.
I am reading this as something of a tautology: “The most plausible reason is that high-resolution in the 20th century requires high-resolution, which…” So I am confused. Can you un-confuse me? If you please.
Confounding factors are…confounding. A good scientist is always looking out for ways he might be fooled (or be fooling himself)–to paraphrase Feynman. Papering over a confounding factor is called an assumption. Like breeding white mice to be as uniform as possible and not realizing they have become far more likely to get cancer than normal mice.
When an assumption is shown to be wrong, it is incumbent on a field of science to revise their work. For example, if bristlecones showing rapid growth in the past 100 yrs are damaged (strip bark) and those not strip-barked do not show such growth, this is a violation of the assumption that the tree growth reflects climate alone. If Tiljander sediments are known to be affected by road construction after a certain date, then this violates the assumption that the sediment is an indicator of climate alone. It is not difficult to be unaware of a violation of an assumption, but when it is publicly pointed out and shown to overturn a certain result, it is unconscionable to carry on regardless.
In the case here, if alkenones in these diverging locations reflect SST then fine, but you can’t just drop inconvenient recent decades. You can’t say D13822 looks great for 10,000yr and then decide the recent years are wrong because you just know they are wrong.
If they reflect changes in upwelling locations, then you better verify that and not call them temperature proxies.
Seems to me that if you do not know how to account for upwelling then using proxies from such areas is simply daft. It all reminds me of that New Yorker cartoon of the drunk looking for his lost car keys under the street light because that is where he could see. Josh?
Re: bernie1815 (Apr 9 14:39),
As I struggle to learn, your comment reflects one of the things that keeps me confused and struggling.
I don’t understand how proxies, that could be affected by any number of real physical influences, can provide anything of use until such time as those other influences can be isolated, fully described and quantified – especially when dealing with historical measurements where we have even less knowledge and understanding of the real physical influences that may have been present during that time period.
What am I missing in my understanding of proxies?
Jan: You are correct.
You are missing one thing, and that is that these proxies are the only game in town for paleo reconstructions. So individuals motivated by science or politics are going to turn to them to gather what they might.
As a scientific exercise, I think it is perfectly valid to say that this type of proxy has evidence that it responds in some ways to temperature, rainfall, upwelling, etc. Then do an exercise in which you see how the proxy(s) look over time. You might be able to link certain proxies to known discreet events like treeline advance and wonder if in some way the proxy is reflecting relatively warmer or cooler temps in a paleo period.
What you are never going to get a temperature reconstruction.
The only exception would be if a new proxy type could be measured in both the modern and paleo period AND show near absolute connection to temp throughout the modern period. Which is why the ‘divergences’ absolutely kill proxies for paleo temperature reconstructions.
Thank you. I’ll keep trying to learn.
Others address “alkanone divergence”. e.g. Ho et al. 2012.
Maybe the only confounding factor is that they don’t measure temperature?
Can someone explain to a layperson like myself why they would turn datasets upside down?
Andrew S.
See “Confirmation bias”
e.g., “we know that it is warming” – therefore data showing cooling “must be upside down.”
Actually, the algorithm turns the data upside down and the scientist shrugs. The secret is to let the algorithm find any trends that follow your temperature trend and then generate a multiproxy curve from all the matches. If the physical basis of the proxy happens to indicate cooling rather than warming…well, what’s a harried, overworked climate scientist supposed to do, go read all the background literature? Jeez, some of that stuff is only on paper!
Matt Skaggs
Good distinction on “the algorithm did it”.
Andrew S.
See further discussion in CA posts on upside down algorithm or <a href=https://climateaudit.org/?s=upside+downupside down
Hi Steve —
In your third graph (Marcott’s D13822, D13822, GeoB6008) it’s very hard to tell which black line is which without referring back to the text. Given the short segments, it’s hard tell a dash from a line. Maybe a 3rd color would help?
Also, I think when the text says “both offset to facilitate comparision” that you are referring only to the temperature recentering. But since the redating can also be considered an offset of sorts, it would be good to be explicit what’s meant.
Thanks for the articles, and wonderful work.
‘neither is it an issue that multiproxy jockeys can simply brush aside”
More like “sweep under the carpet”. Great work Steve.
FYI. I am an Oregon State alum. I offered the College of Earth, Oceanic and Atmospheric Sciences funding for Steve McIntyre to give a lecture/seminar on Hocket Sticks and Proxies. The faculty was not interested. “They only have seminars on scientific and technical topics of interest to the faculty.”
Steve: I had already surmised from Marcott et al that the faculty at Oregon State were uninterested in problems related to proxy reconstructions.
The Dean of the College reacted quite negatively when I suggested that the faculty was not interested in scientific debate. As near as I can tell (and this is a guess), the faculty feel Steve is not a real scientist and does not have standing to critique the technical and scientific elements of academic research. The Dean seemed to feel Steve’s perspective was political….as opposed scientific and technical. But that is reading between the lines before the Dean closed off discussions with me.
The Chair of the OSU Statistics Department declined as well.
Re: kellyhaughton (Apr 9 15:05),
What’s funny/sad is that Steve’s politics (which are kept out of this blog, along with religion topics) are most likely in agreement with theirs. This doesn’t have to be a political issue at all.
One of the predicted effects of AGW is the shut-down of the gulf stream coming out of the Carribean heading up the east coast of the US and Canada on in to NW Europe, making England and Scandinavia much warmer than their latitude would indicate. A weaker gulf stream would let colder water predominate in that region, thus colder than “normal” temperatures, and this would be indicated in several proxies, including I think the Alkenones. Nothing wrong with this at all. Higher land temperatures in the US could be matched by cooler ocean temperatures off of the east coast. The kicker is that, the same thing could have happened 5k, 10k yrs ago too. Cool ocean temps as indicated by alkenones in the past (especially if associated with high land temperatures) might indicate higher land temperatures back then too. A yardstick can be used from both ends.
There are sizes involved with upwelling:
Spread them out, and point temp-drops are telling
When did this happen last?
Many times in the past?
Doesn’t matter, if it fits what they’re selling.
===|==============/ Keith DeHavelle
Keith:
What they are selling is what the NSF is buying.
Efficient markets theorem?
It’s undoubtedly just a coincidence that the steep decline in this proxy occurs at the same time the treemometers turned renegade and had to be hidden from impressionable eyes.
2 Trackbacks
[…] un artefact dû au recentrage) Clearly distinguished le 07/04/2013 (Distinction claire) Alkenone Divergence le 09/04/2013 (La divergence des alkénones) Alkenone Divergence in Peru le 09/04/2013 […]
[…] unless otherwise stated. This is a commonly used assumption, but is not always appropriate). McIntyre’s concerns about 20th Century patterns in the alkenone records used in Marcott et al are more […]