Gutierrez et al (GRL 2011) pdf here; data here is another very high resolution alkenone series that is well-dated in the 20th century. It was taken in an upwelling zone offshore Peru at a similar latitude to Quelccaya.
Like the high-resolution series offshore Morocco and Namibia, it shows a sharp decline in alkenone-estimated SST in the 20th century, as illustated below. (The archived data has a little more coverage -back to ~1750.)

Excerpt from Gutierrez at al 2011.
The authors survey temperature data at nearby stations (Callao, Pisco and a few others) and report slight cooling in the late 20th century. They suggest “ERA 40 reanalysis indicates its link [cooling] with intensified alongshore winds driving upwelling in spring”.
The closest Marcott proxy is GeoB7139-2, taken offshore Chile at approximately 30S. (A closer comparison would be nice.) This proxy is shown below. It only has two radiocarbon dates in the entire Holocene and only has resolution of ~520 years. (Stated data selection criteria are that “at least four age-control points span or closely bracket the full measured interval” and “sampling resolution is typically better than ~300 yr”.
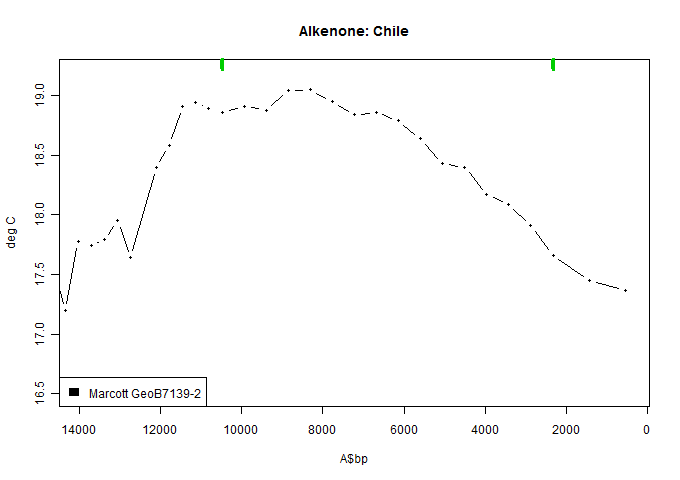
Figure 2. GeoB 7139-2 per Marcott.
The next graphic shows GeoB7139-2 together with B0604 (the latter offset by 4 deg C).
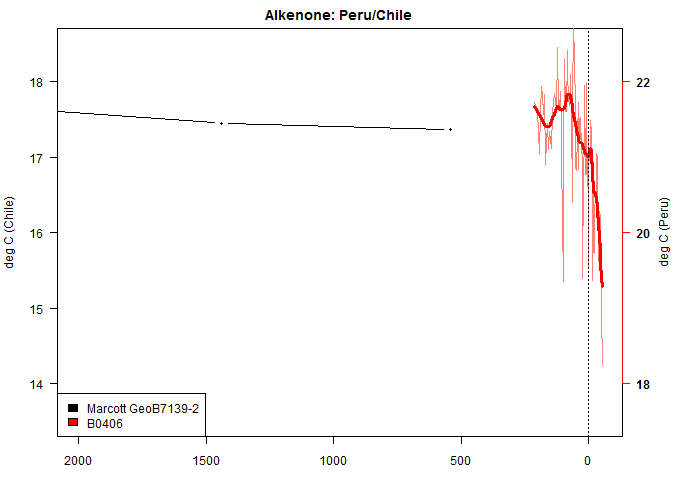
Figure 3. B0604 (offset 4 deg C) and GeoB7139-2.
Although we’ve been reassured by Marcott apologists of the ability of their data and method to capture any past upspike, one feels that this particular series will not be much help in that enterprise.
In Lonnie Thompson’s recent Quelccaya publication, Thompson estimated Nino3-4 SST. Needless to say, they don’t bear much similarity to the alkenone SSTs shown here.
Stepping back from Marcott, increased upwelling in the late 20th century seems to have occurred all over the globe. In addition to the upwelling sites surveyed here in the last couple of days (Morocco, Namibia, Peru), I’ve also seen 20th century declines in alkenone data offshore Iceland and, of course, in the two Marcott series where the decline was deleted: MD03-2421 offshore Japan and OCE326-GGC offshore eastern Canada, both of which I’ll now reconsider with this in mind.


33 Comments
It seems to me rather strange
With the known deposition-rate change
Alkenones are high-rated
Yet so vaguely dated
In Marcott et al.’s narrow range
===|==============/ Keith DeHavelle
I am totally bewildered. What is the upshot of all this? Are all these cores as worthless as these seem to be? If they can’t capture this century’s temperatures, why would anyone believe them for any other? And do all of them have downswings like this – wouldn’t it make more sense to find some explanation why the top three feet of core is contaminated by air or not compacted yet or something?
Do people really do this for a living? It seems insane.
“Are all these cores as worthless as these seem to be?”
That is going too far. Alkenone temperature proxies clearly show the waxing and waning of the ice ages. Like tree rings, though, they are subject to lots of noise and error, so extra caution is advised in combining them. I suspect that the experienced researchers in the field might be a bit too wise to try what Marcott did.
“The divergence” is a little to terse for me.
Do they merely diverge from the Global Mean Surface Temperature as gathered from the surface stations? (Or land/sea, SST, or whatever.)
Or do they also diverge from the closest physical thermometer?
And … how badly?
I do recognize the apples-to-oranges aspect, but that is also precisely the selection criteria, no?
There’s a gadget here which lets you look at maps of trends of stations over various periods of time. I’ve put a snapshot here of Peru and E Pacific over last 50 years. Mostly warming, nothing spectacular.
I took a look at the map, and about all I could conclude is that the data is hopelessly undersampled. In the time domain this is called aliasing, and a quick check of wiki confirms that it is called spatial aliasing as well. Bottom line is that you can learn very little by connecting the dots … even with some computer algorithms to help fill in the blank spaces.
Bob Stewart,
“I took a look at the map, and about all I could conclude is that the data is hopelessly undersampled.”
I think SST is fairly good, and that’s what’s needed here. Yes, Amazonian S Am is poorly covered in GHCN. I’ve put another shot here, this time of last 25 years, and with stations dotted. There has been strong SE Pacific SST cooling over that shorter period.
Oops, that’s the old one. 25 years is here.
Number of observations in GHCNv2 from Peru over time
Monthly temperature series for Callao in GHCNv2
Monthly temperature series for Pisco in GHCNv2
While those global color smear graphs might look cool, I prefer to look at actual data points.
Now, obviously, I haven’t updated those figures for a while now … I should probably check if they filled some of the gaps in GHCNv3. But, those primitive charts do show how many data points there are and how temperature varies at each station location by season and over the years. Clearly, those two locations have more data then does <a href="http://climate.unur.com/ghcn-v2/309/84444.html"?Chachapoyas.
Re: “intensified alongshore winds driving upwelling in spring”.
Roy Spencer (April 8th, 2013) shows winds declining since 2003.
Cardone & Greenwood, On Trends in Historical Marine Wind Data, correct for anemometer height to find a small increasing trend since 1950 but caution “The most likely explanation is the absence of universal standards for sea state and Beaufort force before 1946.”
The last sentence in the Cardone and Greenwood paper reads: ‘Though this cautionary tale does not rule out the existence of real trends in surface winds, it does impugn their delectability.’ Which is a nice turn of phrase.
In the figure Alkenone: Peru/Chile the series is BO406 but outside BO604.
I find your comment that upwelling has been increasing all over the globe very interesting. I believe that the Pacific Ocean’s deep transit time is on the order of a millenia. Could this water be bringing CO2 from the mideval warm period back to the surface and thence to the atmosphere? And might this contribute to the increase we see in CO2?
I’ve never been convinced by any of the mass balance summaries I’ve seen because of questions like this. In fact, it seems as though it is implicitly assumed that the inputs and outputs were equal prior to the industrial age. But the total input of CO2 from industrial sources is of the same order of magnitude as the errors in estimating the much larger and numerous natural sources and sinks. Is it preposterous to think that natural sources might be contributing increased CO2 inputs as well as the anthropogenic increase?
O/T, but I just saw this, Steve.
Watches
City of Toronto
4:27 PM EDT Tuesday 09 April 2013
Winter storm watch for
City of Toronto issued
Ice pellets and freezing rain likely Thursday.
A series of low pressure systems will give periods of rain to the regions into Wednesday night. On Thursday, a stronger low will arrive from the southwest and combine with a colder airmass from the north. As a result rain is expected to change to ice pellets and freezing rain Thursday morning. The ice pellets and freezing rain are expected to persist through Thursday night and be heavy at times.
Poor travel conditions are expected Thursday. In some places, power outages may occur. Conditions are expected to improve Friday.
There is still some uncertainty as to the track of the storm and the extent of the cold air Thursday. Environment Canada will monitor this situation closely and will issue warnings as needed as the track of the storm becomes more certain.
————————————–
Sounds like you are having a long and miserable winter, Steve – and from your past posts, I gather that this sort of weather doesn’t agree with you.
At least the days are getting longer, although it might be hard to discern from under the clouds. Hope the sun comes out in Toronto soon!
This is fairly normal for Toronto, at least prior to to previous decade it was fairly normal for April.
A little ways from Toronto, CA, in a small town called Ithaca, NY, I experienced snow (not much accumulation, but, still), on May 15, 1993. That was after the end of my first academic year in the U.S.
For a few years after that, I would get into bets with people about whether it would snow around Mothers’ Day. If I remember correctly, I won more than a lost.
Of course, I meant Toronto, ON — I guess I have CA on my mind 😉
Oh, California… I thought you meant Toronto, Climate Audit. 😉
IIRC, I saw snow in Ithaca on May 6, 1976. It was the last gasp of a very brutal winter.
Steve: winter 1976-77 was very cold. National Geographic did a feature on it. I took a job in Ottawa starting in December 1976. My car froze solid the first night. Learned about block heaters, which weren’t needed in Toronto. But retrospectively Dec 1976 was cold even for Ottawa.
RE:”A little ways from Toronto, CA, in a small town called Ithaca, NY, I experienced snow . . .”
I live just outside of TO but some years ago I had a job to restore one of Ithaca’s classic fraternity ‘Delta’ houses for resale. The weather hole you’re under is something I’ve never experienced outside of the Caribbean. Within minutes it went from sunny and clear to torrential downpour. Or from super storm to nice day within 15 minutes. Local weather forecasts were all but worthless. And from what I recall the local radio had a ‘groundhog day’ thing going on IE: same play list and news reports one day after the next.
All in all tho, a very nice town. Locals made us feel welcome. Thank you.
-barn
Re: barn E. rubble (Apr 10 20:53),
We get that in Colorado. Our first Memorial Day here (end of May) we had snow, hail, big thunder/lightning rain, and beautiful warm sunshine, all in one afternoon. Made the neighborhood picnic a bit unusual 🙂
In the graphs above, I noticed that ICOADS closely resembles the PDO index. The older ICOADS data was never intended to be used for historical purposes, just current use for ship masters (ballpark stuff). Color me surprised.
I also found the upwelling comment interesting. Is an upwelling environment a representative environment for a temperature proxy? I’m happy to accept that the alkenone’s are a temperature proxy, but are they representative?
Taking an extreme analogy, active volcanoes are distributed across the globe, but taking sample temperatures from active volcanoes is not going to be representative of global or even regional temperatures.
Is this a case of a possible selection bias, in that the best alkenone cores are from upwelling areas, which are in an exceptional environment. It would be like finding a proxy where the best samples are from the middle of active volcanoes… not exactly providing representative temperatures.
Upwelling areas in oceans are generally richer in nutrients. Perhaps this contributes to the shoals of alkenone that have better annual resolutions.
“Shoals of Alkenone” sounds like it should be a Muse song.
I thought the upwelling along the coastline of Peru had more to do with the Humboldt current and the coriolis effect of the Earth’s rotation than with local winds. I could see the local winds disturbing the surface of the water but not causing deep upwelling.
It’s the change in the direction of winds in the equatorial mid-Pacific that slow the whole south Pacific gyre and thereby the Humbolt current reducing the upwelling that produces the effect known locally as el Nino.
Below is a thorough summary of alkenone temperature proxies. In the conclusions, it is cautioned that
The behavior of alkenones as fine-grained particles may cause more significant
problems for the proxy than does the calibration uncertainty. Recent evidence for
advection of alkenones by deep currents (Benthien and Muller, 2000;Ohkouchi
et al., 2002), suggests that paleoceanographers ignore sedimentology at their peril.
Click to access Herbert_AlkReview_Treatise%2701.pdf
Ruh Roh.
Slightly OT perhaps,, but… some “meta” questions on proxy reconstructions (based on my ignorance, I am sure):
i) I often see the relationship between the proxy “signal” and T expressed as a linear function.
– What is the physics behind this assumption?
– In fact, why would any proxy have this behavior?
ii) Doesn’t the sampling theorem apply somehow for proxy reconstructions?
– If the sampling interval is 300 years, then the fastest T variation that can be detected would be double that, i.e. 600 years.
– Or can statics somehow override the sampling theorem?
(If there are some suitable links, I would very much appreciate them.)
Thanks,
/Johan
Johan – Excellent questions, which would get you banned at some sites…
– What is the physics behind the assumption of a linear relationship?
It depends on the individual proxy. The justification can range from pretty good to non-existent (unless you consider “it makes the math easier” a valid justification).
Some have been reasonably calibrated in recent years against measured temperatures, with a fairly linear relationship established during this period, and a theoretical underpinning posited that would explain this relationship. From what I can tell, this is about as good as it gets. I have not seen any cases where controlled laboratory experiments could provide adequate information for what happens in the complexity of the real world.
– Why would any proxy have this behavior?
Sometimes the linearity assumption is justified as a localized approximation of the real function — i.e. the tangent to the curve.
– Doesn’t the [Nyquist] sampling theorem apply somehow for proxy reconstructions?
Yes, but you have to be careful how you apply it. Strictly speaking, the Nyquist sampling theorem applies to a repetitive signal of effectively infinite length (or a least far longer than the sampling interval), and it talks about frequency components of the signal, not periods within the signal.
Tamino on the Open Mind blog recently pointed out that spikes of 150 years up and 150 years down could make it through the sampling process, because they do have low-frequency components that would not be missed by the sampling. (However, rather than apply these artificial spikes to the “input” of the proxy process, with all of its noise, low-pass filtering, and time uncertainity, he applied them to the “output”, which makes his conclusions completely invalid.)
As with many proxy studies, Marcott uses proxies of many different sampling intervals, with a mean of 160 years, a median of 120 years, and a minimum of 20 years. Depending on the processes used to combine these, many conclusions are possible. From what I can tell, all of the conclusions about recent changes are based on proxies with 20-year intervals, which in theory could detect higher-frequency components. If this is so, comparisons of recent trends to the center of the history, which has significant contributions from longer-interval samples, is invalid on this ground alone, even if everything else were done right.
Thanks Curt.
I would guess that for proxy sampling points within the instrumental record era some sort of checks of the linear relationship can be done. However, since all temperatures are local, that could only be done if the proxy and the thermometers are “nearby” in some intelligent sense. But what about proxies “measuring” earlier time periods?
As for the samplng theorem, yes, it says that the sampling frequencey has to be at least twice that of the max frequency you’re looking for, i.e. you will not be able to detect/reconstruct any higher frequencies.
So if you sample with 1/300 years, then the highest frequency you will be able to detect is 1/600. In other words, if you have a proxy with 300 year resolution, then only temperature variations with a time period of 600 years or longer can be detected.
Has signal processing and sampling theory related methodologies been applied to proxy reconstructions somewhere?
Does anyone have a tally of the Marcott et al proxies that do not meet their selection criteria?
Lonnie Thompson just published his Quelccaya ice cap data
http://www.sciencemag.org/content/340/6135/945.abstract
2 Trackbacks
[…] [update] A relevant post by Steve Mcintyre is here.[/update] […]
[…] le 07/04/2013 (Distinction claire) Alkenone Divergence le 09/04/2013 (La divergence des alkénones) Alkenone Divergence in Peru le 09/04/2013 (Divergence des […]