The longest very high-resolution alkenone core that I’m aware of is Sicre et al’s MD99-2275 (plus splices) from offshore Iceland (67N 18W). It is 4550 years long, its most recent value is 2001AD and its resolution is 4 years. Marcott used nearby core JR51GC-35 (also at 67N 18W), also an alkenone record, which had a resolution of 110 years and a most recent Marcott date of 1836AD.
Here is how the two series compare over the 4500 years covered by the Sicre et al record (originally published in 2008, but updated in 2012). (The NOAA archive is unfortunately inadequate as it does not include depth or identify splice points.)

Figure 1. 67N 18W Offshore Iceland. Comparison of Marcott et al series to high-resolution series.
Taking a longer view, here are the two series compared over the Holocene.

Figure 2. 67N 18W Offshore Iceland. Comparison of Marcott et al series to high-resolution series.
Finally, here’s a zoom into the modern period.

Figure 3. As above. Zoom in.
In geophysical surveying, one tries to use the best quality surveys where available and benchmark lower quality surveys against the highest quality ones. If this methodology were used here, the errors in JR51GC-35 are obviously very large, much higher than arising from the alkenone calibration equation by itself, though other factors could be at work as well.
MD99-2275 has well-dated core going deep into the Holocene. Hopefully, Sicre and other specialists will continue their commendable program. Seeing if these results can be replicated in another core would also do much to increase confidence.
The alkenone divergence problem is clearly present in this data. ALkenone-estimated temperatures in the 20th century continued to decline. In the Marcott reconstruction, JR51GC-35 makes its last (very negative) contribution in the 1820 step. By the act of no longer participating, it causes the Marcott composite to go up in the next period, even though it appears that the “true” alkenone estimated temperature in the area continues to decline.
Postscript: I mentioned MD99-2275 as a high-resolution core in my notes on AGU 2006. Like McGregor’s Cape Ghir (used inverted), it was one of the proxies in Trouet et al 2009 discussed at CA here. Here is a figure showing the updated Sicre version against the Trouet et al illustration. The Sicre version is in cyan (versus the “Iceland” series in blue). The divergence in the present series continues further than in the Trouet version.
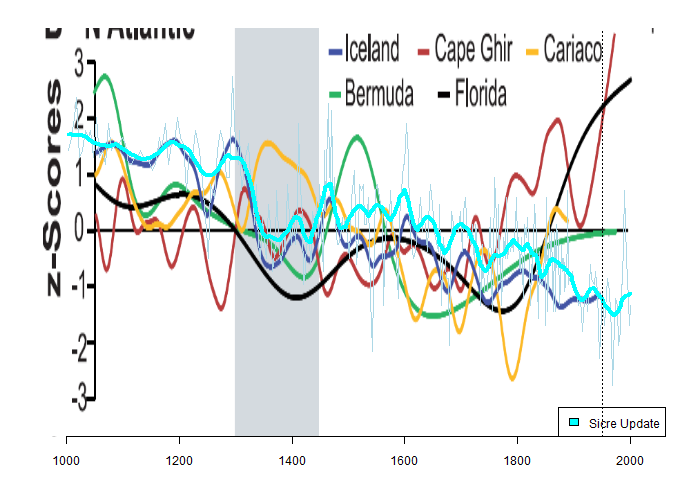
Figure 4. Excerpt from Trouet et al 2009, showing updated Sicre et al series.


18 Comments
Very interesting for this debate. I have a question. Why the long-term downtrend in this measure? If it is a valid temperature proxy, then it suggests continued decline in temperature in the 20th century and after. could it be that the calibration is not correct, say due to lack of knowledge of how layers are compressed over time?
See Steve’s earlier posts on this.
I’ve not kept up to date with temperature determination using alkenones. If I had these data sets, all showing a rapid fall off in temperature towards the topmost parts of the core I’d start asking questions about the stability of these unsaturated ketones during the initial phases of burial. It may be they undergo a rapid diagenetic alteration after which they become much more stable. Perhaps someone with expereince of these proxies could comment.
222 citations to Jones et al. 2009 review of High-resolution palaeoclimatology of the last millennium
Paul, they seem to have become very popular. It’s my understanding that they’ve been benchmarked against modern sediments at a variety of latitudes with good relationship, as these things go.
In the upwelling zones, the specialists seem to think that there has been an increase in upwelling and that the phenomenon is not diagenetic. Because of the very high lateral gradients in these zones, a rather small change in upwelling area could explain the phenomenon.
The offshore iceland has a decline, but it’s different looking: more a continuation of the secular decline, rather than the sharp downtick of the upwelling zones.
Steve, your suggestion of small changes in the area and location of upwelling areas as an explanation of the decline in alkenone derived temperatures is certainly possible, and could well account for the observations. There’s no doubt that core top studies relating U37k to local sea surface temperature, and other studies that show strong latitudinal dependence of U37k suggest that the modern alkenones contain a temperature signal. However, this does not preclude a degree of degradation during early diagenesis within the sediment that results in small and consistent apparent temperature shifts. I’m thinking of something akin to chiral racemisation in amino-acids. Of course degradation is different to racemisation.
It would be worth comparing foram d18O signatures from the same depths with the alkenone data for some of these cores.
Steve, you and Nic Lewis and others need to use this data, submit a paper of your own with better and more complete data. Harder for the IPCC to ignore this obvious issue, then.
On the lighter side: there is precedent, is there not, for Marcott and sidekicks to head up the IPCC panel that reviews these types of temperature proxies?
First tree rings (“hide the decline”), and now alkenones–what is it with these proxies that have all suddenly just started tailing off recently, as the temperature has increased? It’s almost as if the relationship between these “proxies” and temperature is far too complex and ill-understood for anybody to be able to extract convincing reconstructions–let alone predictive models–from them…
Possibly the simplest answer is also the best answer: it could very well be the case that organic phytoplankton residue doesn’t produce reliable thermometers.
Steve:
Are you suggesting that if Marcott et al had chosen different or additional proxies their conclusion may have been different or, at least, more nuanced?
Dan Posted Apr 10, 2013 at 12:50 PM
First tree rings (“hide the decline”), and now alkenones–what is it with these proxies that have all suddenly just started tailing off recently, as the temperature has increased? It’s almost as if the relationship between these “proxies” and temperature is far too complex and ill-understood for anybody to be able to extract convincing reconstructions–let alone predictive models–from them…
Maybe there has been little or no increase to extract.
Really interesting posts. Your comment previously about high resolution meaning high deposition rate, which means high biological activity which usually means nutrient rich cold water upwelling ( so declining temps) sure seems logical. It ought to be testable by looking at the present sea conditions at the core locations. I have begun searching for this data (e.g. Thermocline depth, surface organism turbidity) but am not having much luck so far. Would make a great paper if the oceanographic data existed.
Regards
This is fairly close to the Greenland GISP2 ice core in location, but the wiggles are way off. The alkenone proxy shows a big warming around 700-500 BC, which falls in between the Minoan and Roman warm periods that show up on the GISP2 core and in historical records.
Steve,
This recent study:
Phytoplankton Calcification in a High-CO2 World
M. Debora Iglesias-Rodriguez, et al.
Science 320, 336 (2008)
Shows that the rate of growth of phytoplankton has significantly increased as atmospheric CO2 has increased, and the authors seem to suggest that in nutrient rich waters (areas of deep convection or upwelling) the increase is likely more. Aside from the rather surprising result of increased (not decreased!) phytoplankton growth at higher atmospheric CO2 level (to at least 750 PPM), the paper raises questions in my mind about the potential of CO2 availability causing metabolic changes, perhaps including an alteration of the metabolic pathway which controls alkenone composition. For any given atmospheric concentration of CO2, colder surface water leads to (on average) higher dissolved CO2 content, which is also what happens when atmospheric CO2 rises at constant (or even increasing) temperature. If the availability of dissolved CO2 regulates alkenone composition, at least in part, then rising atmospheric CO2 would automatically lead to a ‘divergence’ between ocean surface temperatures and alkenone composition since the industrial revolution.
Over glacial cycles both atmospheric CO2 content and ocean surface temperatures changed significantly. Could this mean that alkenone composition during cold glacial periods is measuring not temperature alone but some combination of reduced atmospheric CO2 and cooler ocean surface temperature? If so, then the alkenone record for glacial periods could understate the true level of ocean cooling relative to warmer (and higher CO2) interglacials.
Controlled phytoplankton culture experiments comparing composition of alkenones formed at constant temperature but different dissolved CO2 levels would be most informative.
I’m just some guy who is interested in this stuff, even though I have zero mathematical/statistical skills. But I still don’t see how taking all these squiggles which go in all different directions, averaging them, and calling the result something globally meaningful, can be valid.
Jeff,
Yes, that’s exactly the problem. There aren’t enough proxies that correlate well with the instrumental era. Slather on a layer of questionable statistical gyrations from members of the hockey team and you’ve got a lot of data that doesn’t add up to much. To adapt a rather wonderful phrase originally coined about economists, the role of hockey team paleo-climate research is to make astrologers look respectable.
Another high resolution Alkenone series off of Iceland, Bendle et al circa 2006. Seems to resemble Sicre.
http://hol.sagepub.com/content/17/1/9.full.pdf+html
Could the proxies be painting an excessively “high definition” picture of geographic dynamics?